Year: 2019

  • PPI Spells Trouble for Economy

    Core PPI fell in July for the first time since early 2017, registering a 0.1% decline versus a 0.1% consensus gain. The annual rate was 2.1%, also the lowest since 2017.

    Stripping out trade services as well, the index fell (-0.1%) for the first time since 2015. The annual rate was 1.7% versus +2.1% in June.

    Adding in food and energy, PPI gained 0.2% MoM, even though oil prices fell in July. To complicate things, the cost of goods rose 0.4% in July.

    Bottom line, these data are not reflective of a strong economy, let alone the “greatest economy in the history of America.”  This is an economy which is struggling despite historically low interest rates.

    continued for members…
    (more…)

  • Update on Gold: Aug 8, 2019

    In our last update [see: June 17 Update on Gold] we looked at GC’s latest assault on the horizontal resistance at 1370 — the target we established when resuming a long position in May.  It had tested this resistance multiple times since 2016 — and failed.  Given that DXY was overextended, this time seemed different.

    History says GC will be rebuffed somewhere between today’s highs and 1380.90 and will retreat to around 1224-1241.60. But, as long as GC can remain above 1346.70, it makes sense to remain long with stops back around 1345. Maybe this will be the time it finally breaks out.

    In fact, this time was different.  GC popped through 1370 with little fanfare and, after some hemming and hawing, tagged our next upside target at 1484 earlier this week.

    This begs the question we’ve been asking for several years, now: what will happen if gold ever completes the gigantic Inverted Head & Shoulders pattern?

    continued for members(more…)

  • Update on Bonds: Aug 7, 2019

    We called the top on the 10Y on October 10, 2018 [see: Plan B] with rates at 3.24% and ZN at 117’230.

    …I’ve always been inclined to believe more in the yellow channel — which says that 10Y yields have now topped and ZN has bottomed.

    Since then, I’ve taken a “show me” attitude toward rates, setting a target or two at a time and updating as they were met — with the 15.54 target officially in play once TNX dropped through 21.72 a few months ago. But, the price chart has been crystal clear ever since December [see: December 26 Update on Bonds] with a critical target of 130’20 – 130’23.

    From last December…

    …and, this morning.

    It’s always fun to nail a target so precisely many months in advance.  But, the excitement quickly fades once the pressing question sets in: what now?

     *  *  *

    Meanwhile, the equity funhouse is about to reopen.  Our analog is still very much on track, supported by yesterday’s head fake and this morning’s plunge.  Many of the stocks we follow have tagged their next downside targets. It’ll be interesting to see how long they can hold up in the face of lower lows.

    Isn’t it funny how, with all the market turmoil, no one’s talking about DB’s latest breakdown?

    continued for members(more…)

  • My Favorite Thing

    My favorite thing about analogs is that they provide a roadmap for rips and dips that would otherwise frustrate the hell out of you.  We went short near the top and have already reached our initial target.

    I know some members have done quite nicely over the past few days, but it’s not the 6.8% drop that excites me (though it is fun to be making money when everyone else is running around with their hair on fire!)  It’s the prospect of reaping some of the 23 major swings averaging 298 points and 11.2% that our analog indicates are coming our way.

    For those who aren’t active traders, the analog offers an equally important benefit: the ability to hedge in advance of a day like yesterday or the significant move that’s coming.  In a world where money managers are considered a raging success by beating the market by 2-300 bps, avoiding a 7% loss is huge.

    Now, on to the markets.  The futures were busy overnight.

    continued for members(more…)

  • Analog Update: Aug 5, 2019

    Since the top came two sessions earlier and 0.6% lower than our original forecast called for, I’ve spent the weekend adjusting the price and timing targets for the next 9 months.  If it continues to play out as it has so far, the total drop will be greater than anything we’ve seen since the GFC.

    It will feature 9 peak-to-trough moves of over 10%, 3 of which will exceed 20%. I’ve mapped out 23 significant turning points which average almost 300 points each.  In short, it will be a trader’s market.  It will test the resolve of buy-and-hold investors and trash the returns of momentum investors.

    Buckle up.

    continued for members(more…)

  • A Great Start

    Futures have been all over the map since yesterday’s close.  SPX bounced slightly below the initial downside target from our analog first mapped out on July 15 and confirmed on July 30 [see: Ringing the Bell] — but, well ahead of schedule thanks to Trump’s latest China trade salvo.

    The 3% drop from the top is nice.  But, the great thing about analogs is that they offer a predictable path through the otherwise indecipherable and often illogical twists and turns.  Since the top came early, it’s possible that everything else will come early.

    I’ll be working on adjusting the timeline today.  In the meantime, CL and RB bounced where expected, VIX reversed where expected, SPX and ES should test their SMA50s today and the 10Y is making a beeline for our downside targets.

    For those watching them, BA just nailed our red target from a couple of weeks ago… …and, AMZN is well on its way.Should be another very interesting day.

    continued for members(more…)

  • That Escalated Quickly!

    In the immortal words of Ron Burgundy, “that escalated quickly!”

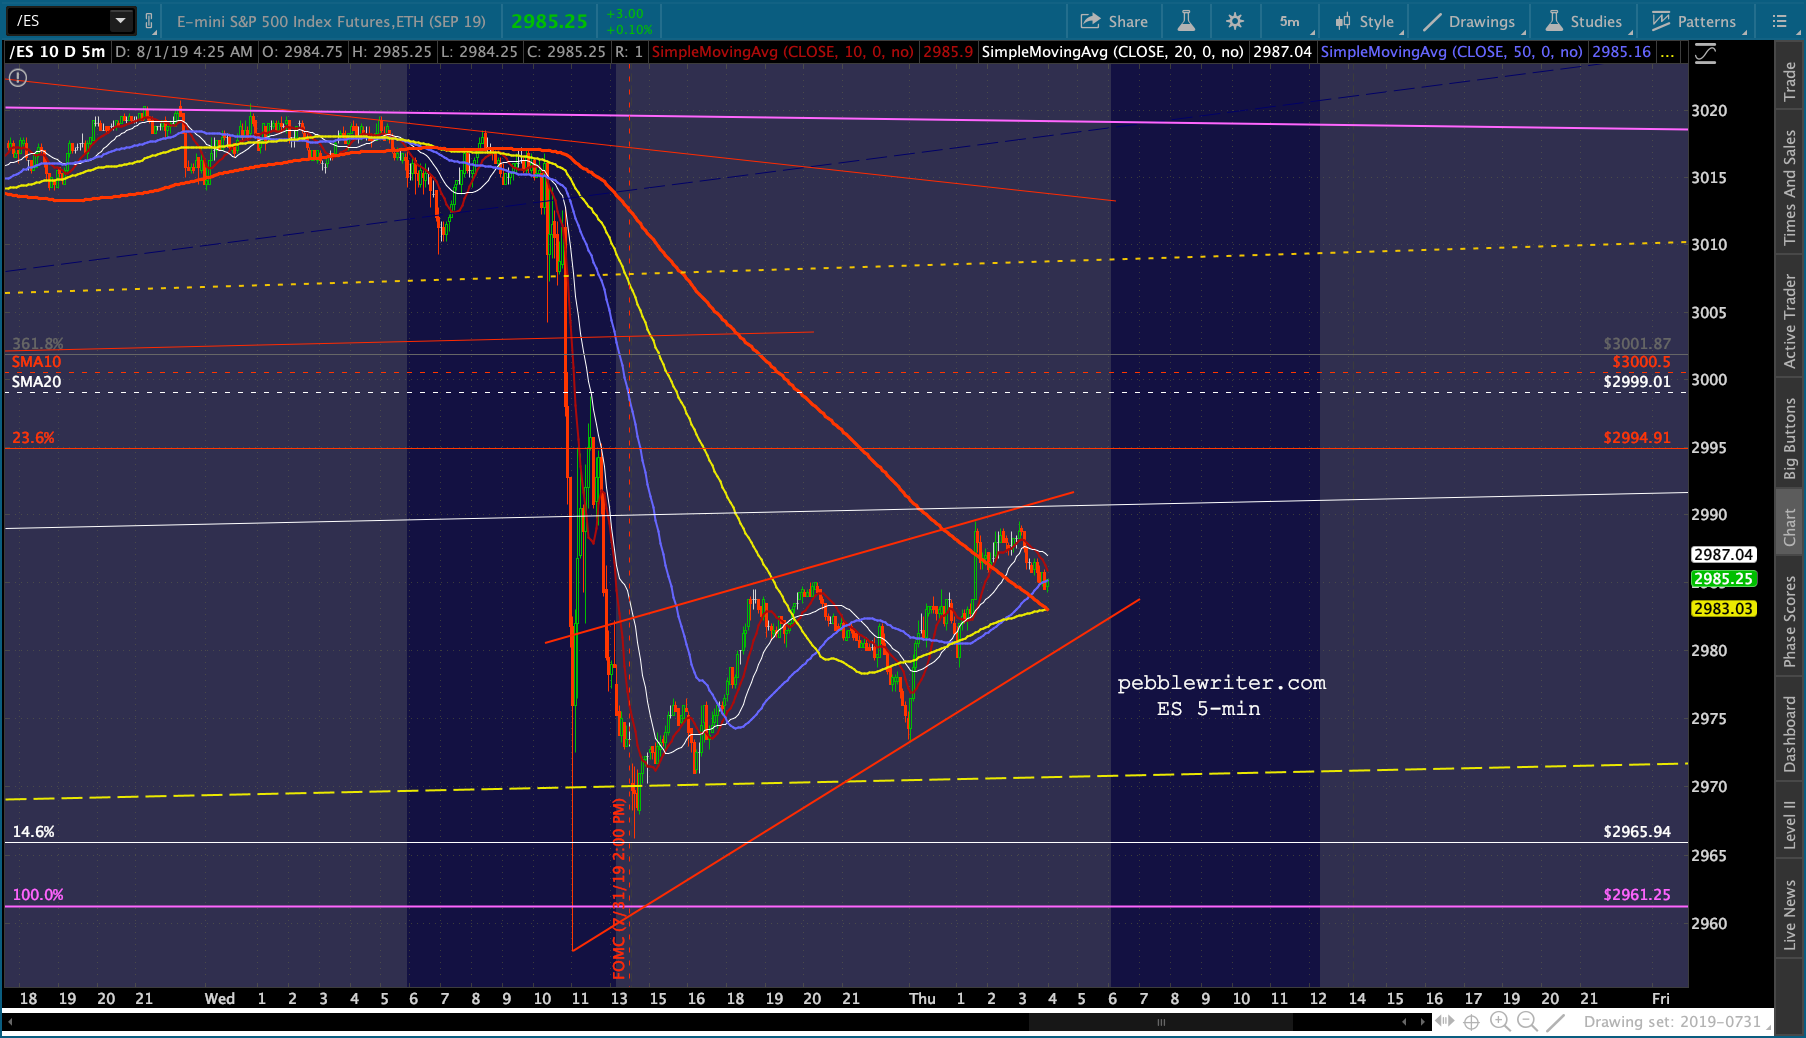
    Sure, the algos weren’t happy with the phrase “mid-cycle adjustment.”  But, you can’t help wondering how many algos and carbon-based investors were disappointed that with 3.7% unemployment and 2.1% GDP growth the Fed saw the need to cut in the first place.Maybe the Fed knows something the market doesn’t.  Maybe the rosy economic statistics don’t tell the whole story.  Or maybe, just maybe, all the market cares about any more is how vigorously the Fed will support equity prices.

    In any case, futures have bounced back 27 points from yesterday’s lows and are back atop the SMA5 200.  All is well, right?

    Not so fast.  The knee-jerk pop in USDJPY has already reversed, oil’s protective pop is unwinding, and VIX seems to have more room to run.

    Our analog pointed to July 30 as a cycle high.  But, we’ve been within 1% of our upside target 7 of the 13 sessions since July 15 when we first pulled the trigger.

    Again, when we’re only 1% away, it could turn at any time and may indeed have turned already.  I’d be very comfortable being short here at 3017.

    This is not like every other “buy the dip” setup.

    continued for members(more…)

  • FOMC Day: Jul 31, 2019

    It’s been a long time coming and the subject of unending debate.  Almost everybody expects a 25 bps cut — though those who argue against a cut make very compelling arguments.

    Consider the last time the Fed cut rates.  It was December 16, 2008 and they cut the target rate range by 75-100 bps — the same extent that Trump is arguing for now.  The circumstances are clearly a little different this time:

    Perhaps the biggest contrast between now and then is who’s running the show.It’s anyone’s guess what the FOMC will do and Powell will say.  Our analog suggests the market will be disappointed.  Our yield curve model suggests the market will be disappointed. The currency picture suggests the market will be disappointed.

    Even the futures seem rather blasé following yesterday’s enthusiastic bounce on the SMA10.Most importantly, all the effort Trump has put into driving oil and gas prices lower in order to force inflation lower and pressure the Fed into more accommodative policy has: (a) already driven interest rates much lower, and (b) sends bearish signals to the algos which are largely responsible for the market’s day-to-day gyrations.

    The Fed obviously knows this and has taken it into account in its rate decision deliberations.  It’s the most significant factor behind CPI dropping through Core CPI.The question remains whether or not the data they’ll depend in making their decision includes the stock market’s likely reaction — always a safe bet in the past.

    We’ll find out shortly.

    continued for members(more…)

  • Ringing the Bell

    Conventional wisdom says no one rings the bell at market tops.  We’re ringing it anyway.  If our analog is correct, this is about as high as stocks will go.  If SPX pops above 3047, then there’s more upside to come (with an asterisk referring to central banks of course.)  But, until then, momentum is with the bears.

    “Targeting 2% inflation and bringing down unemployment” made for a nice central bank slogan. But, it’s really been all about running interest rates into the ground in order to generate higher prices.  In that sense, this has been a rousing success.

    We’ll never know, however, what the economy would have accomplished without the so-called “wealth effect.”  And, we’ll never know what might have happened if prices had been allowed to clear via market forces.

    Today’s poster child: McDonalds Corp.  See if you can spot the point at which the board decided to hop on the buyback bandwagon.Stay tuned.  It should be an interesting next few days.

    continued for members(more…)

  • Update on DJIA: Jul 29, 2019

    In our last dedicated post six months ago, we discussed the critical resistance DJIA faced: the neckline of a large H&S Pattern.

    …it’s important to note that like SPX and COMP, [DJIA] is backtesting a point of potentially strong resistance — the neckline of a large Head & Shoulder Pattern that never completely paid off.

    DJIA’s reversal had occurred 500 points short of the indicated target and was thus susceptible to another leg down following the backtest that, ideally, would align with a significant channel line or Fib level.

    But, the White House had other ideas. Mnuchin planted a story with the Journal that the China tariffs might be lifted.  Combined with the ongoing beatdown on VIX, DJIA sliced through the neckline like it wasn’t even there.  Of course, it was careful to observe the neckline in the midst of a backtest once it was recast as support (which involved a second busted H&S.)

    Since then, DJIA has ignored a potential triple top and pushed to new highs which just so happen to mark two significant points of overhead resistance.  I know, I know…fool me once and all that.But, this time might just be different.  We’ve been following an analog for the past two weeks which has been quite accurate so far.  If it plays out, DJIA might have already peaked and could be facing a significant decline.

    continued for members(more…)