It’s been a long time coming and the subject of unending debate. Almost everybody expects a 25 bps cut — though those who argue against a cut make very compelling arguments.
Consider the last time the Fed cut rates. It was December 16, 2008 and they cut the target rate range by 75-100 bps — the same extent that Trump is arguing for now. The circumstances are clearly a little different this time:
 Perhaps the biggest contrast between now and then is who’s running the show.
 It’s anyone’s guess what the FOMC will do and Powell will say. Our analog suggests the market will be disappointed. Our yield curve model suggests the market will be disappointed. The currency picture suggests the market will be disappointed.
Even the futures seem rather blasé following yesterday’s enthusiastic bounce on the SMA10. Most importantly, all the effort Trump has put into driving oil and gas prices lower in order to force inflation lower and pressure the Fed into more accommodative policy has: (a) already driven interest rates much lower, and (b) sends bearish signals to the algos which are largely responsible for the market’s day-to-day gyrations.
The Fed obviously knows this and has taken it into account in its rate decision deliberations. It’s the most significant factor behind CPI dropping through Core CPI. The question remains whether or not the data they’ll depend in making their decision includes the stock market’s likely reaction — always a safe bet in the past.
We’ll find out shortly.
continued for members…
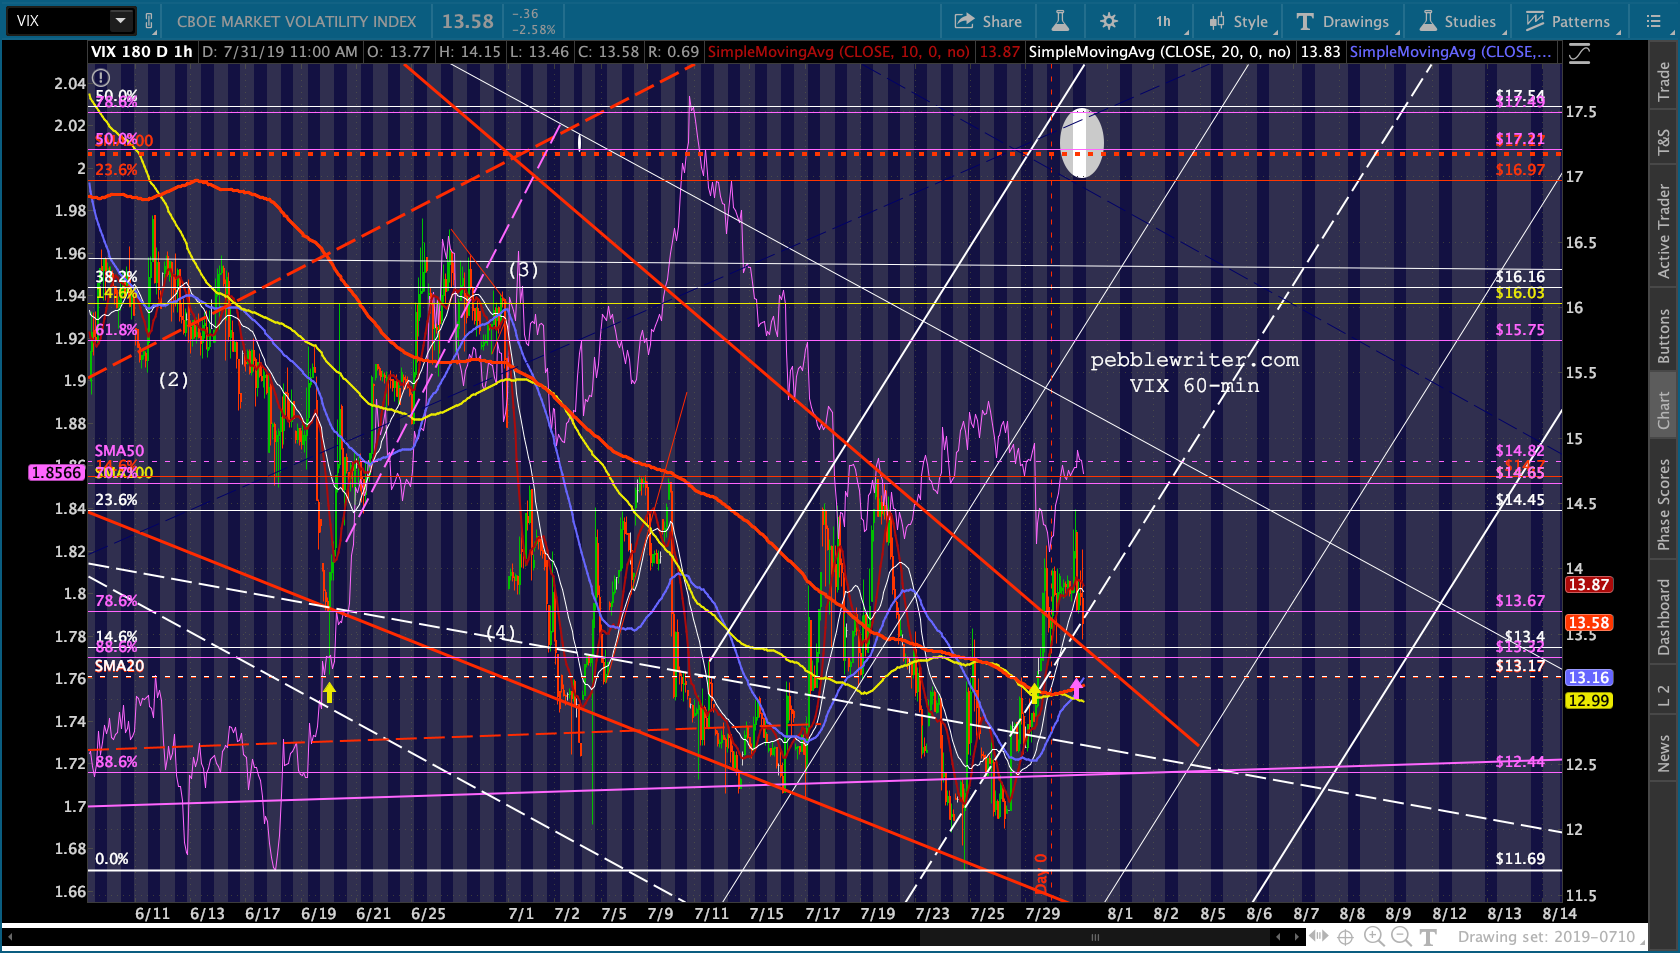
Note that the SMA10/20 cross in VIX had unwound itself as of a few moments ago.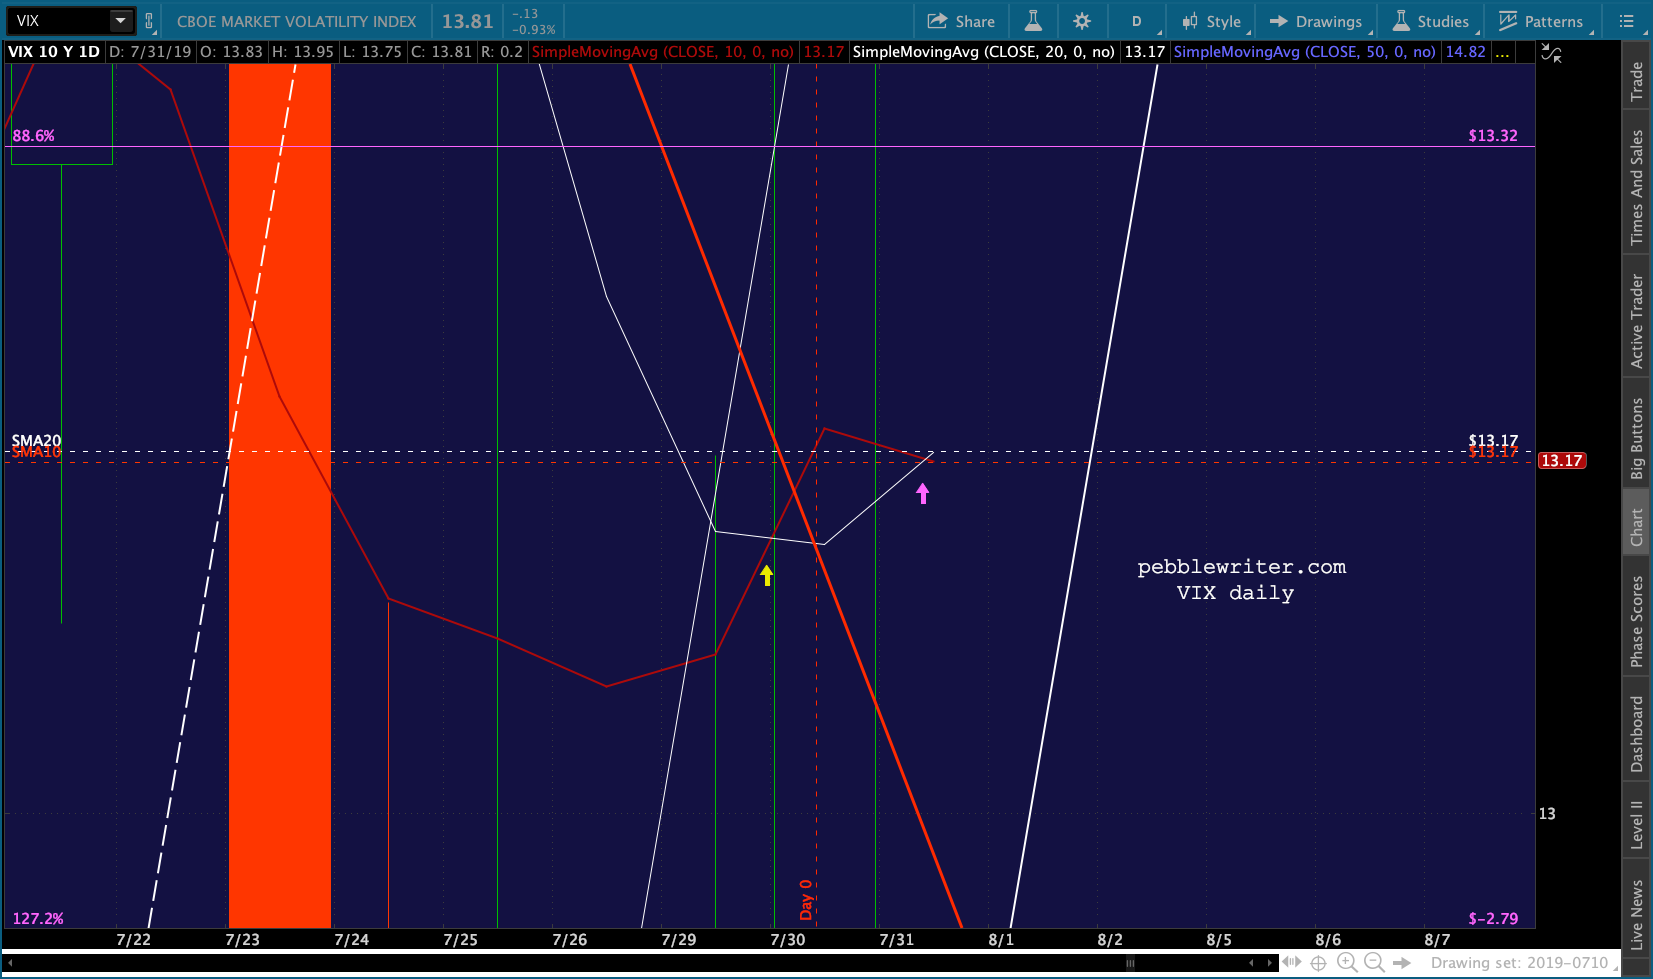 So, if nothing else, things are getting off to a slow start. Zooming out, the bear case is still very much intact — with VIX breaking out of the red falling wedge.
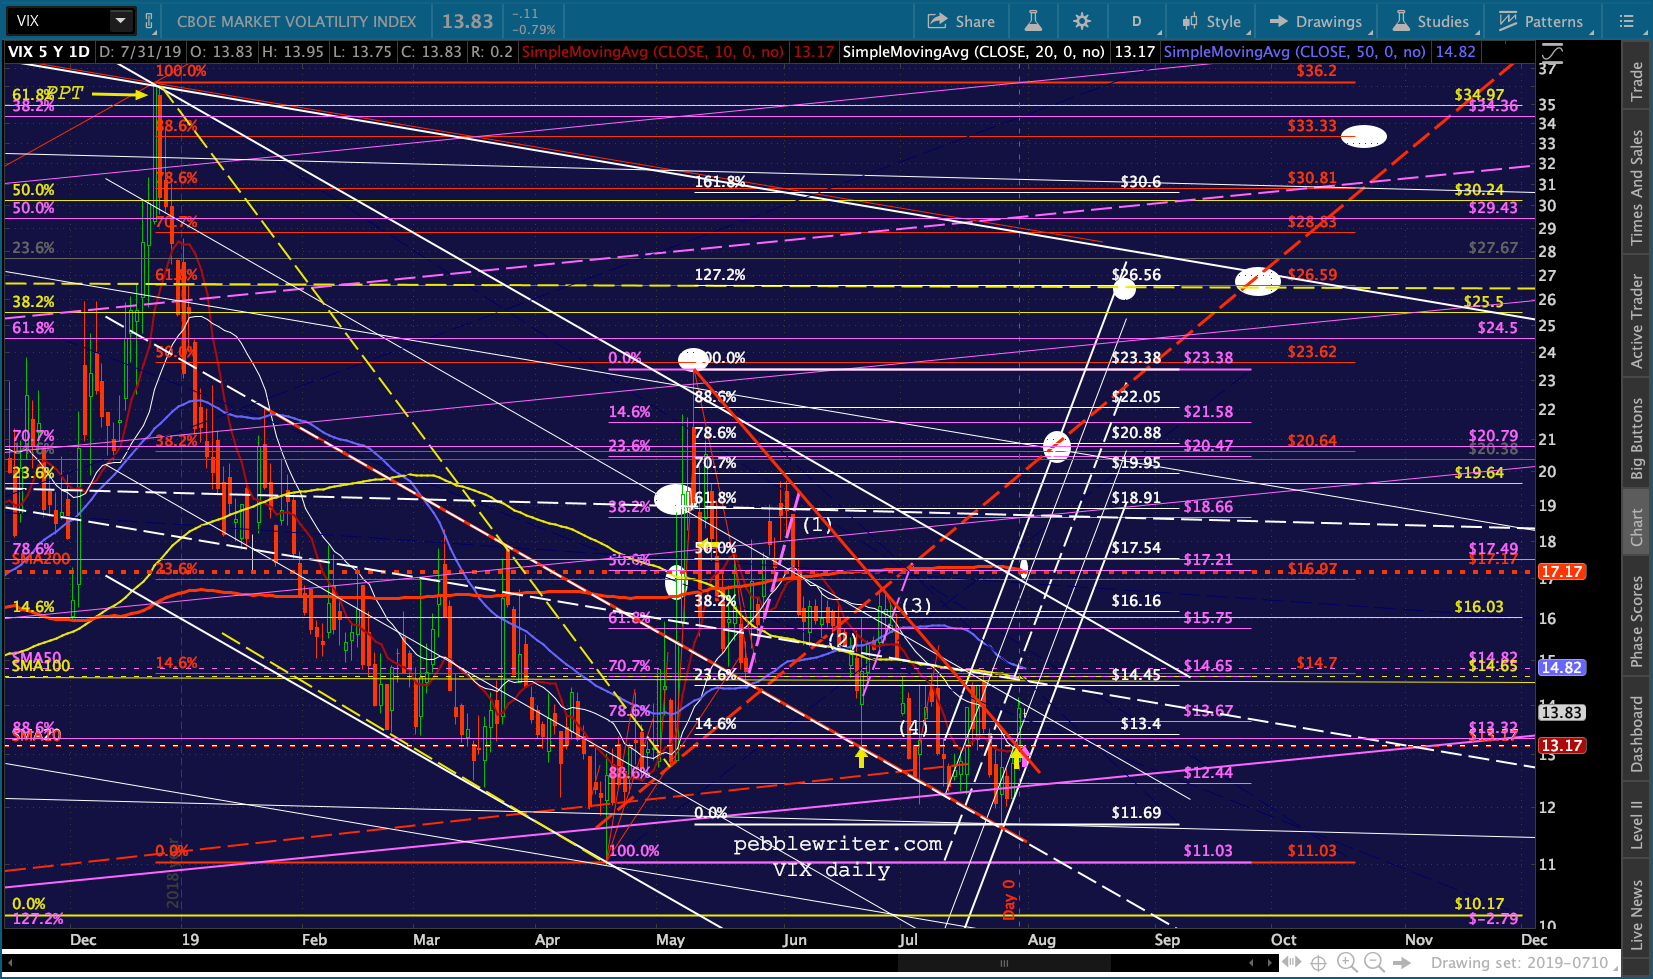 For now, our analog forecast remains unchanged.
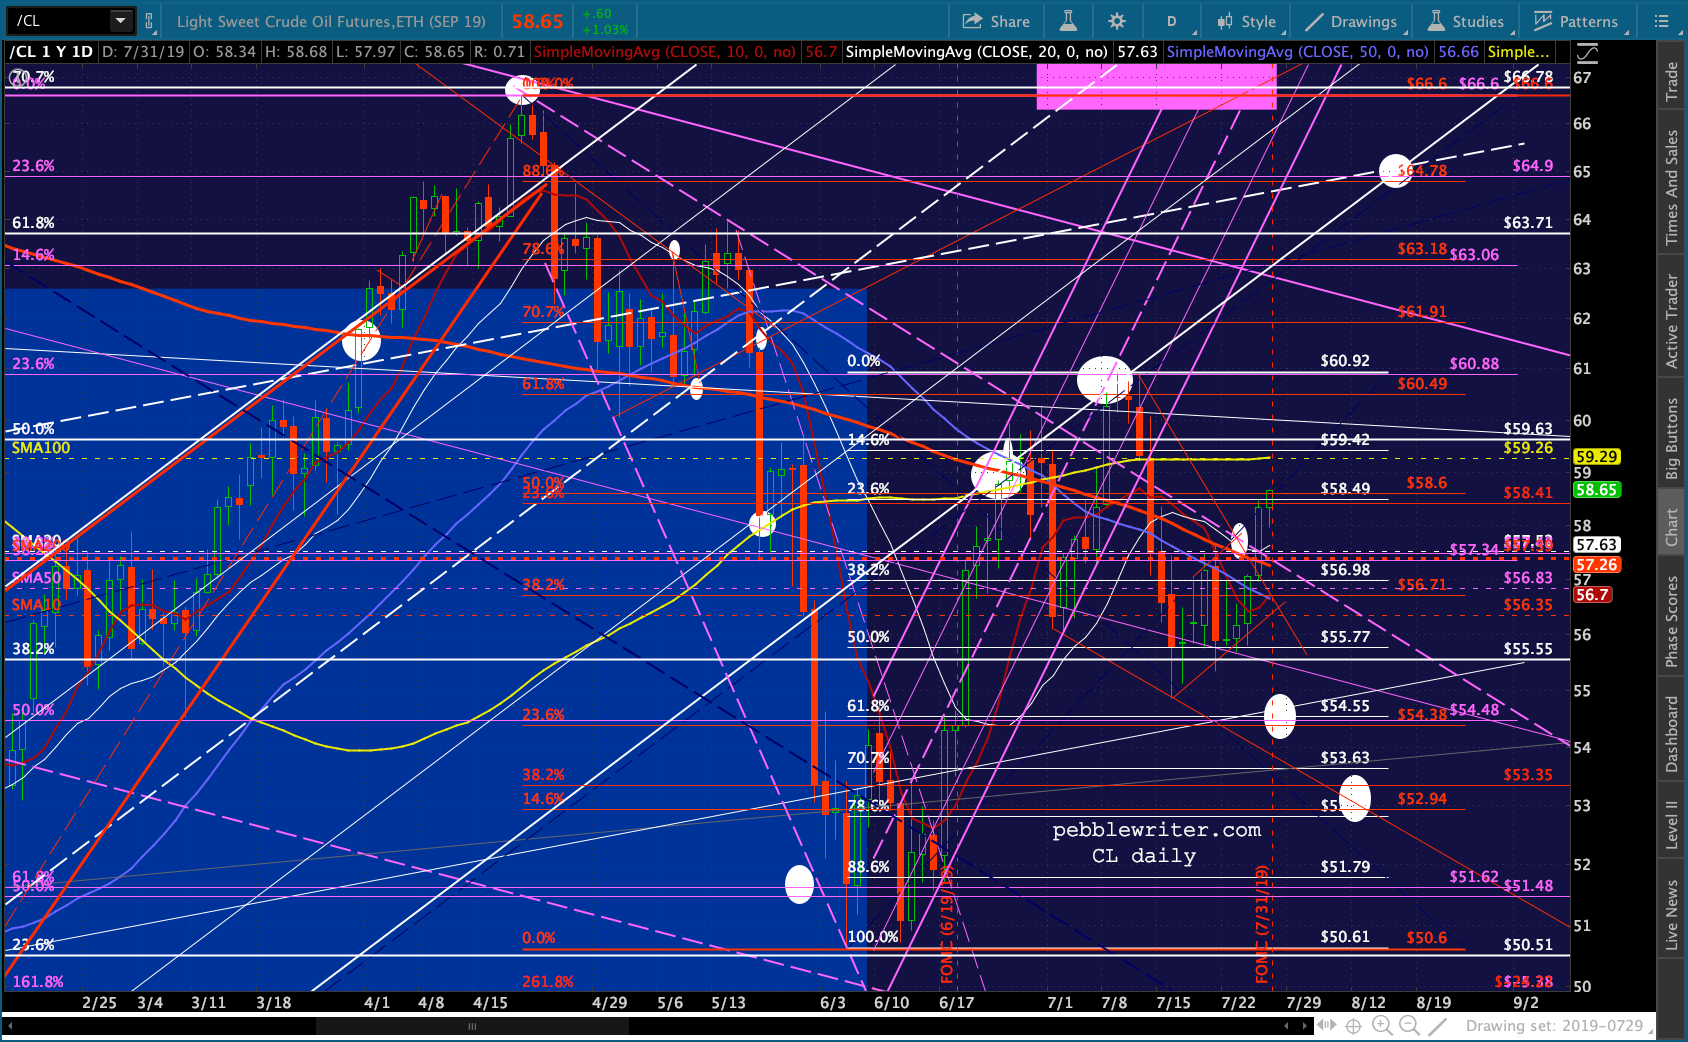
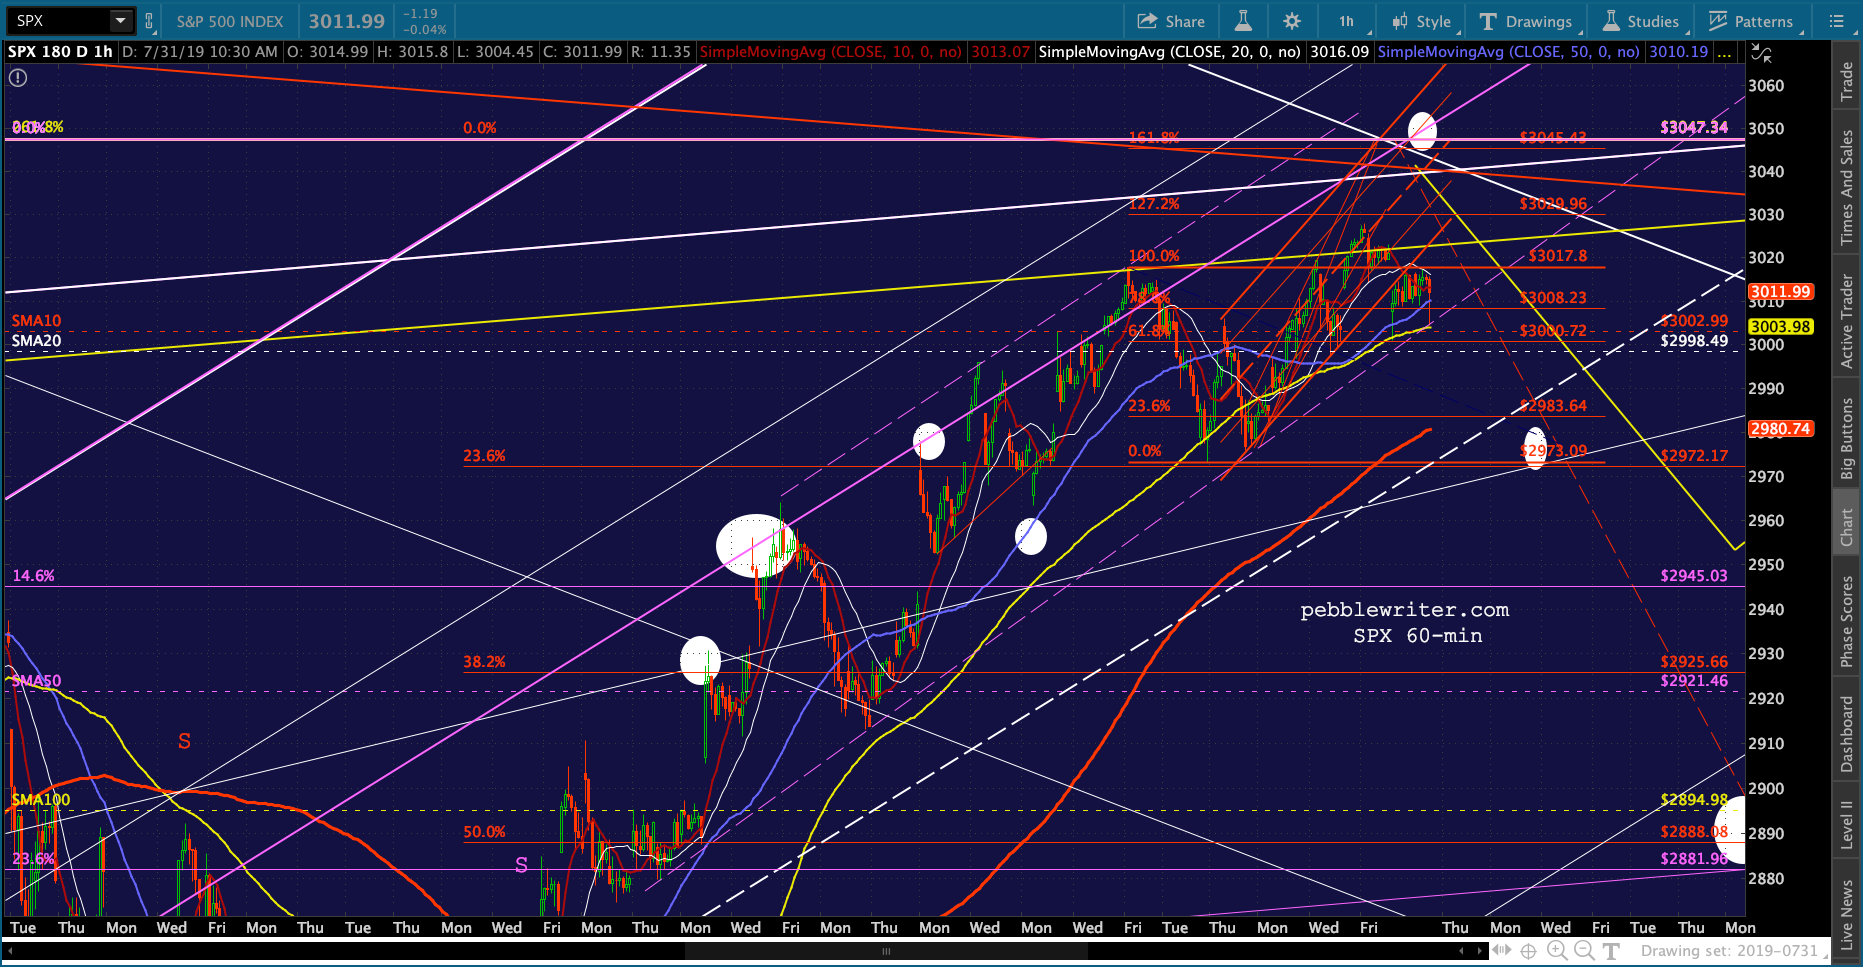
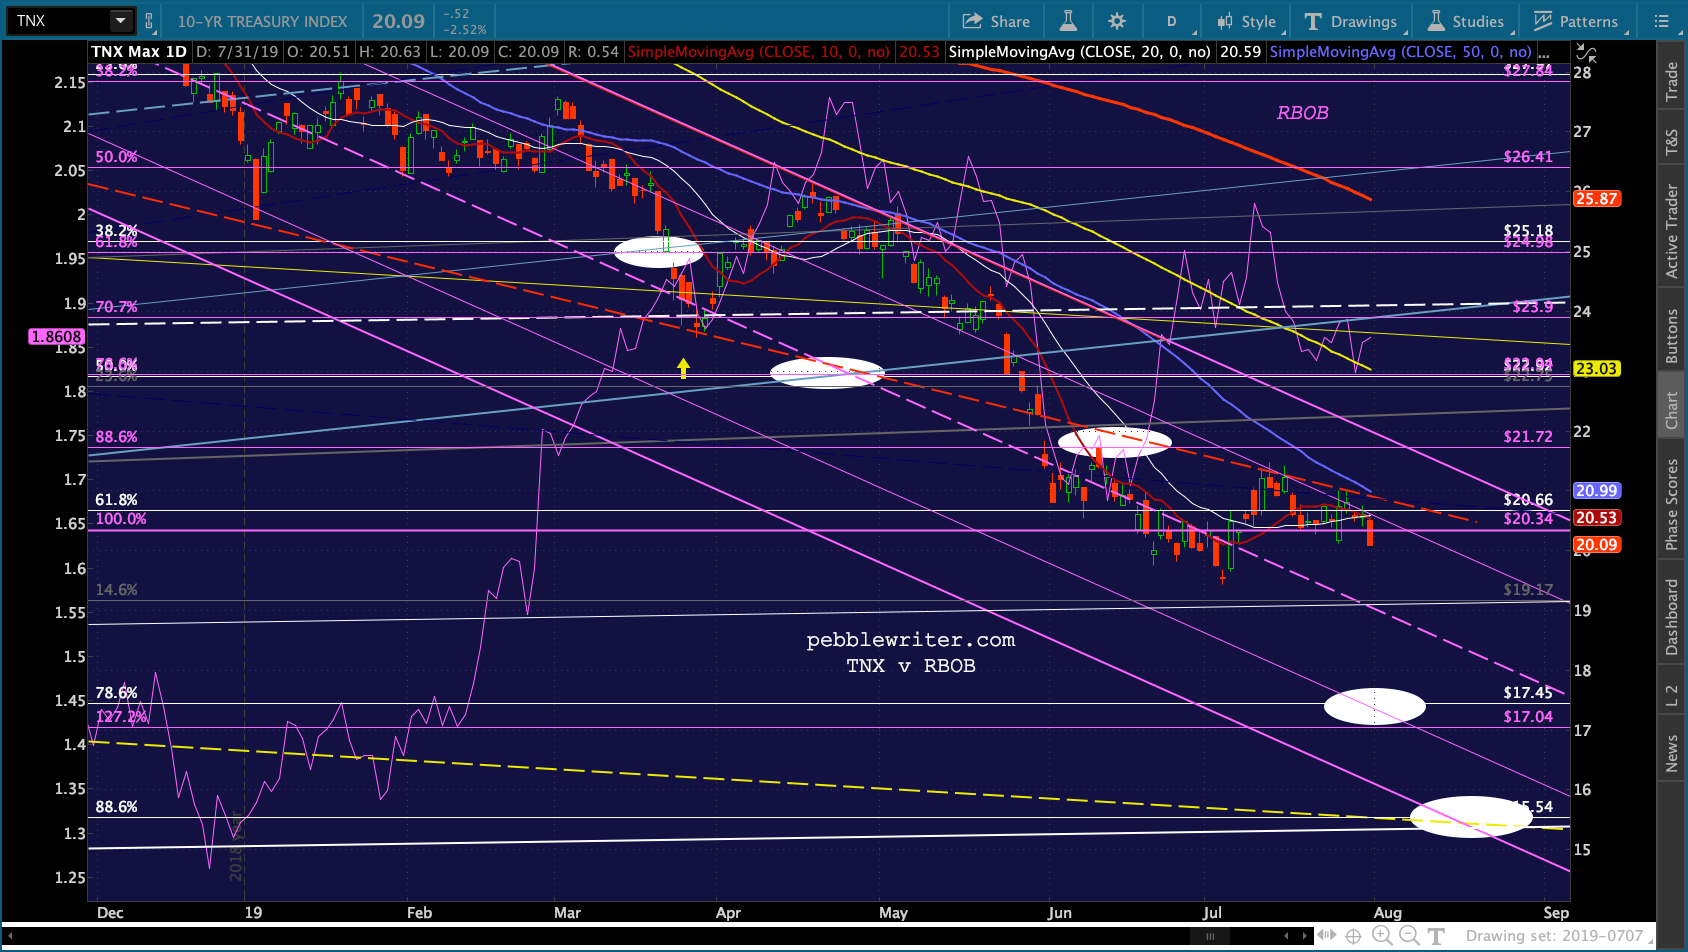
CL and RB have both bounced, with CL moving past the SMA200 and threatening another breakout beyond the purple TL. Recall the last time it did this on Jul 10, it was a major headfake which yielded a 10% collapse.
Remember, we get EIA inventories at 10:30 ET. This will be the last major economic data point to be released prior to the rate decision at 2.
 RB is being much less enthusiastic — which is exactly what one would expect in an environment where Trump is leaning on the Saudis to keep oil/gas prices low enough to justify lower interest rates and inflation (the better to pressure the Fed into cutting more/faster.)
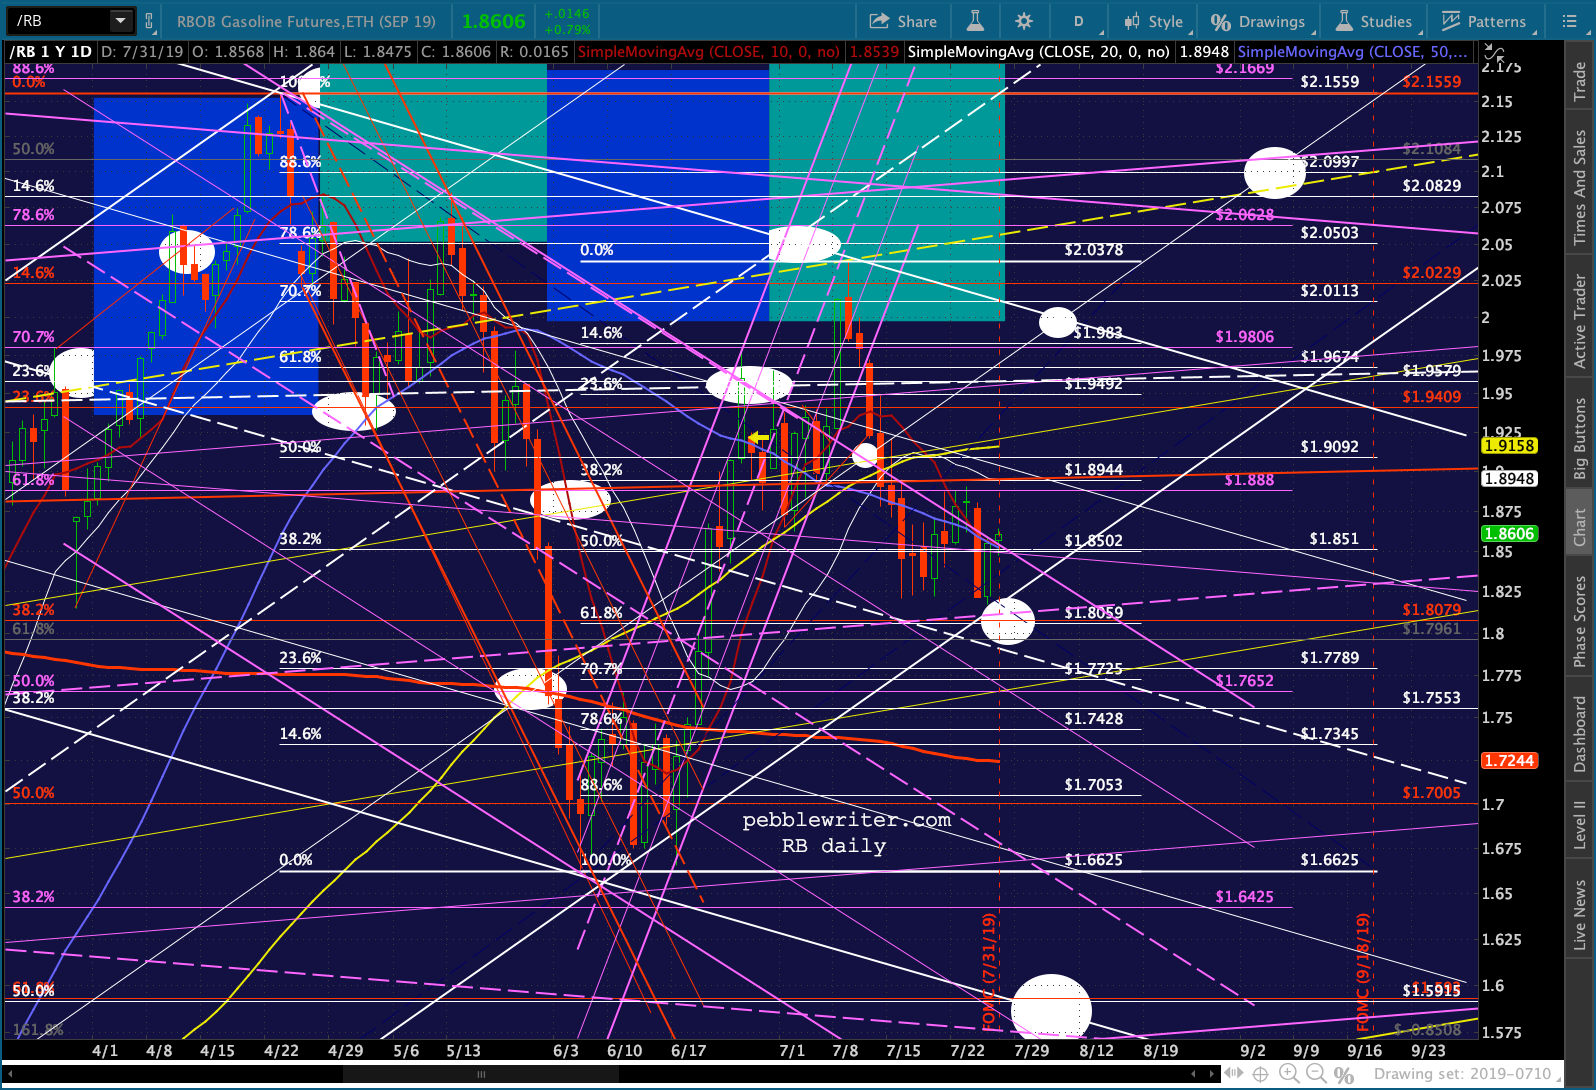 While USDJPY has seemingly been going sideways…
 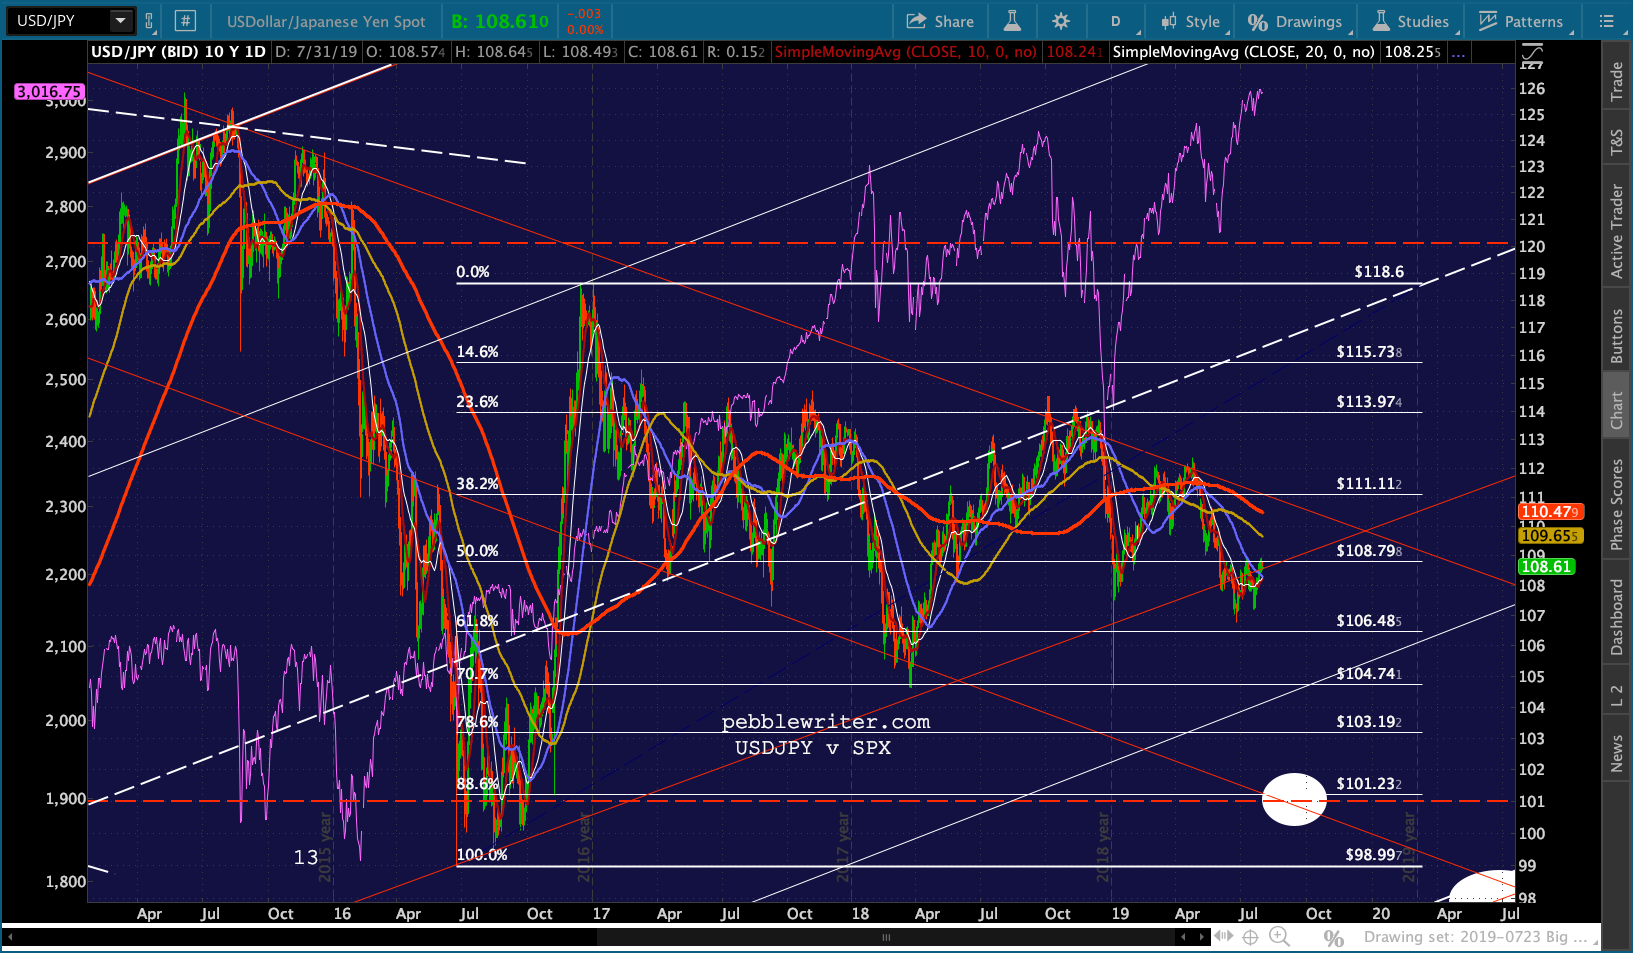 …and has formed a semblance of an IH&S Pattern, note that it passed on the opportunity to make a higher high.
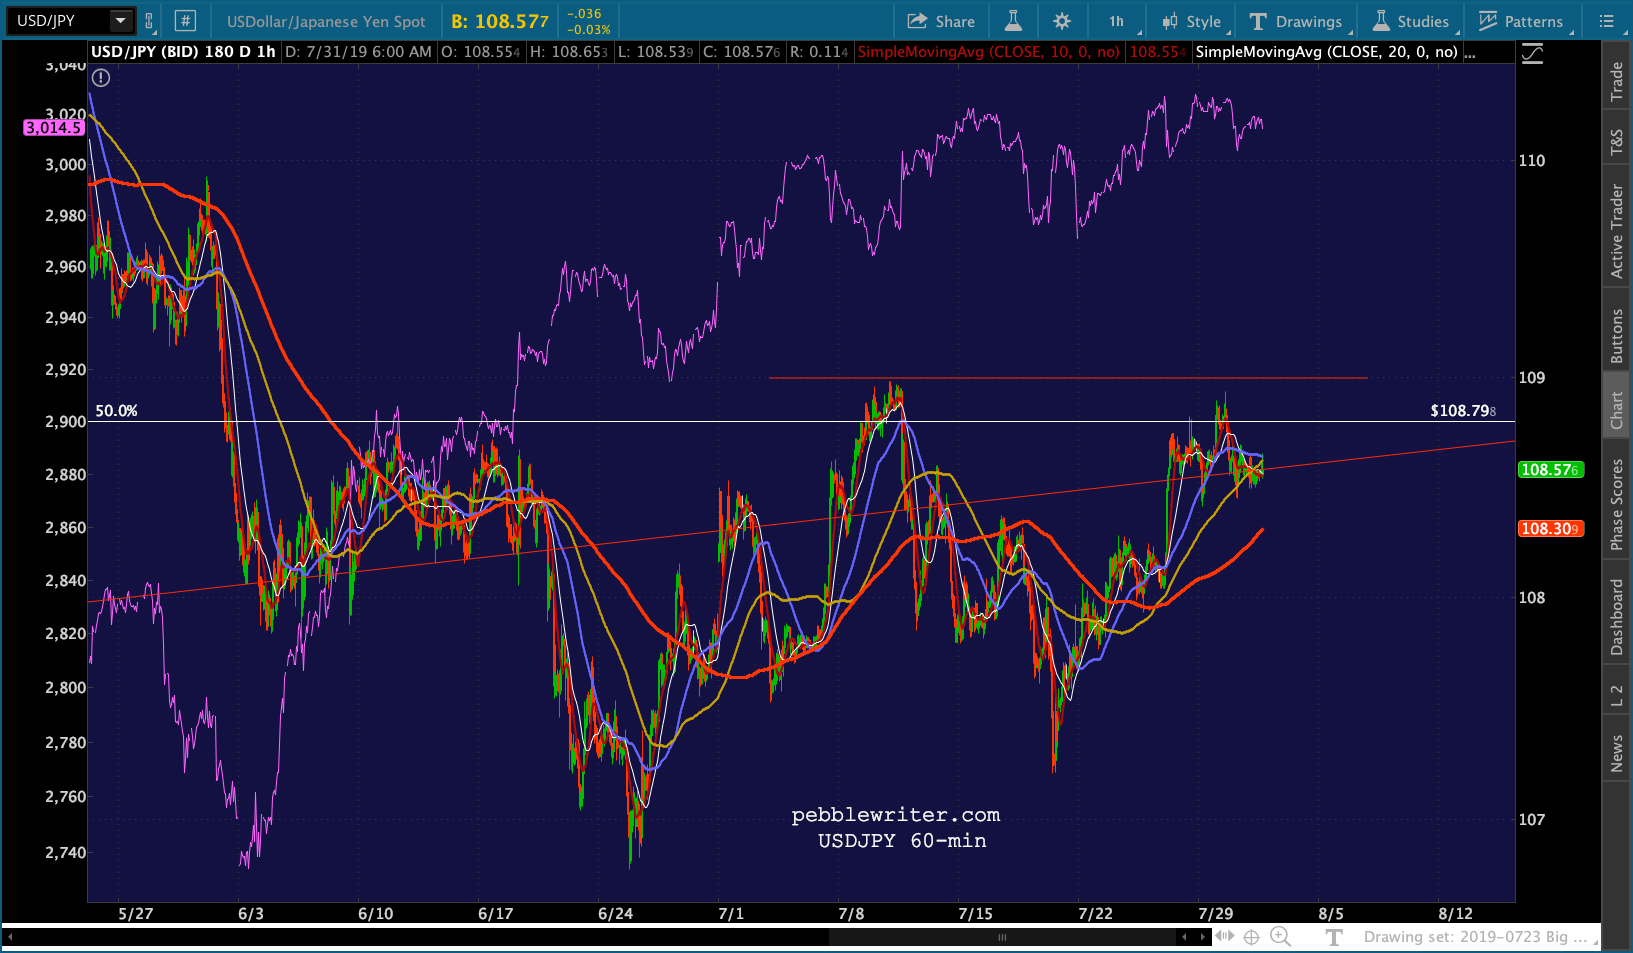 UPDATE: 10:30 AM
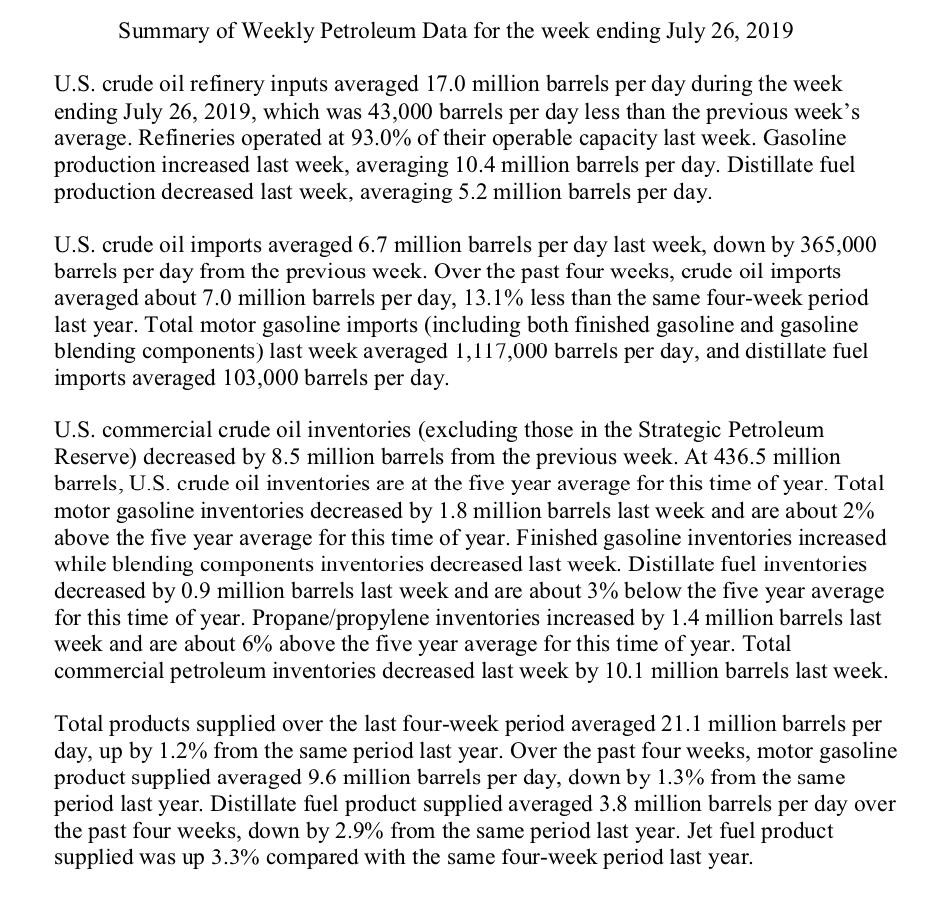
The EIA inventory report:
 Even though RB has extended its rally to 1.4% and CL to 1.1%, ES is off 1.25 points and SPX is off 3 points.
The EIA reported price for gasoline dropped 5.7 between July 2018 and July 2019. This is not enough to get the Fed excited about inflation being too low. Trump has two more months – August and September — before the YoY comparisons are subject to the massive plunge of Oct – Dec 2018.
If he really wants inflation to drop enough to move the needle, RB is going to come under greatly increased pressure.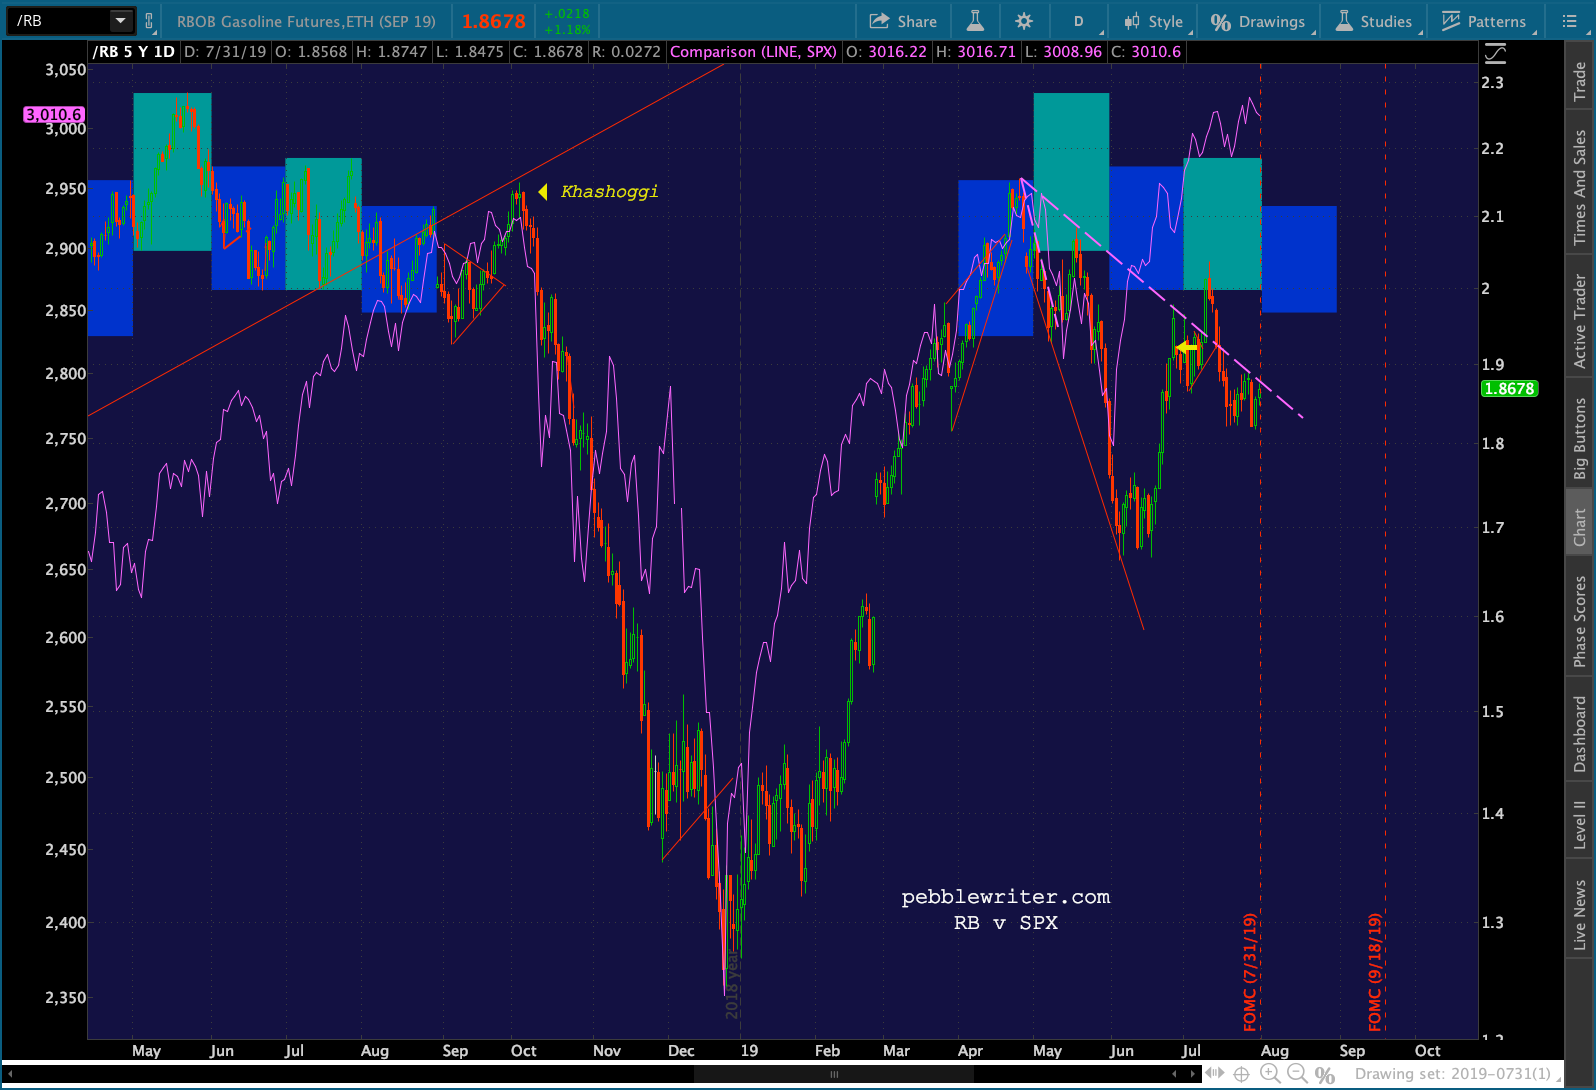 UPDATE: 2:15 PM
The decision: a 25 bps cut and an early end to QT. The market initially sold off as VIX spiked a bit. Since then, VIX has dropped and backtested the falling wedge, suggesting there’s more downside ahead for stocks.
 The 10Y is backing off.
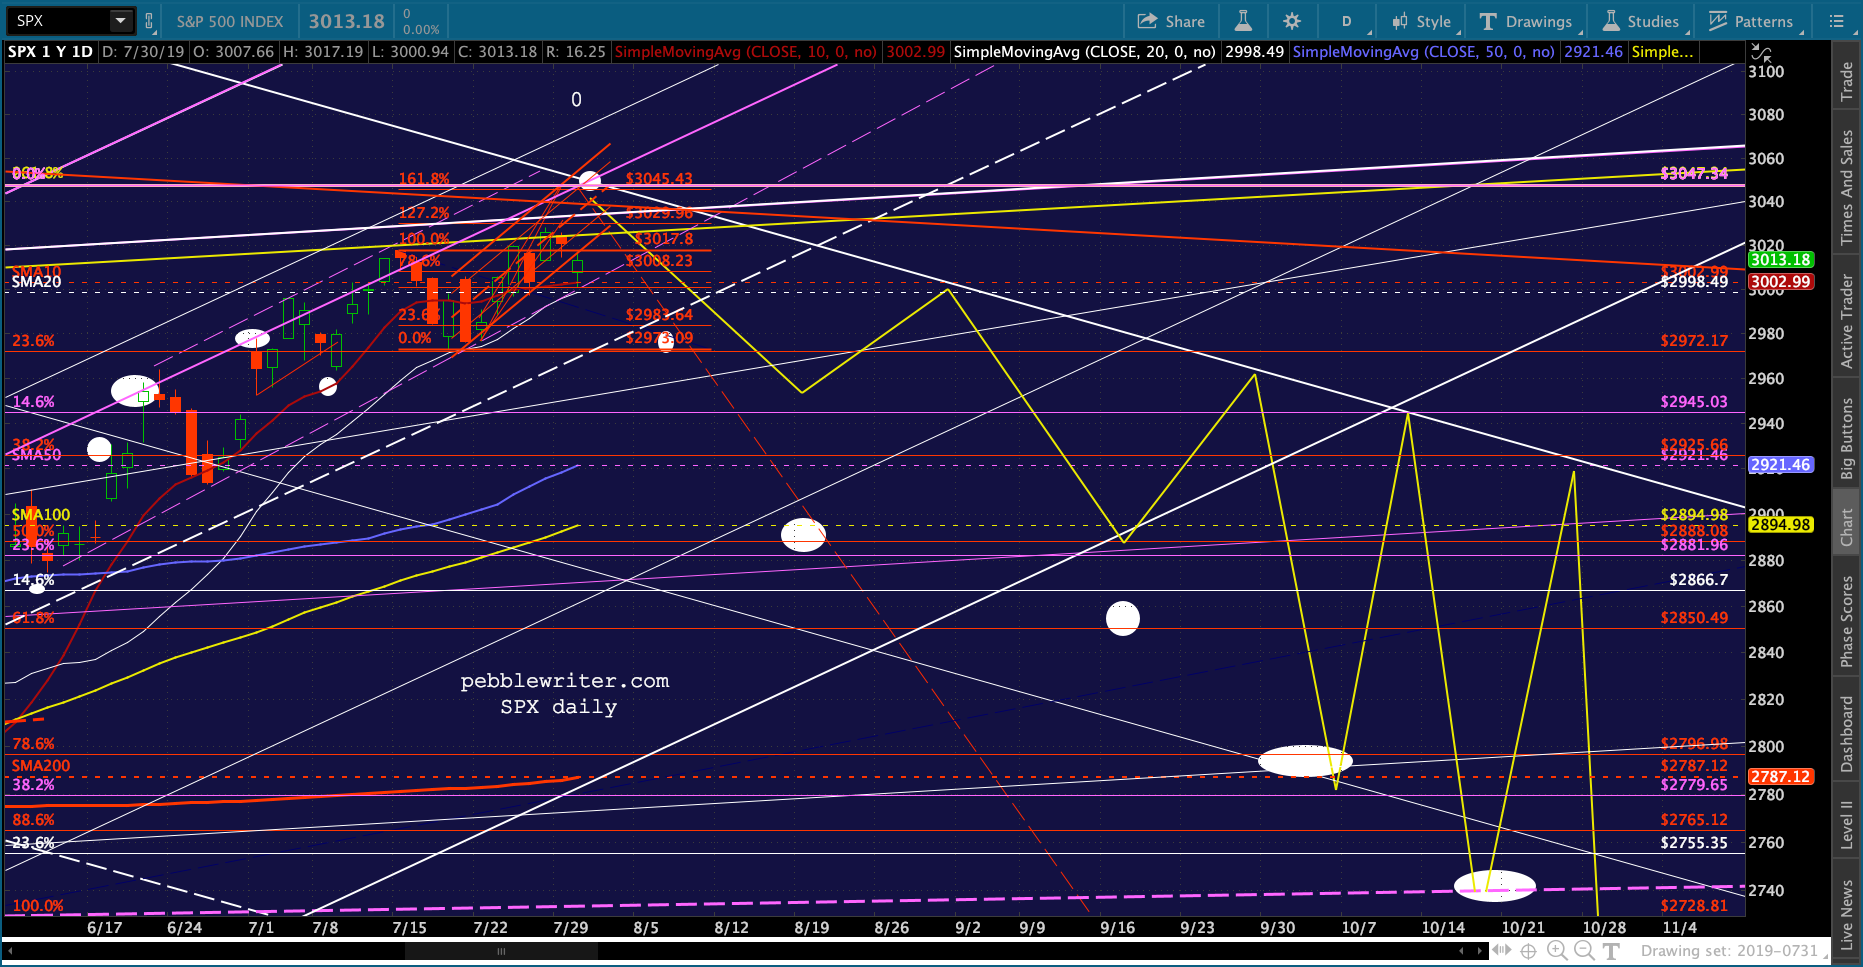
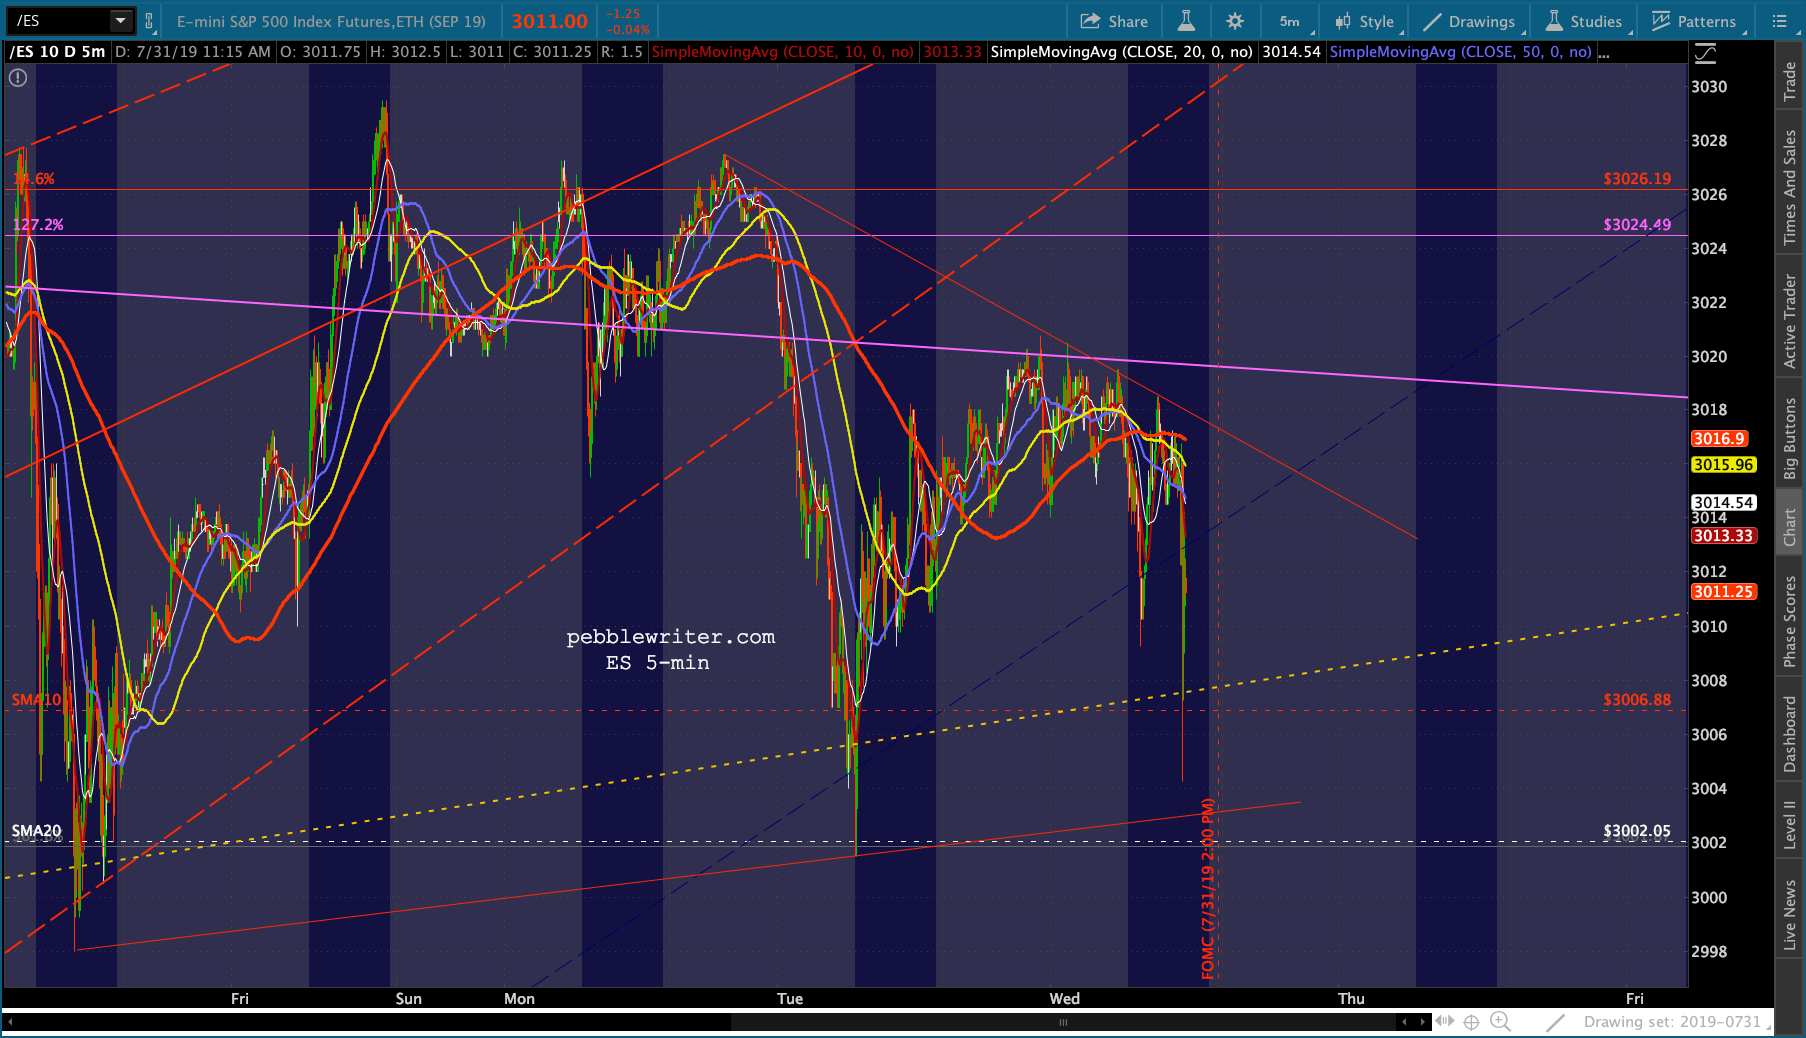
 Little H&S just completed…
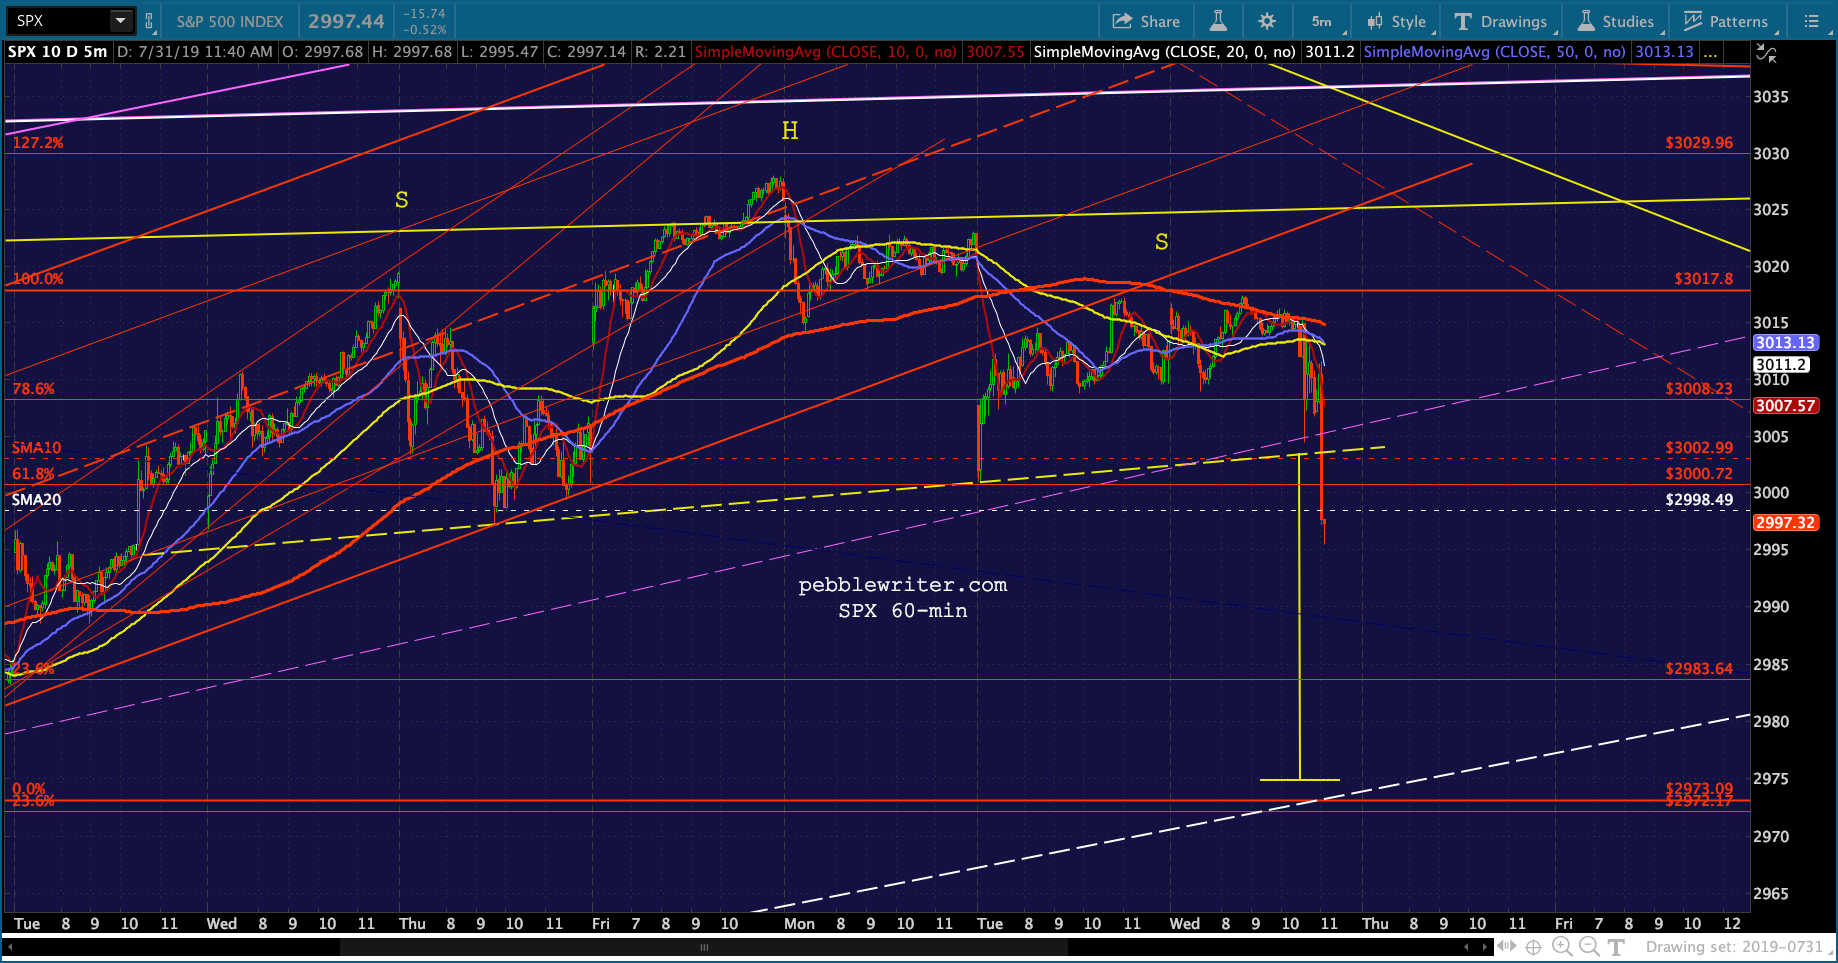 There are obviously many places at which it could bounce. But, if SPX bounces at 2973ish, it could set up a larger H&S Pattern targeting 2918.
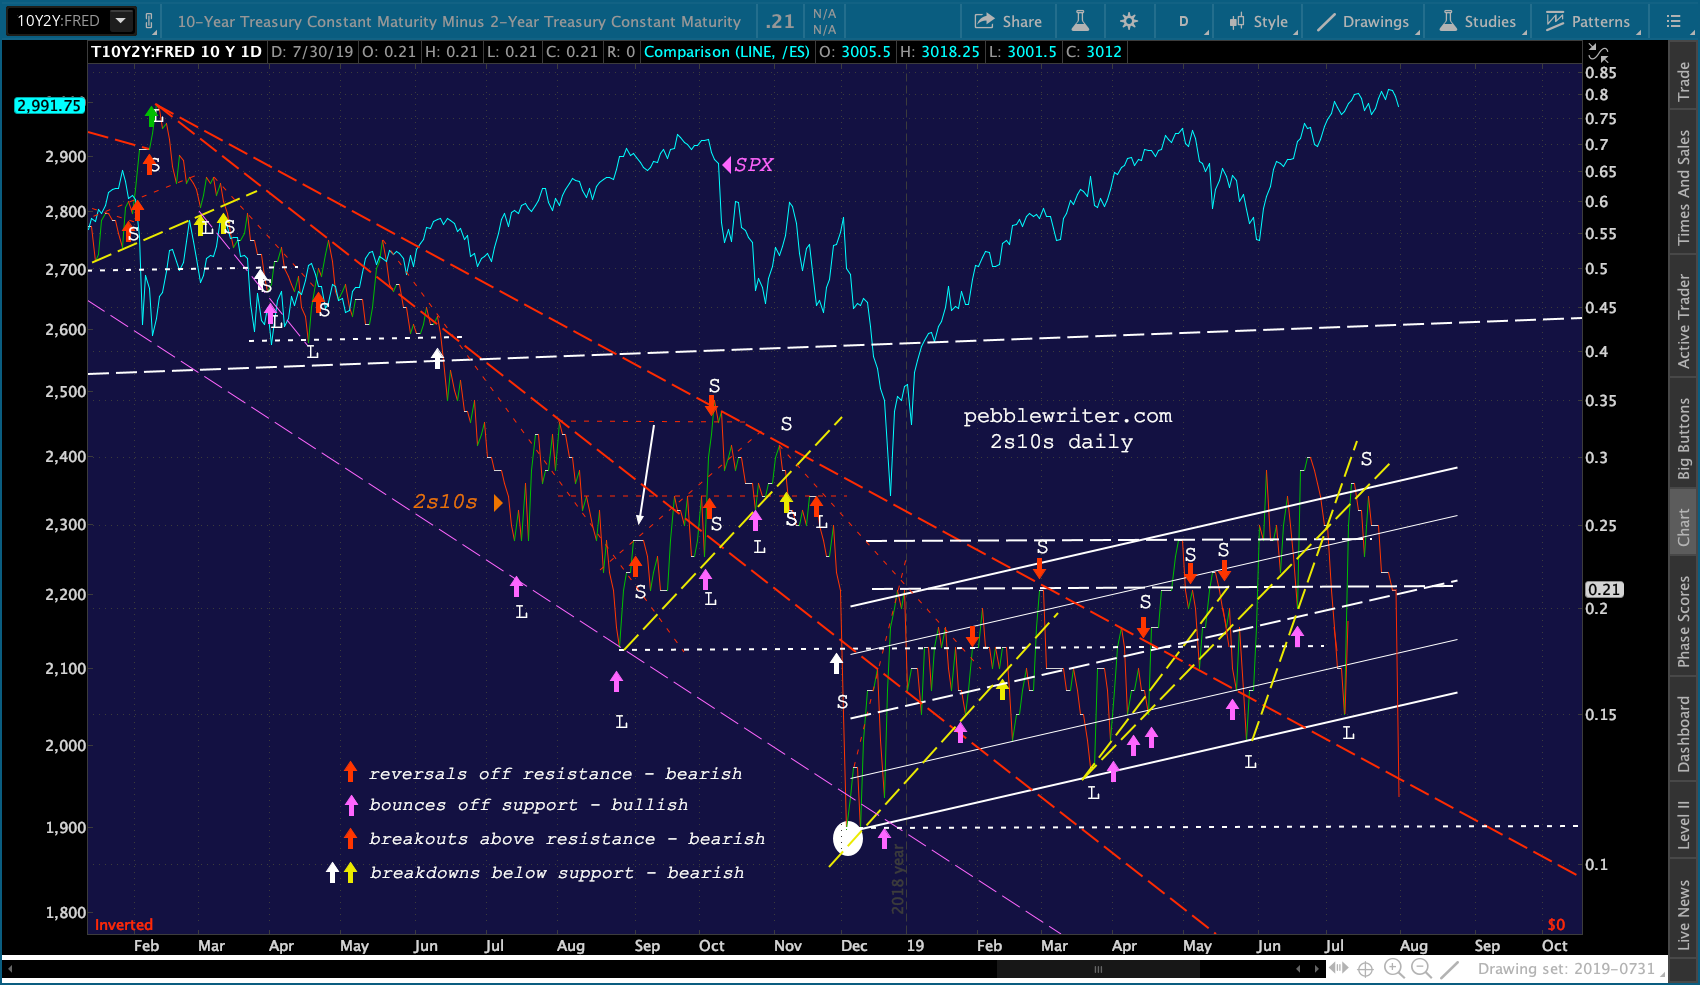
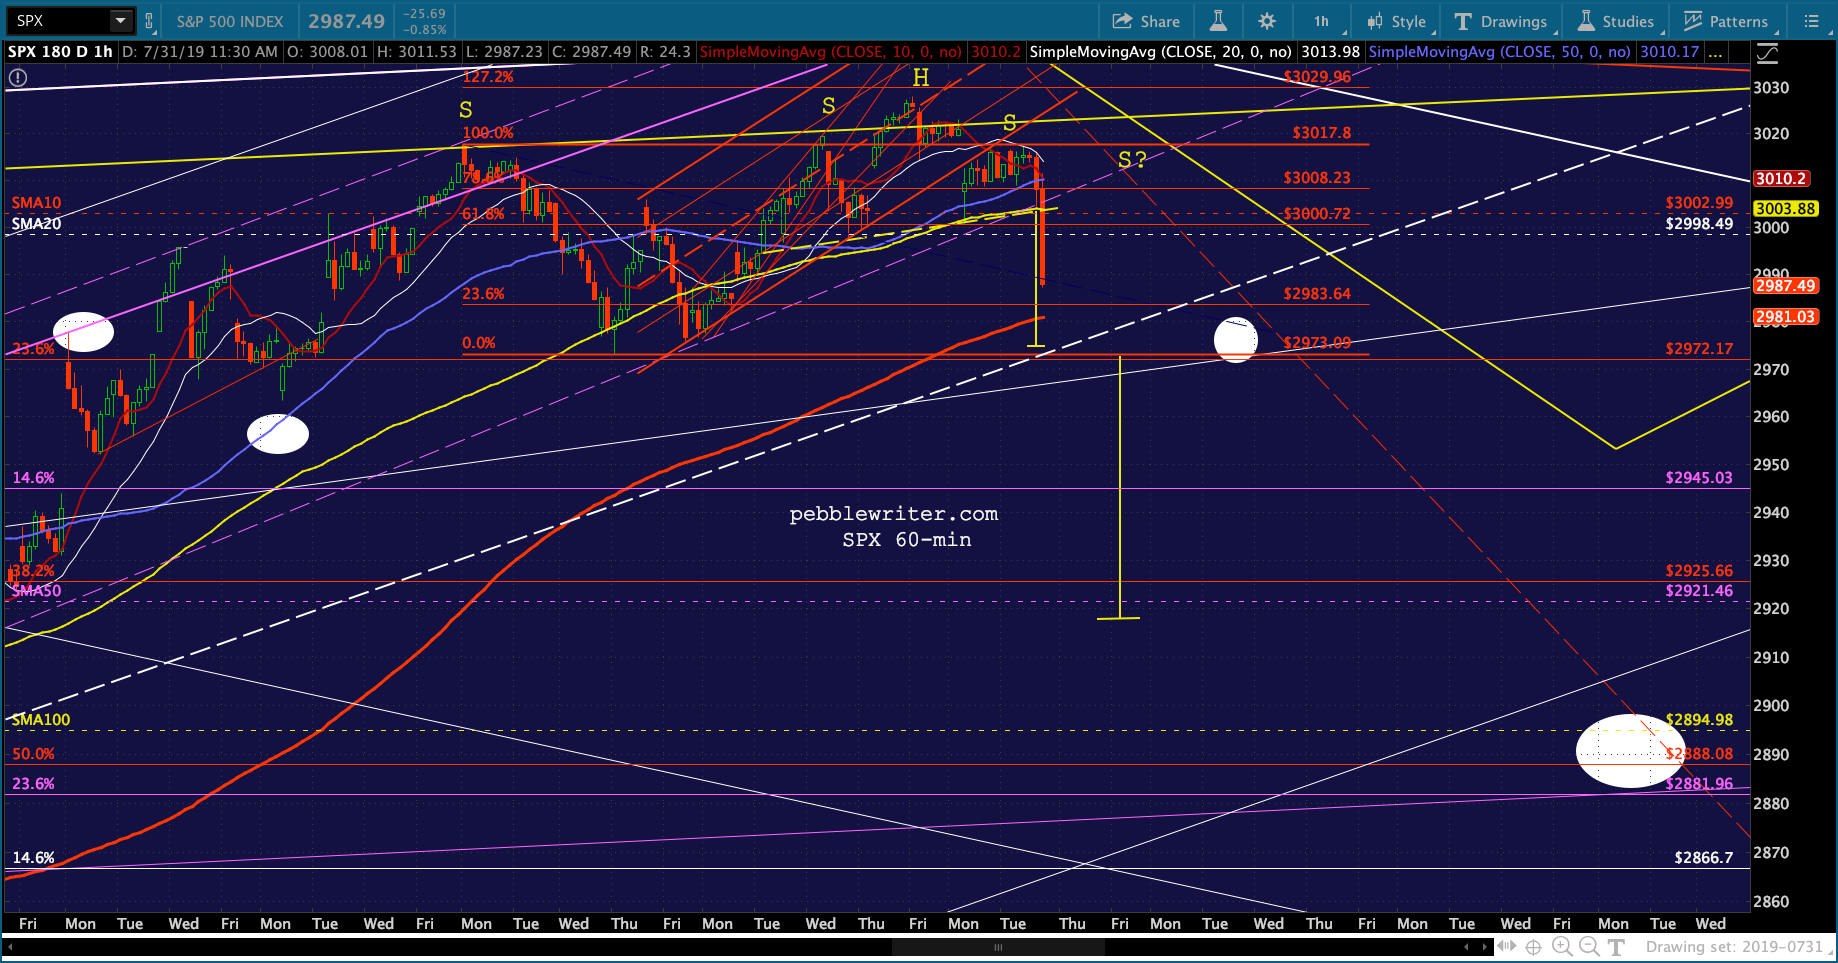 The 2s10s spread has dropped very close to the December lows. This represents a breakdown below the white flag pattern, the red, dashed TL and is nearing a breakdown below the white, dotted TL at 0.11.