

In our last update [see: June 17 Update on Gold] we looked at GC’s latest assault on the horizontal resistance at 1370 — the target we established when resuming a long position in May. It had tested this resistance multiple times since 2016 — and failed. Given that DXY was overextended, this time seemed different.
History says GC will be rebuffed somewhere between today’s highs and 1380.90 and will retreat to around 1224-1241.60. But, as long as GC can remain above 1346.70, it makes sense to remain long with stops back around 1345. Maybe this will be the time it finally breaks out.

In fact, this time was different. GC popped through 1370 with little fanfare and, after some hemming and hawing, tagged our next upside target at 1484 earlier this week.
 This begs the question we’ve been asking for several years, now: what will happen if gold ever completes the gigantic Inverted Head & Shoulders pattern?
continued for members…A reminder of the stakes, with the next upside targets at 1560 and 1588.20.

* * *
In this morning’s equity markets ES is up 18 points… …suggesting SPX might get a chance to close its gap at 2914.11.
 To do so, ES would need to push through its SMA100 at 2905.05 (SPX 2902.15) — not necessarily a tough task. But, it would be another worrisome development for our analog which calls for a cycle low on Aug 14.
Could stocks punch through the resistance and revert to lower lows?
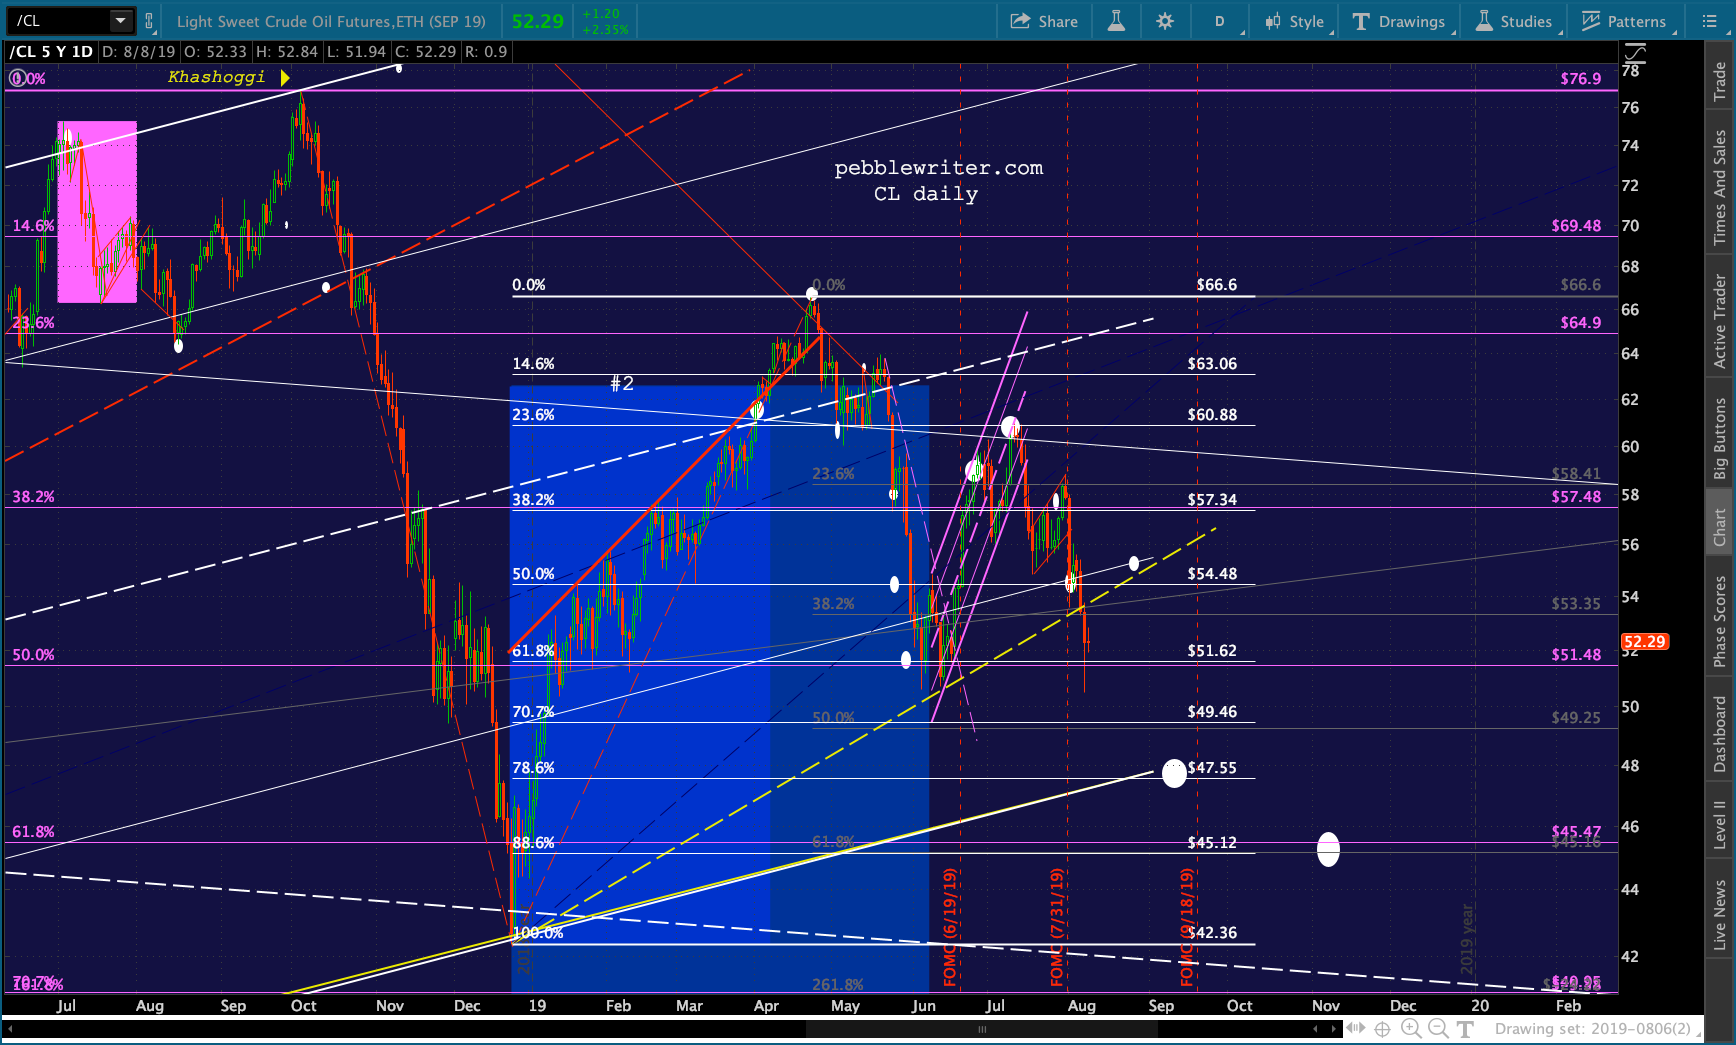
Oil, gas and USDJPY are all bouncing very slightly — not enough to make a major difference but enough to look mildly bullish (if you know nothing about charts.)
 The main proponent of a gap close is VIX, which has fallen 26% from Monday’s highs. A dip back below the SMA200 at 17.18 — also the top of the channel from which it broke out — would probably do the trick.
 A reversal at the white midline it’s currently testing, on the other hand, would permit an easier push up to 26.59-28.83 on the 14th. It bears watching. Once VIX gets hammered, it’s hard for it to resume its climb.
My gut tells me the SPY Nov 240 puts will get cheaper. UPDATE: 10:52 AM
SPX just closed its gap, though VIX is still a few ticks off its SMA200. Keep an eye on VIX, as the next few minutes should be interesting.
 Better…
 UPDATE: 3:50 PM
A pretty impressive bounce which just reached ES’ SMA10 and .618 and the .618 SPX would register if it were to leg down to the .786 at 2792.83. Hard to take it seriously given the low volume and VIX not breaking down. But, of course, it means overnight risk…


 The most compelling case for more downside remains our yield curve model. The 2s10s has fallen below TL support and horizontal support.
 The last time this happened was on Dec 3. SPX closed at 2790. Three weeks later, it bottomed at 2346 — 15.9% lower.