

In our last update on the Dow [see: Dec 11 Update] I mentioned that it was coming up on important support.
if DJIA should happen to plunge below its purple .886 at 23755, I’d sure want to be short.
As it turned out, we had less than a week to wait. DJIA dropped through 23755 on Dec 17, and didn’t stop until it reached 21712 on the 26th — a drop of 8.6%. Since then, it has recovered all of those losses and more. Is the coast clear?
Maybe. But, it’s important to note that like SPX and COMP, it is backtesting a point of potentially strong resistance — the neckline of a large Head & Shoulder Pattern that never completely paid off. As we discussed back in December, if it can’t retake the neckline, things could get pretty ugly.
continued for members…
Note the Fib intersection – the purple 2.24 and the white 1.618 — at the bottom of the white channel.
 But, it’s not just any channel bottom. It also represents a backtest of the rising red channel DJI broke out of in 2016.
If it occurred around May 9, it would come a week after a Fed meeting as well as a year after EIA’s monthly gas price topped out — meaning May 2019 could well be the low of the coming CPI swoon.
As we discussed the other day, a bout of very low inflation accompanied the last major correction in 2015-2016 when YoY changes in gas prices turned sharply negative. I have a hunch the Fed is going to make the very same mistake all over again, but we’ll see.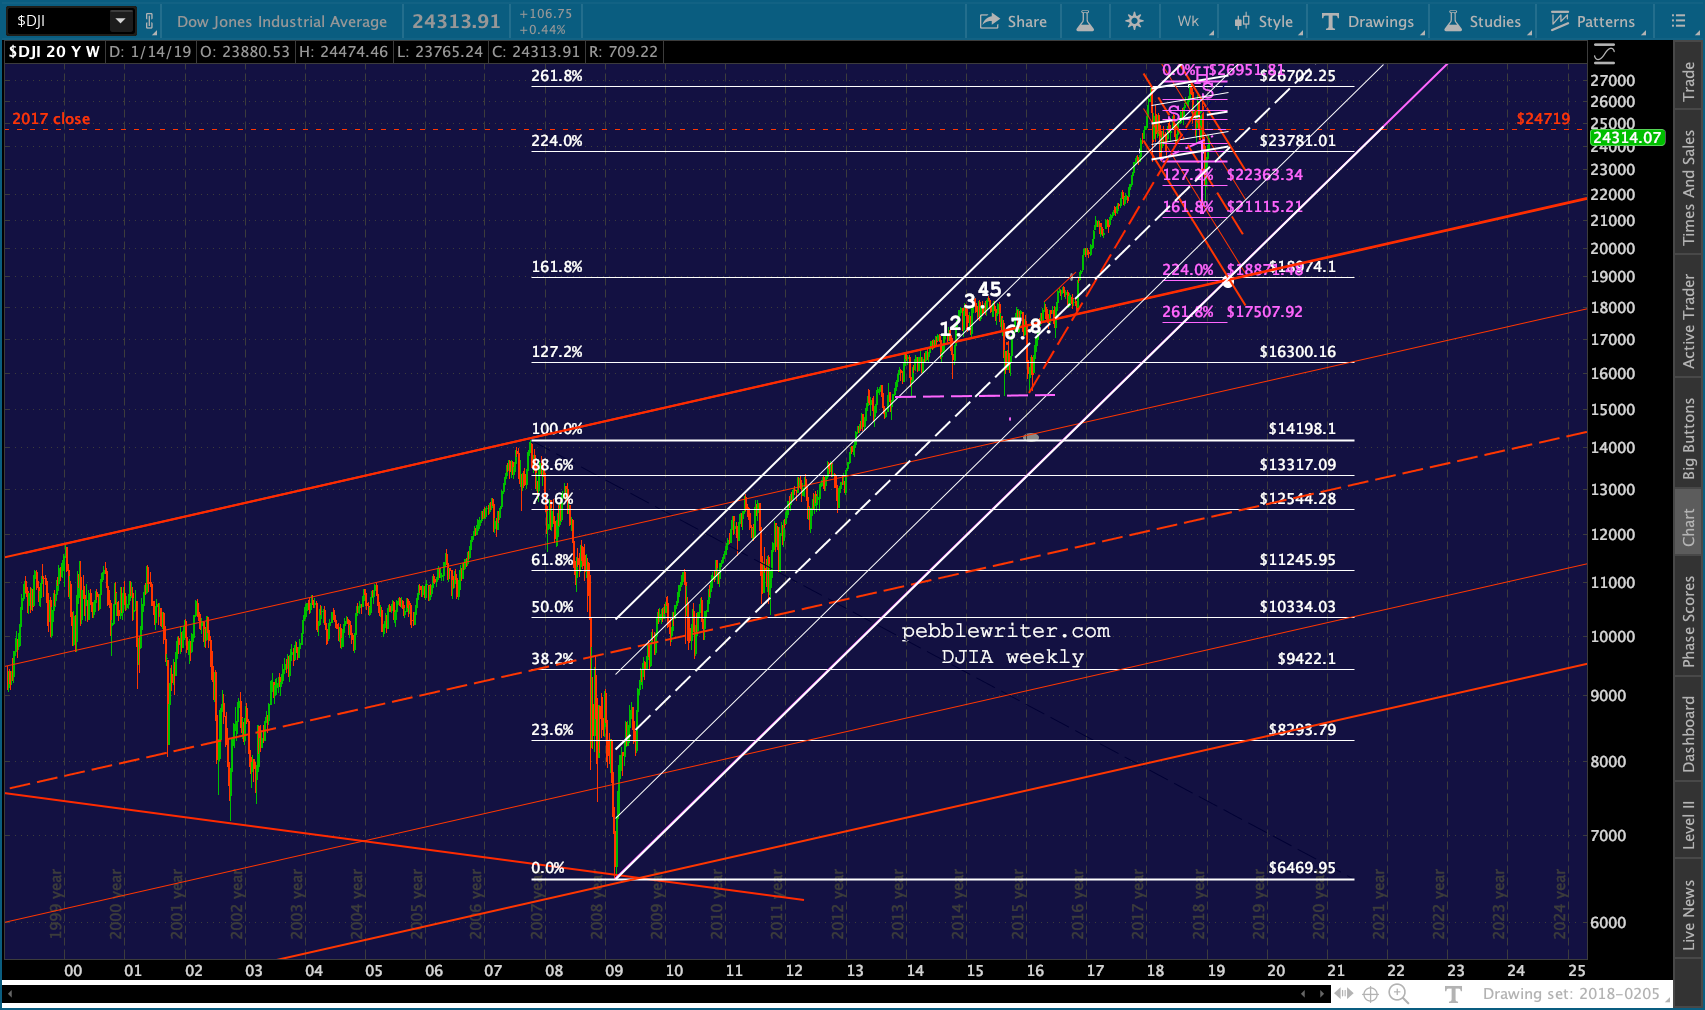 Clearly, this is a critical moment for DJIA. Is it a coincidence that the WSJ just printed a rumor that the China trade tariffs might be lifted?
Of course not.