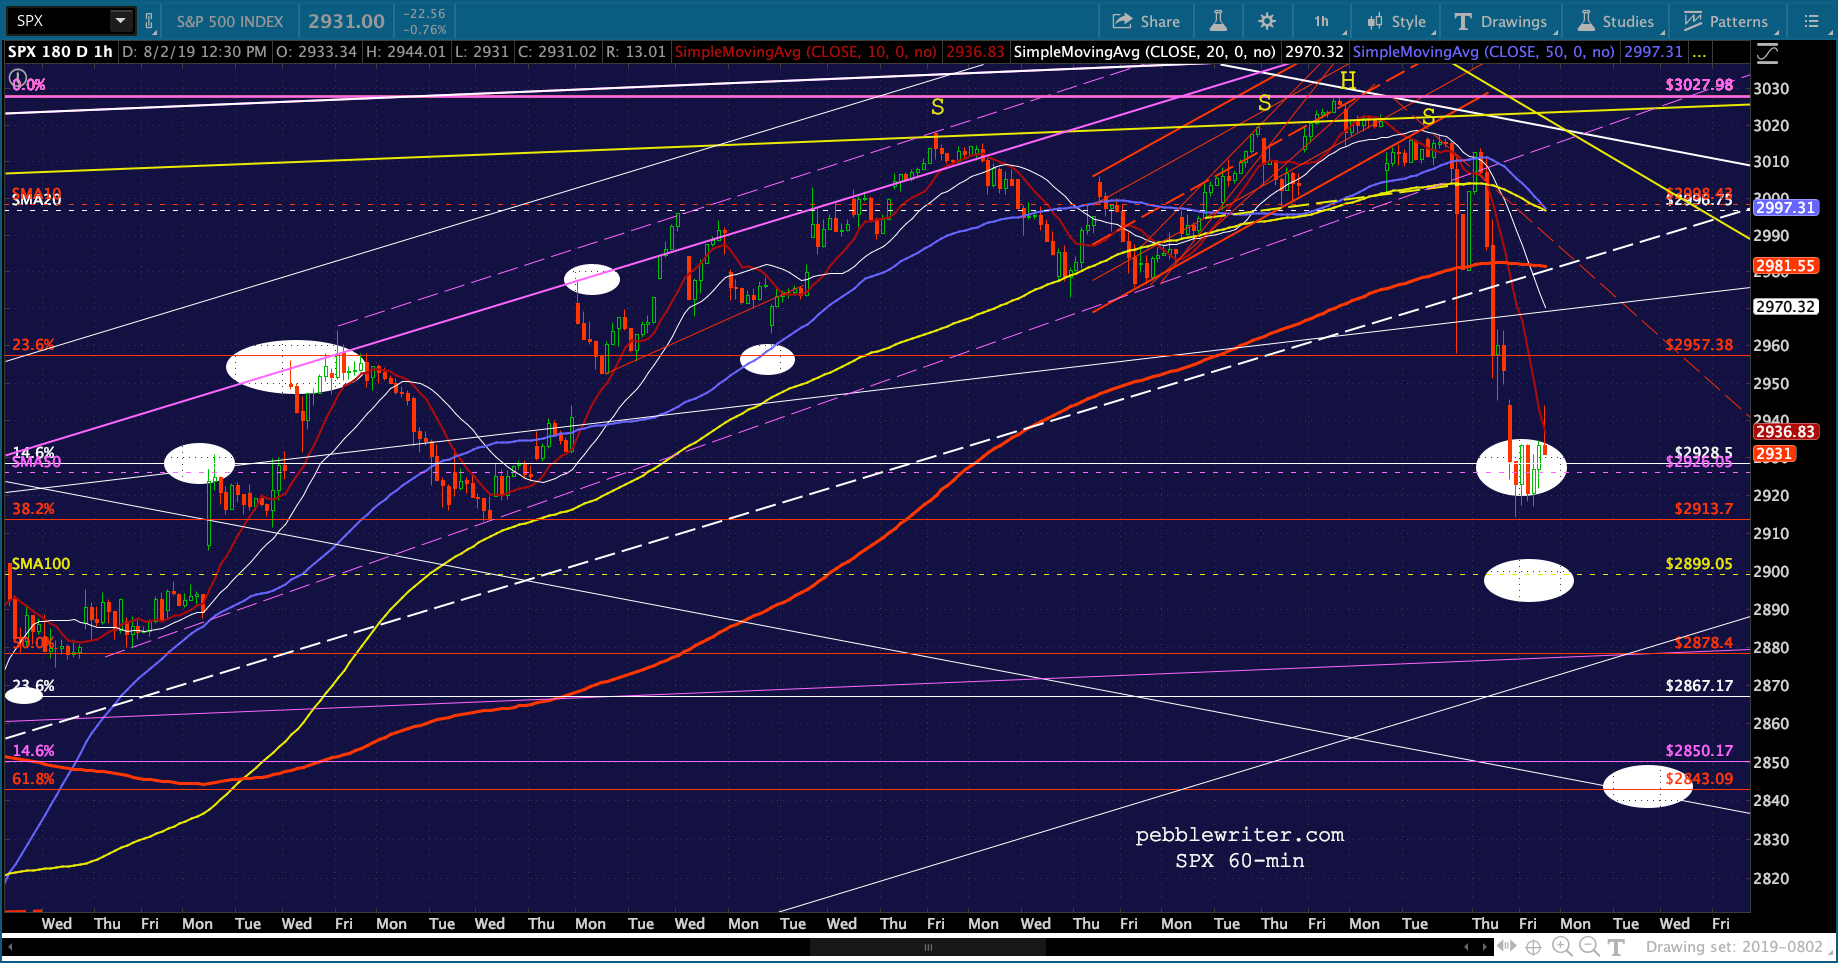
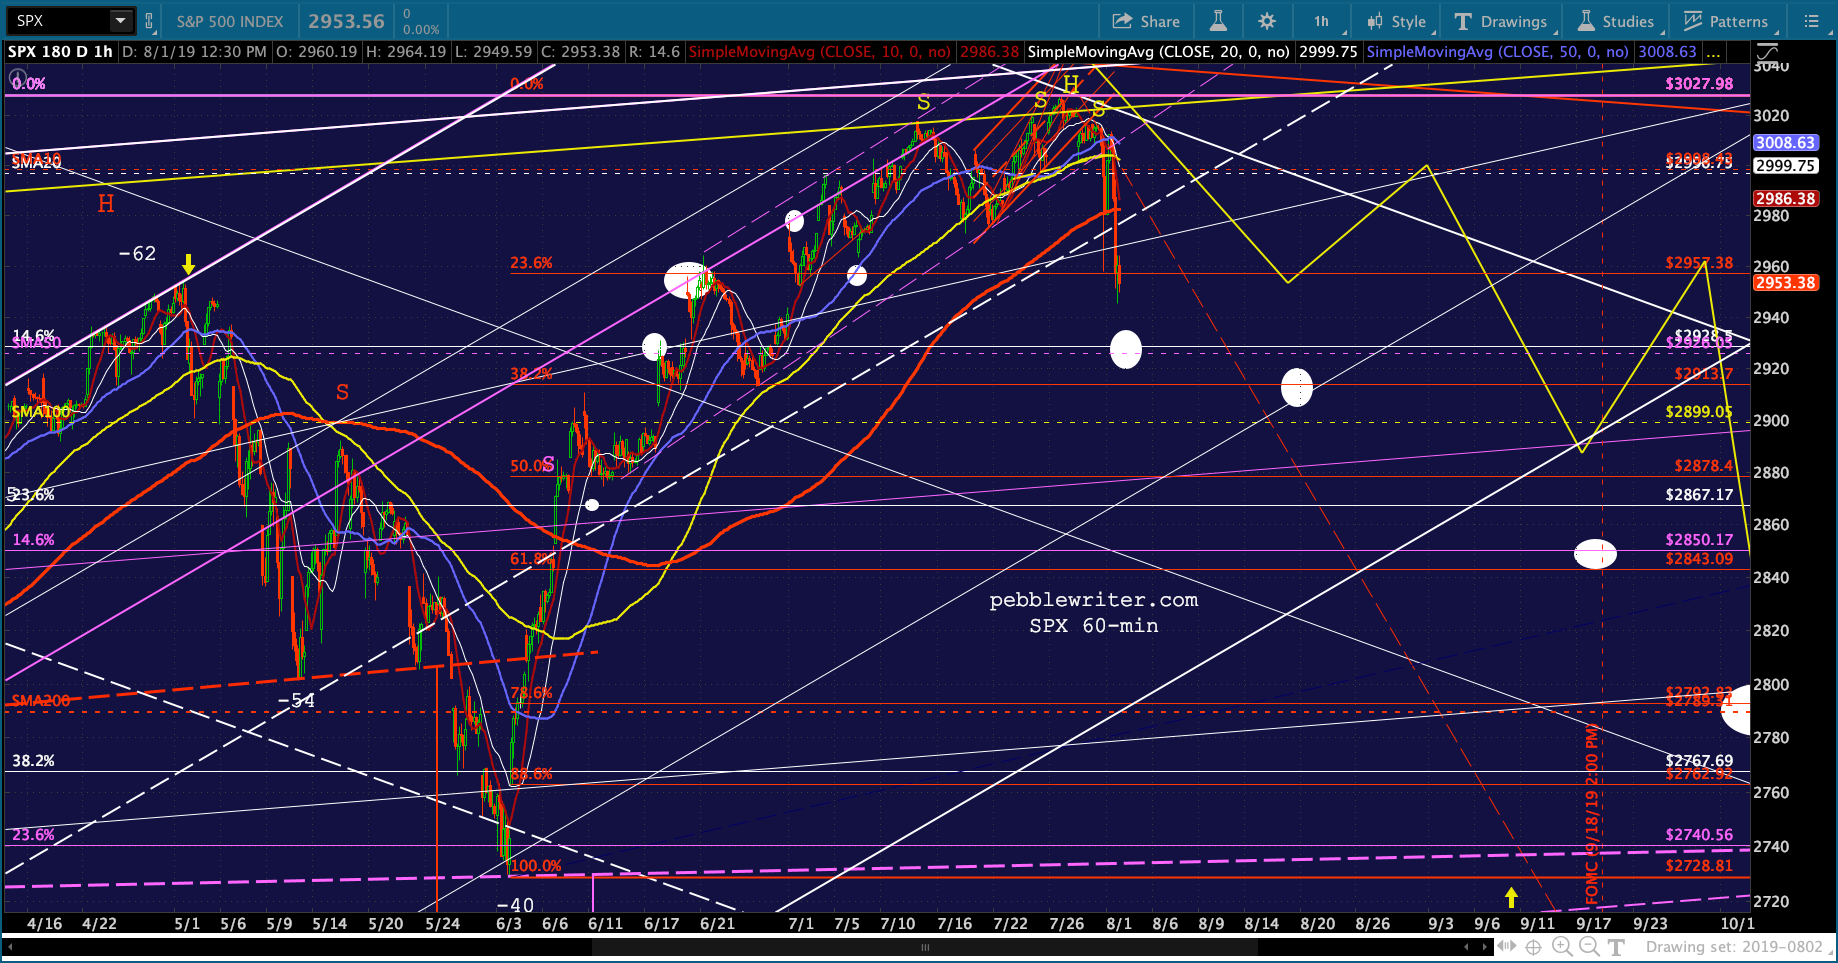
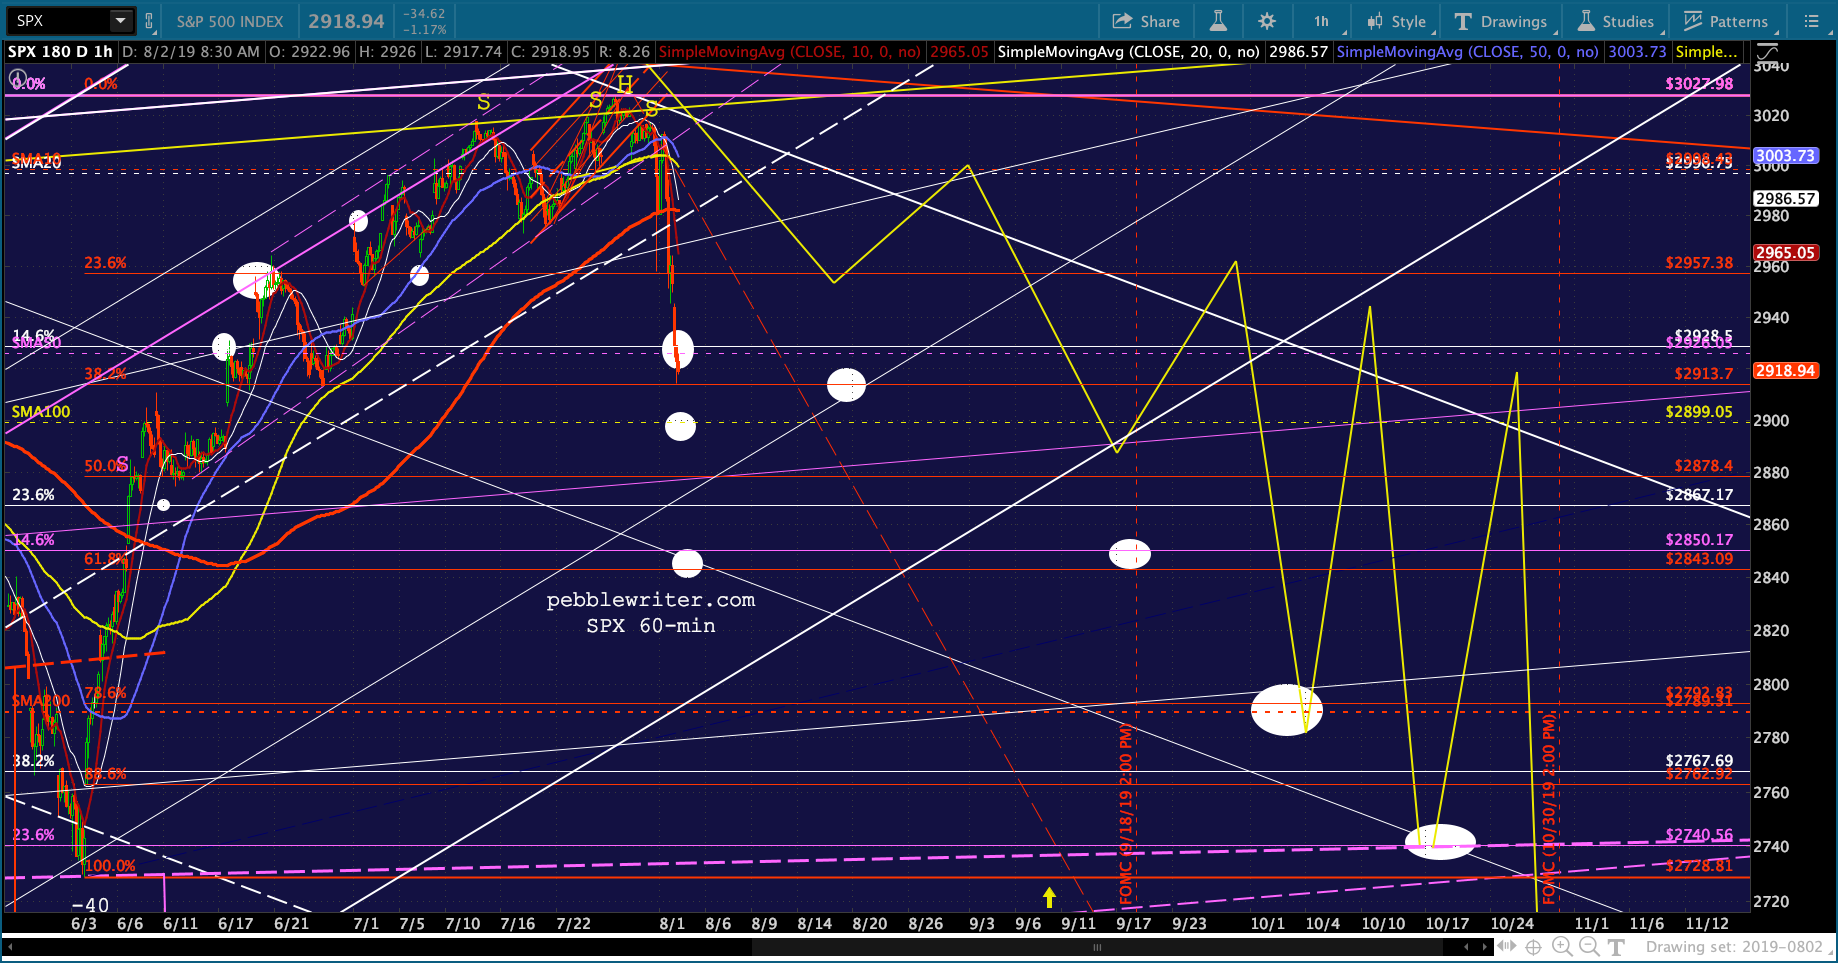
Futures have been all over the map since yesterday’s close. SPX bounced slightly below the initial downside target from our analog first mapped out on July 15 and confirmed on July 30 [see: Ringing the Bell] — but, well ahead of schedule thanks to Trump’s latest China trade salvo.
The 3% drop from the top is nice. But, the great thing about analogs is that they offer a predictable path through the otherwise indecipherable and often illogical twists and turns. Since the top came early, it’s possible that everything else will come early.
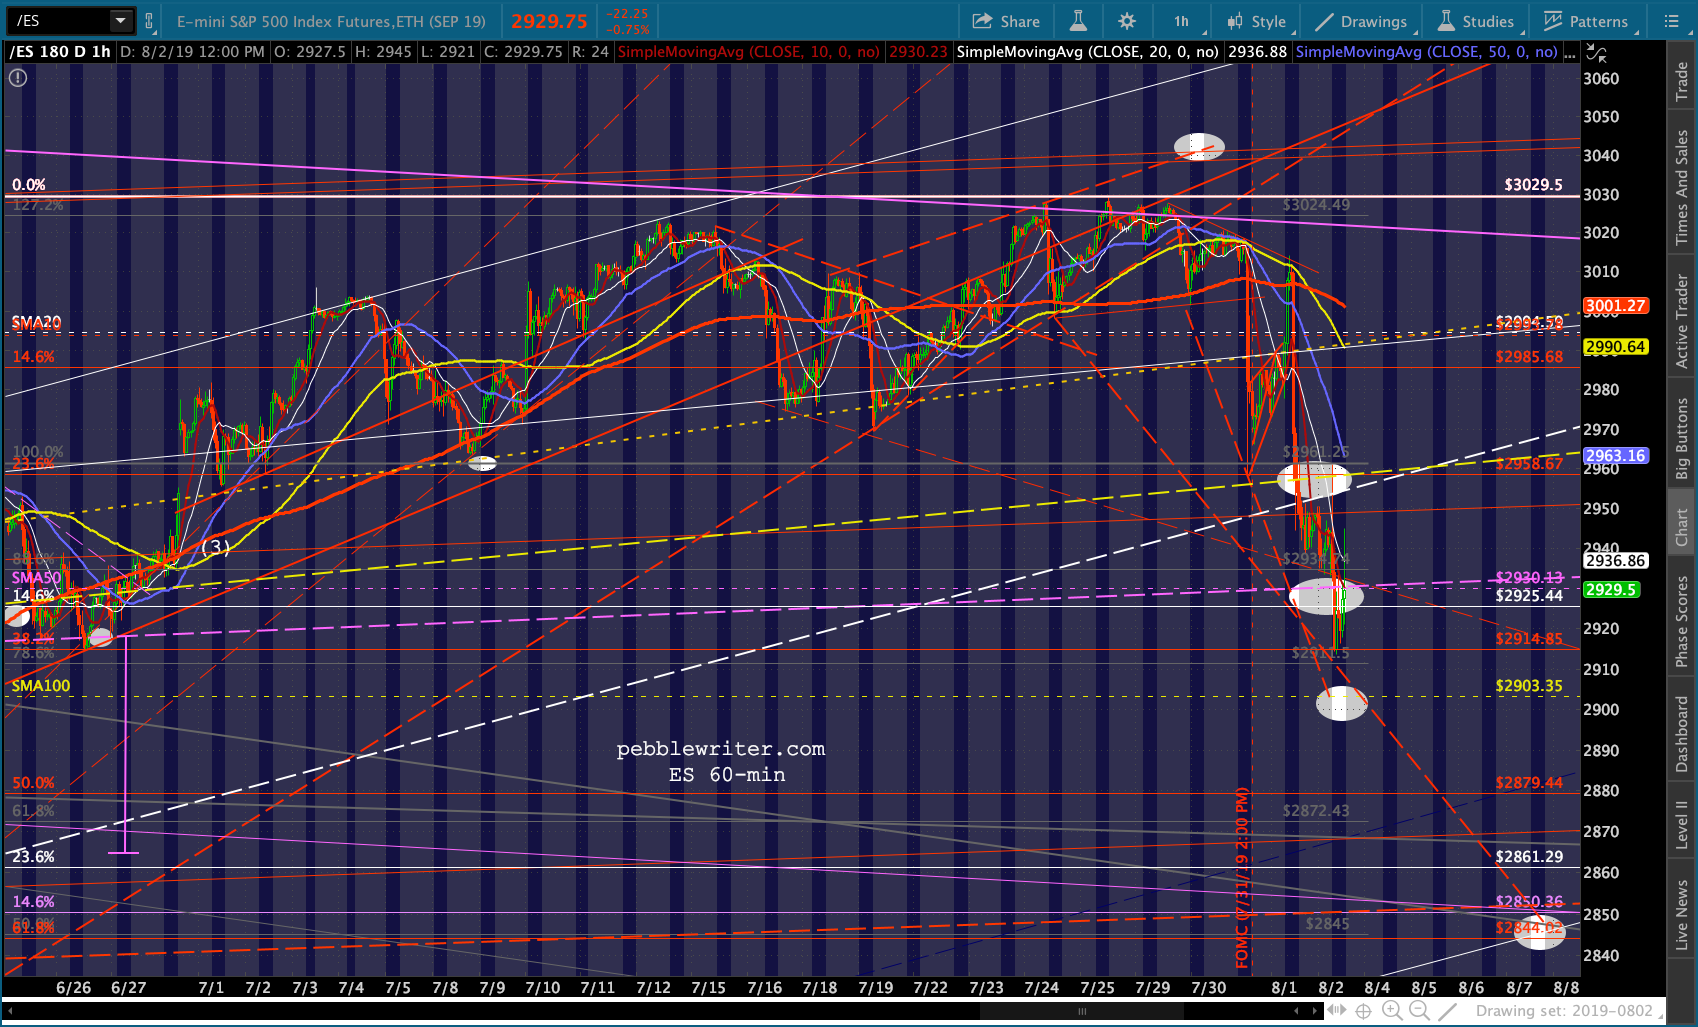
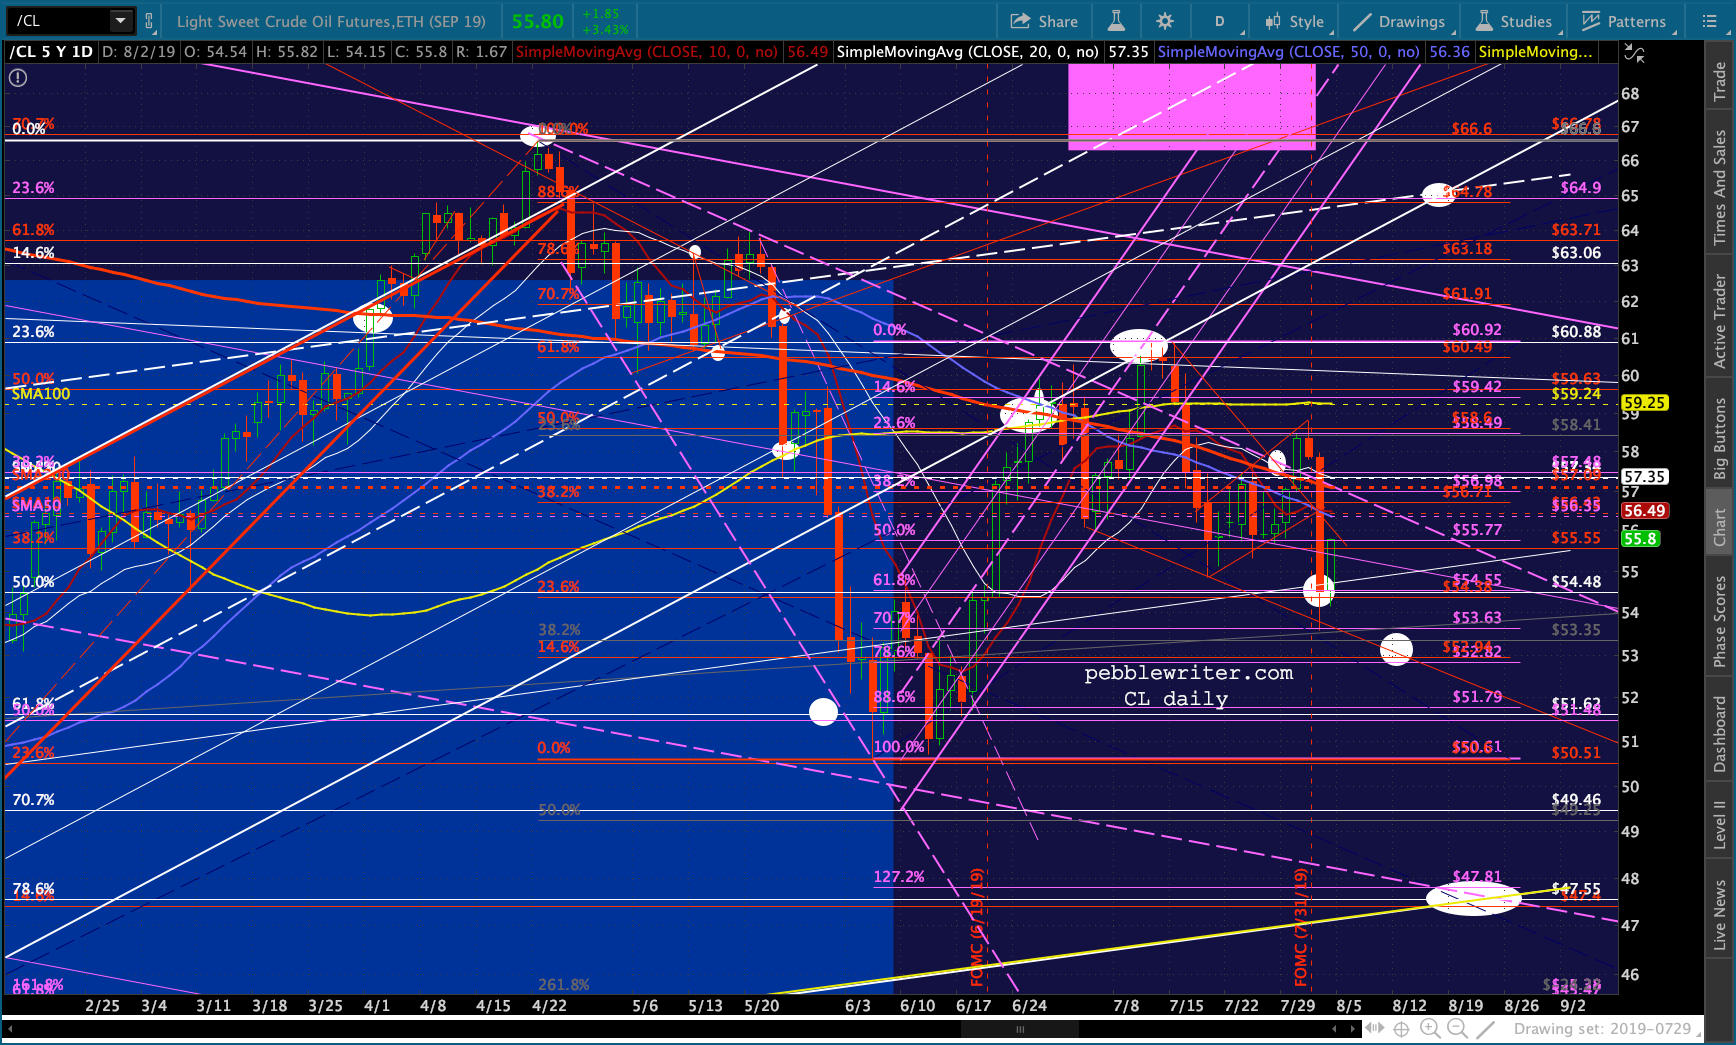
I’ll be working on adjusting the timeline today. In the meantime, CL and RB bounced where expected, VIX reversed where expected, SPX and ES should test their SMA50s today and the 10Y is making a beeline for our downside targets.
 For those watching them, BA just nailed our red target from a couple of weeks ago…
  …and, AMZN is well on its way.
 Should be another very interesting day.
continued for members…
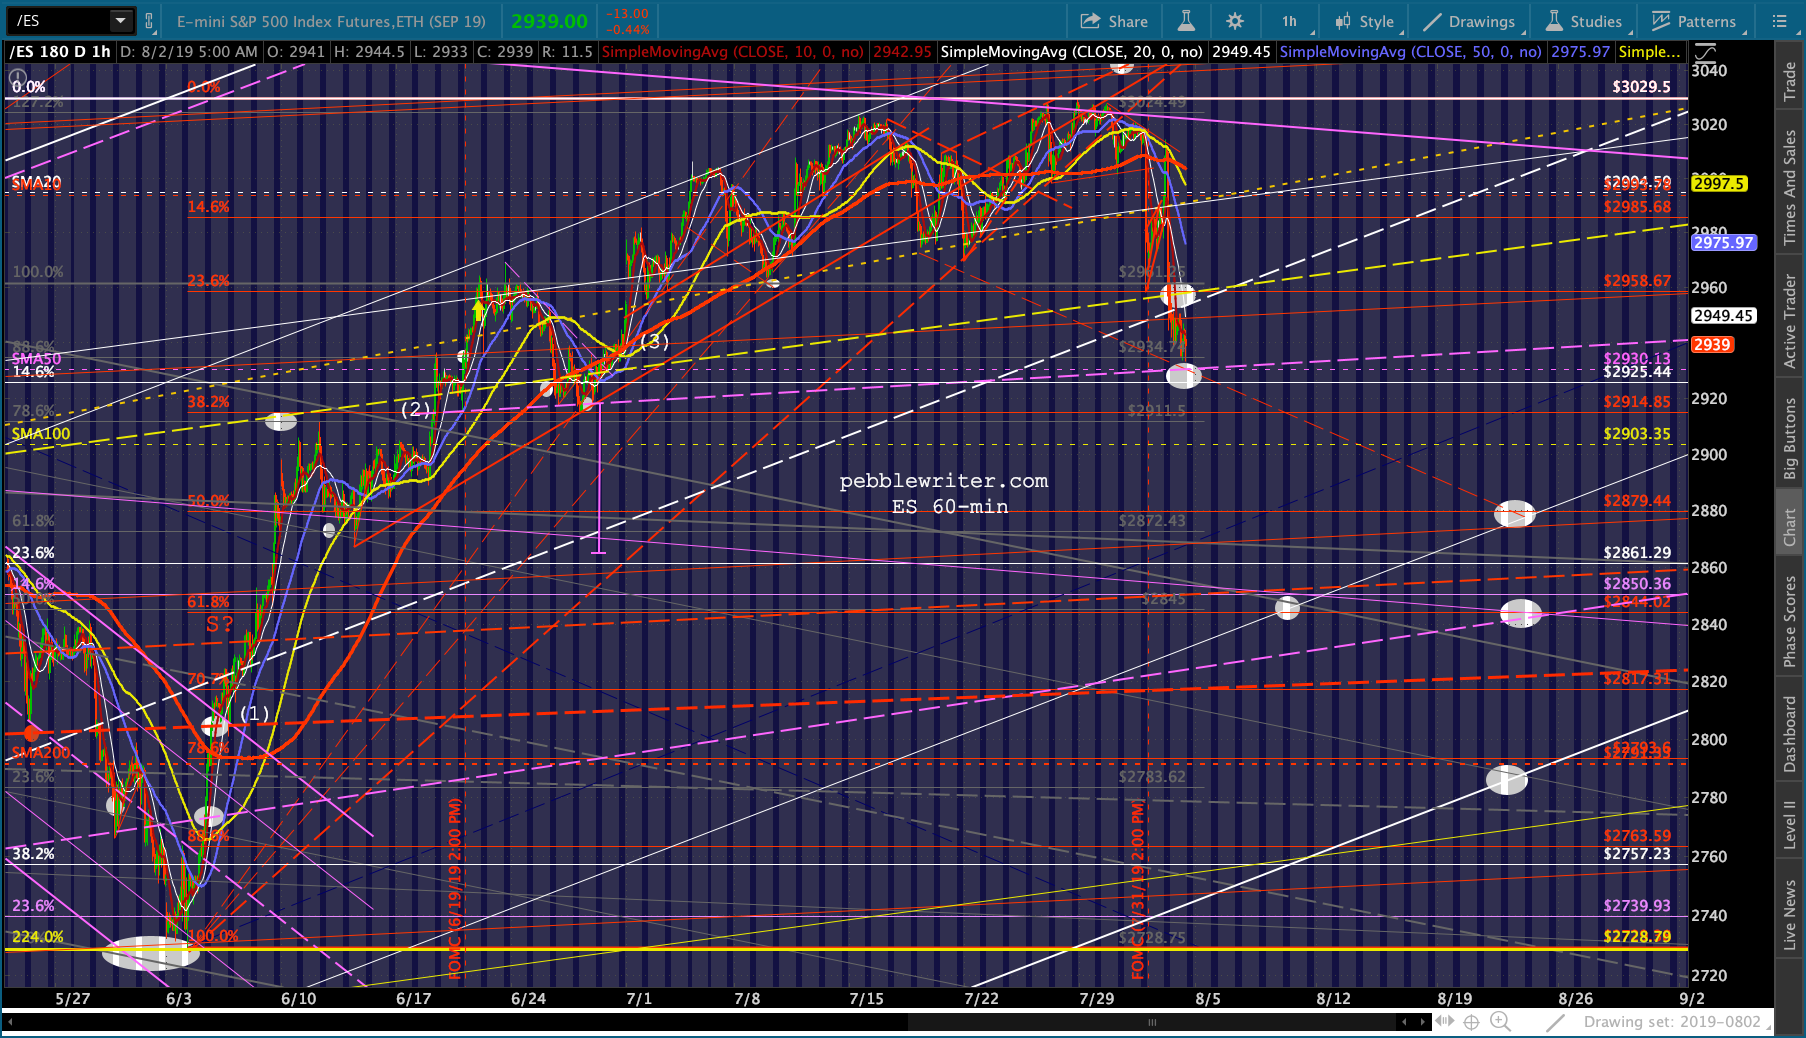
Futures — all over the map this morning. ES nearly tagged the SMA50 and seems likely to take another swing at it after the open.
 RB and CL bounced right where we thought they would and are up 2.75 and 3.5% respectively — obviously in stocks’ favor.
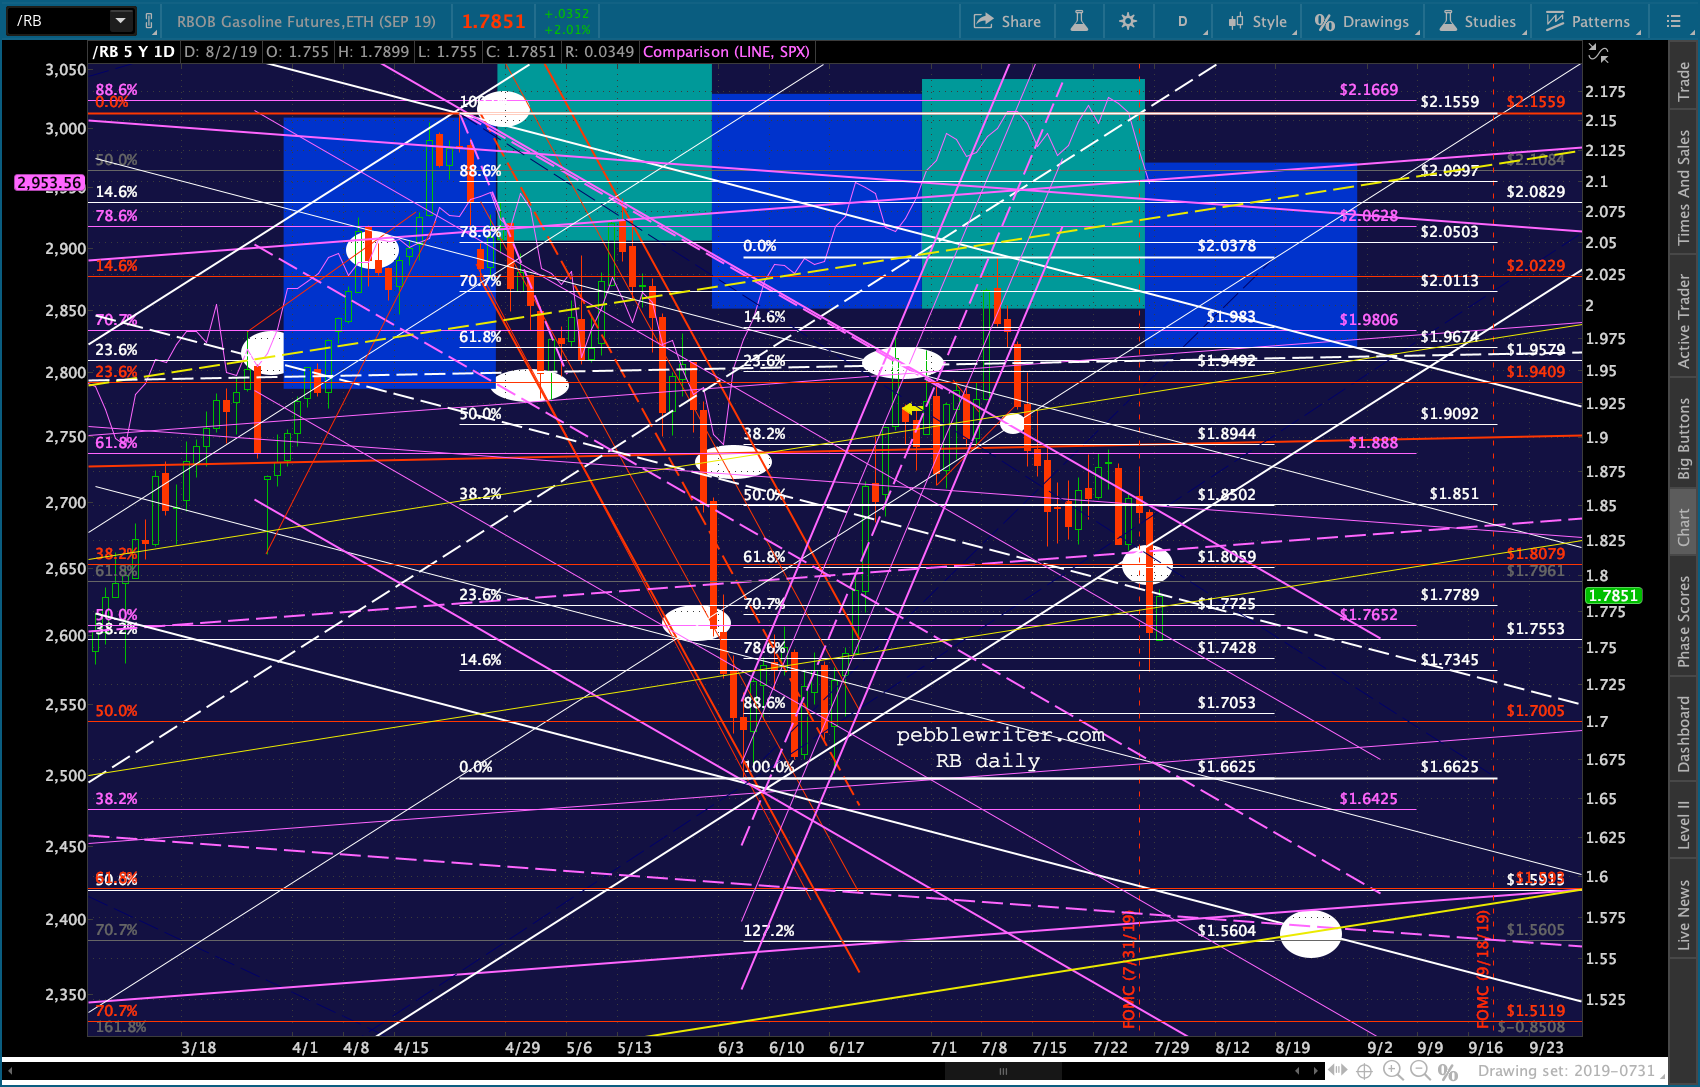
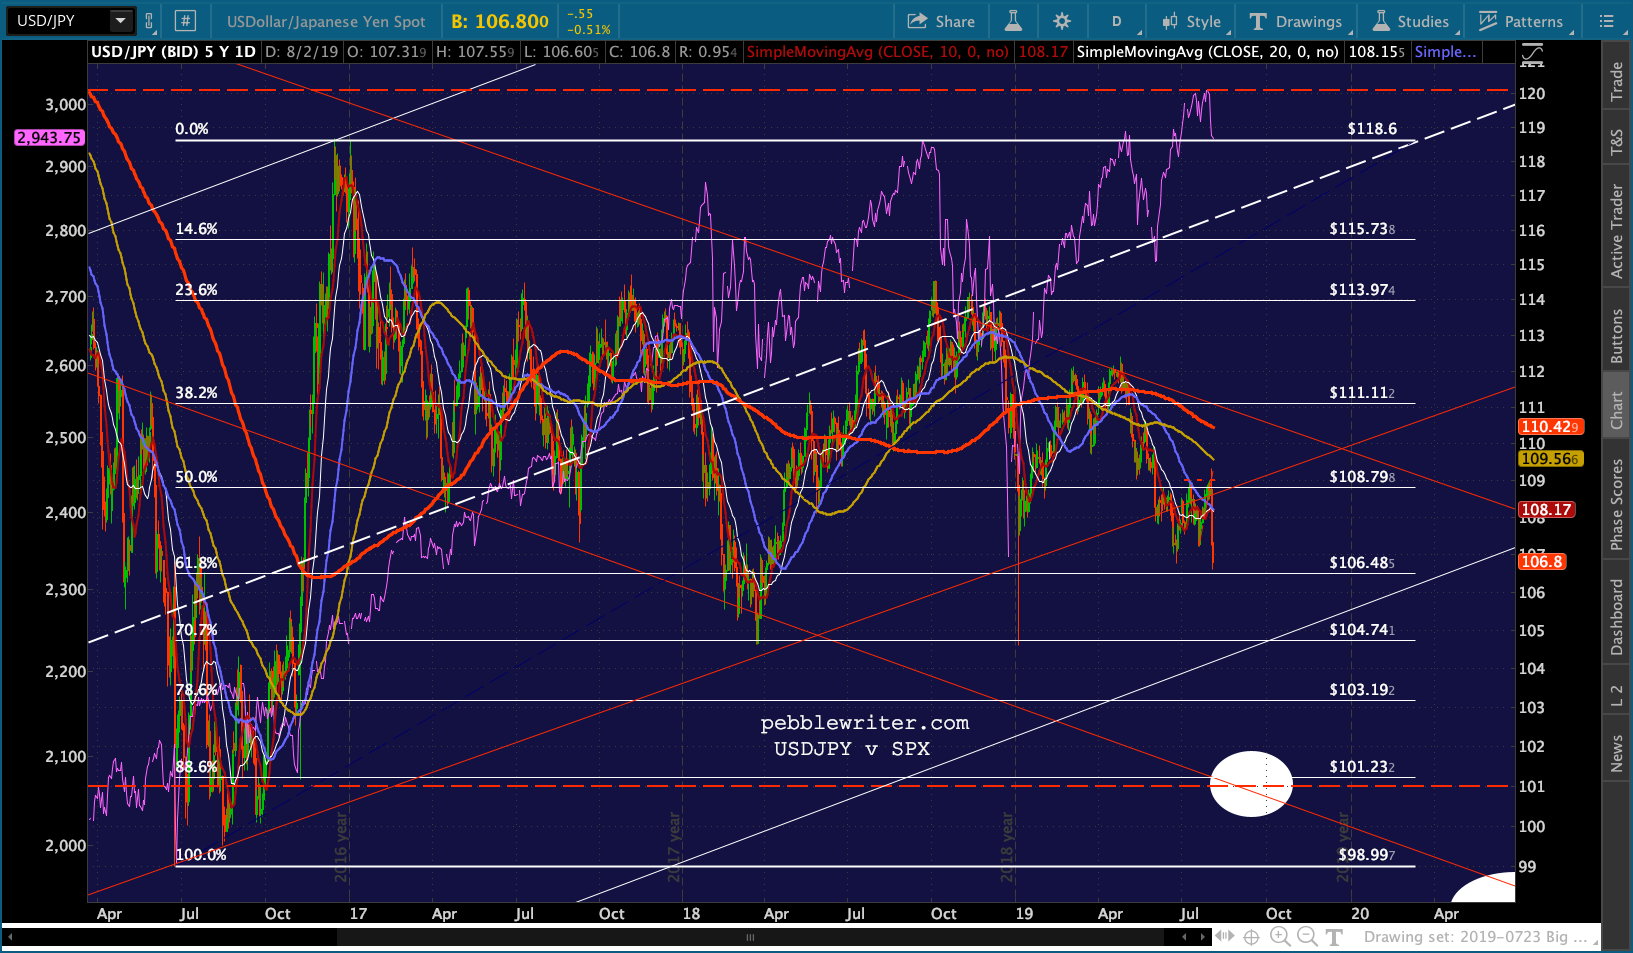
 So far, USDJPY is supportive of a further decline in stocks — not necessarily in concert with oil and gas.
 DXY is backing off its new highs…
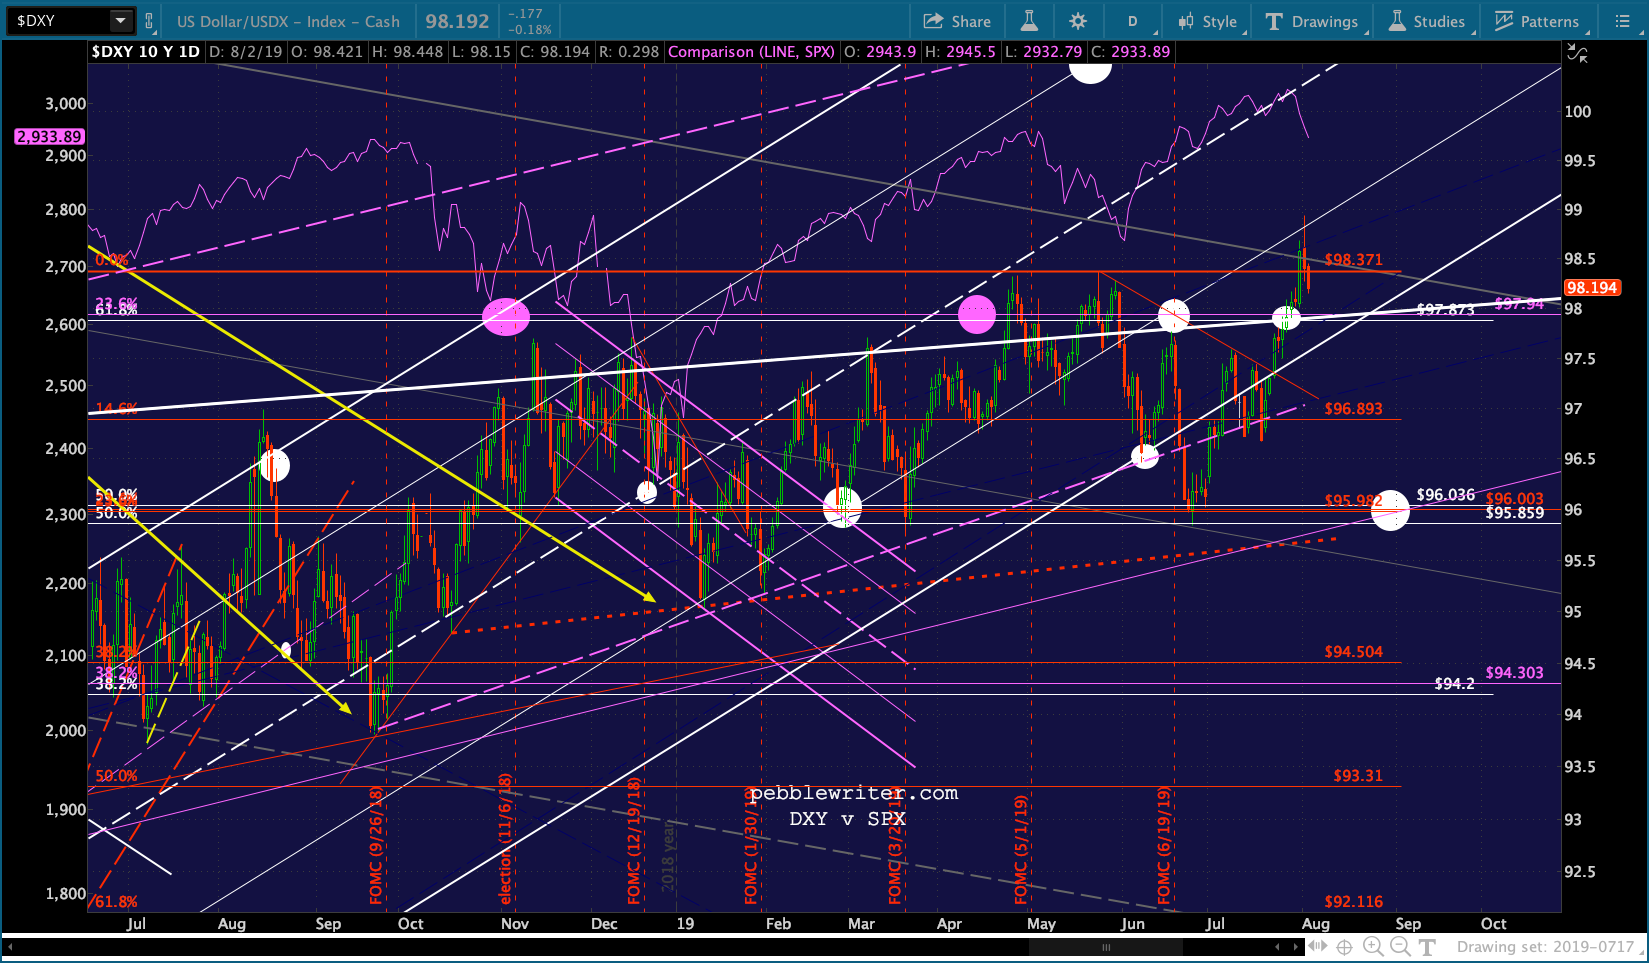 …as EURUSD gets a bounce off the purple channel bottom.
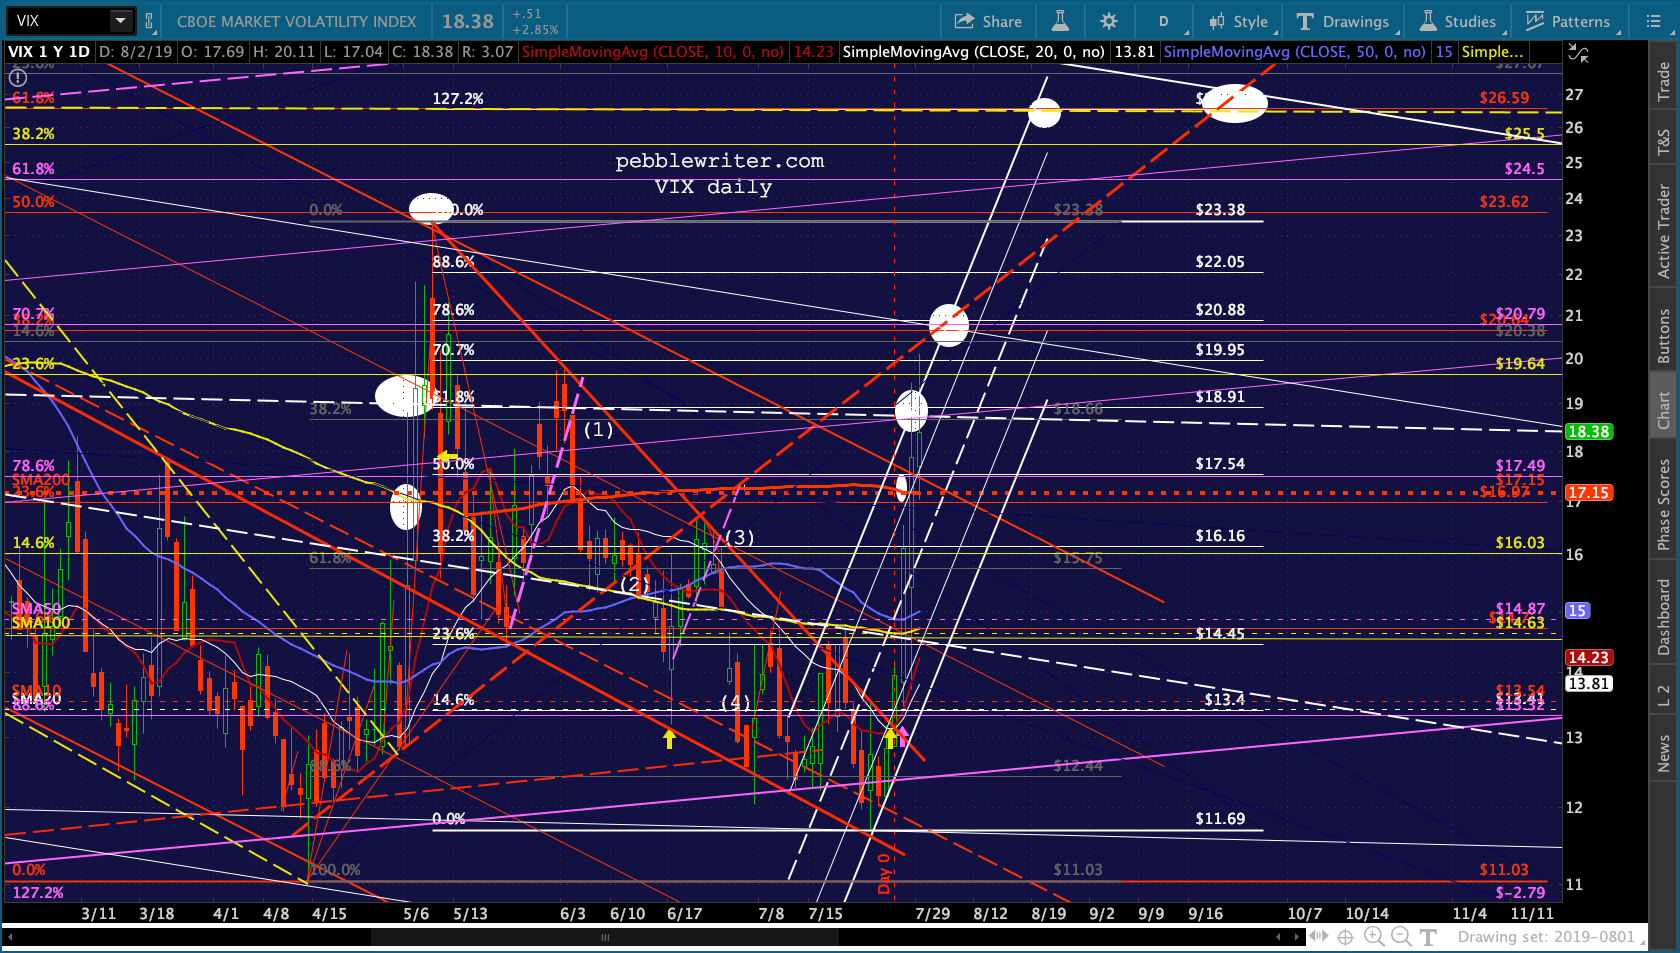
 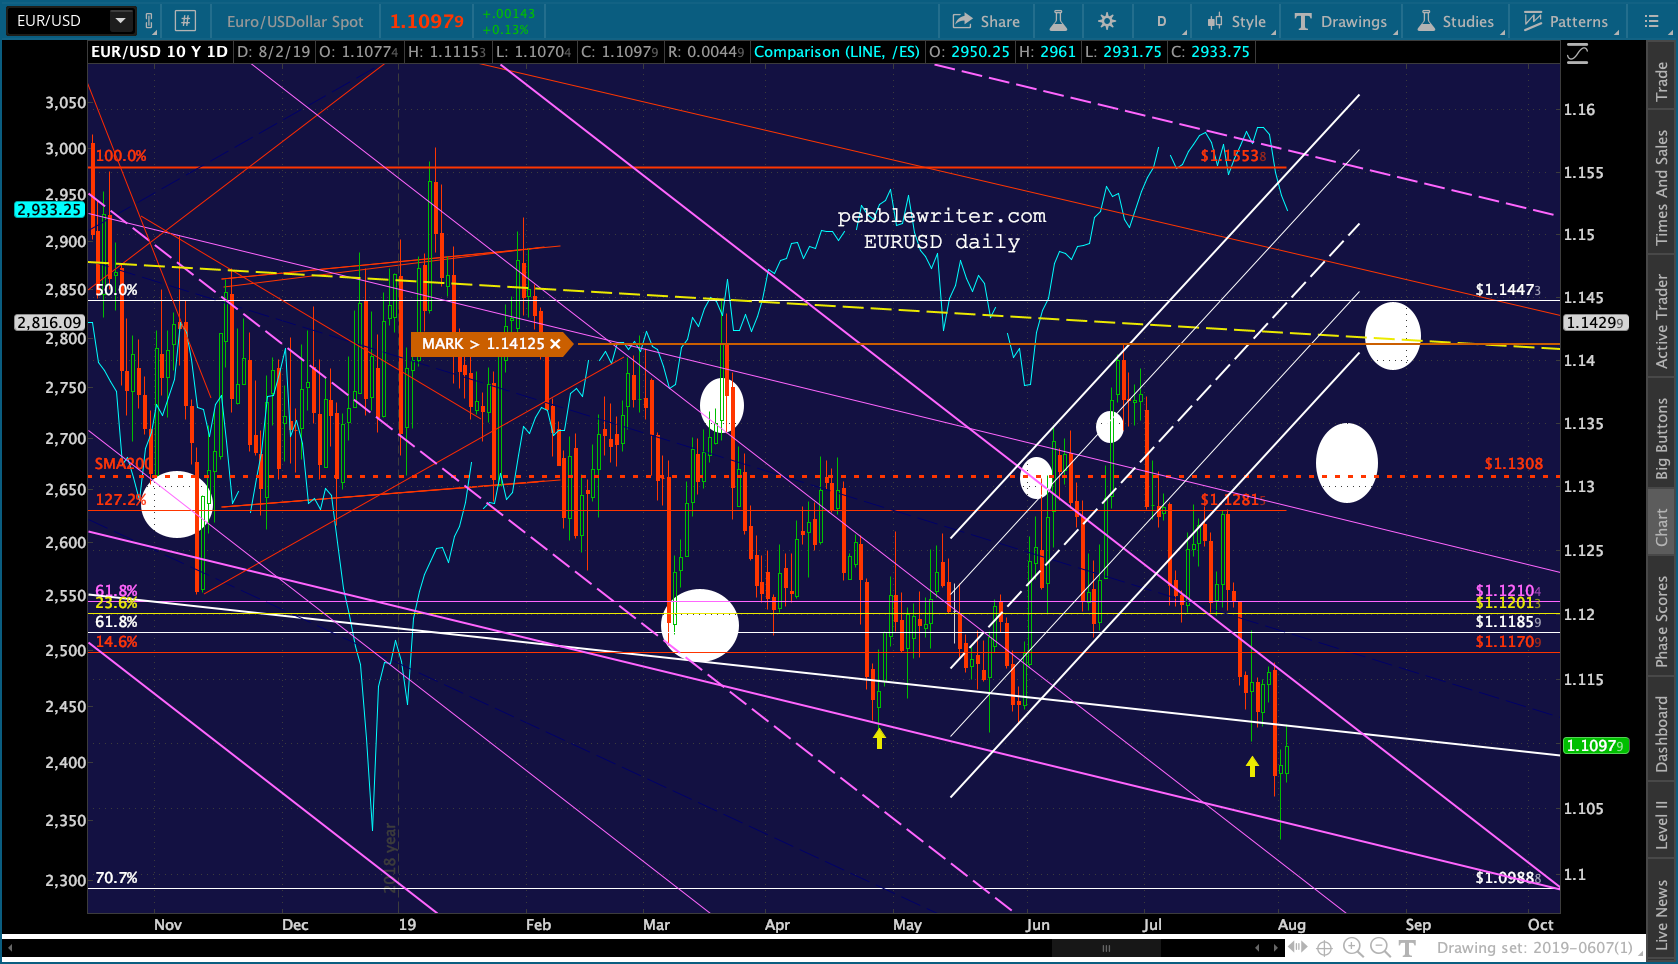 And, VIX is still pulling back from its .618 — at least for now.
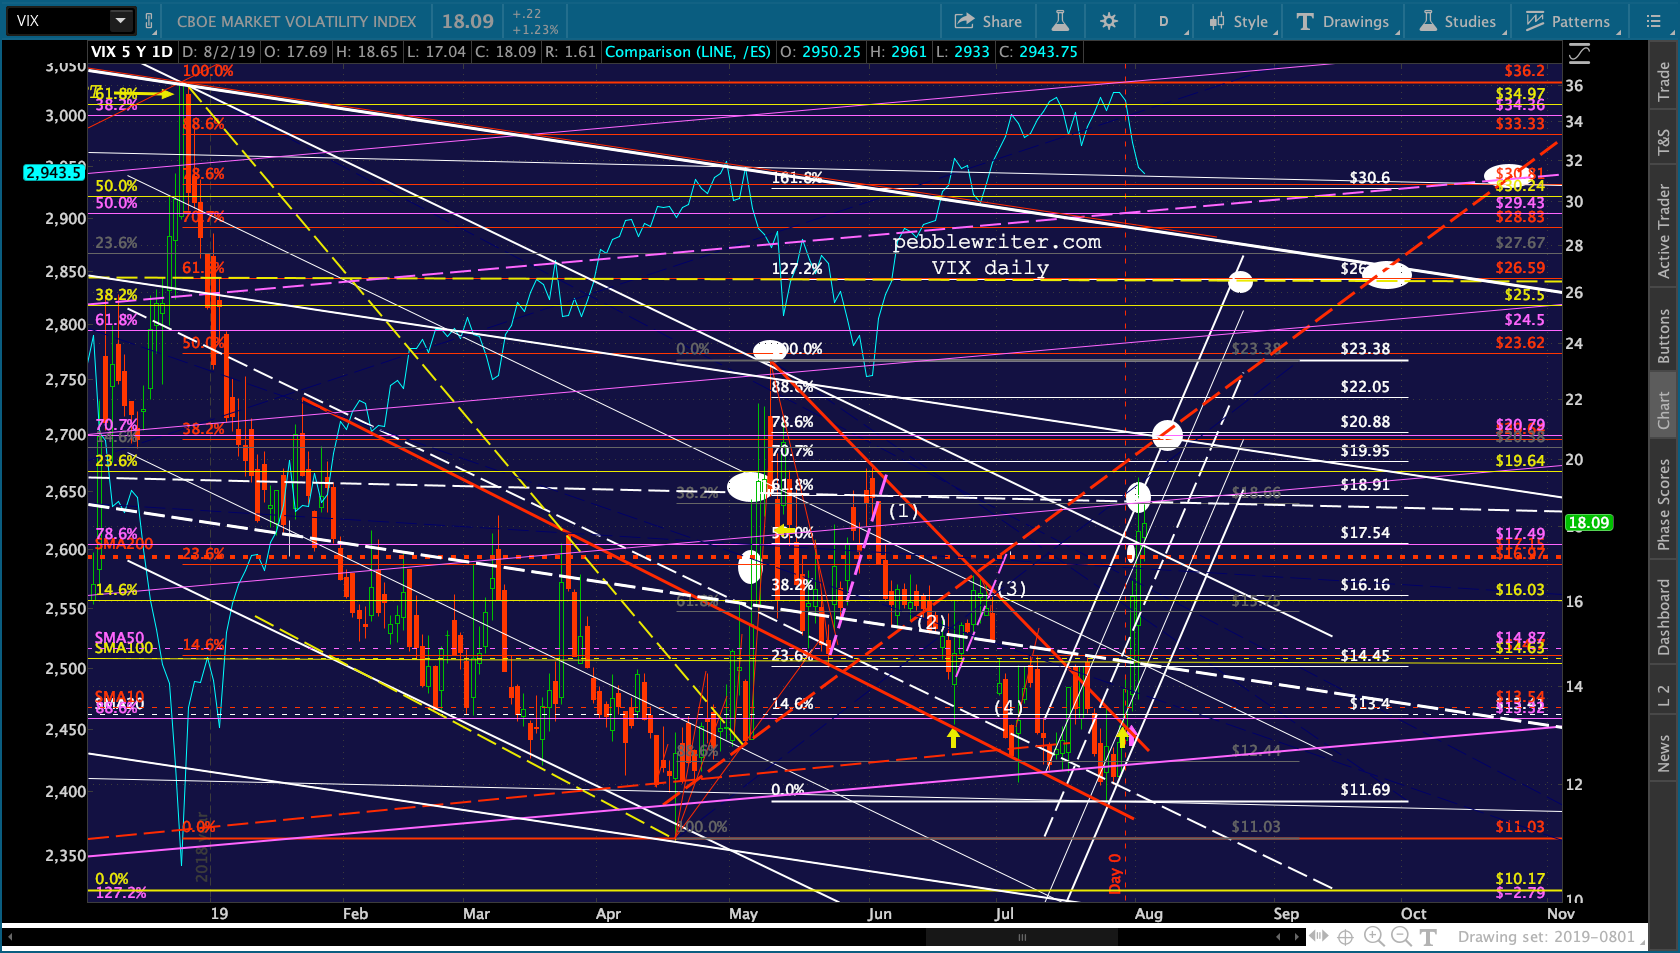 Since VIX has broken out of the smaller falling white channel above, I have changed its color to red to reduce the confusion (should have done this in the first place.) Now, VIX should refocus on the falling white channel shown below. The .786 line is where our 20.88 target sits.
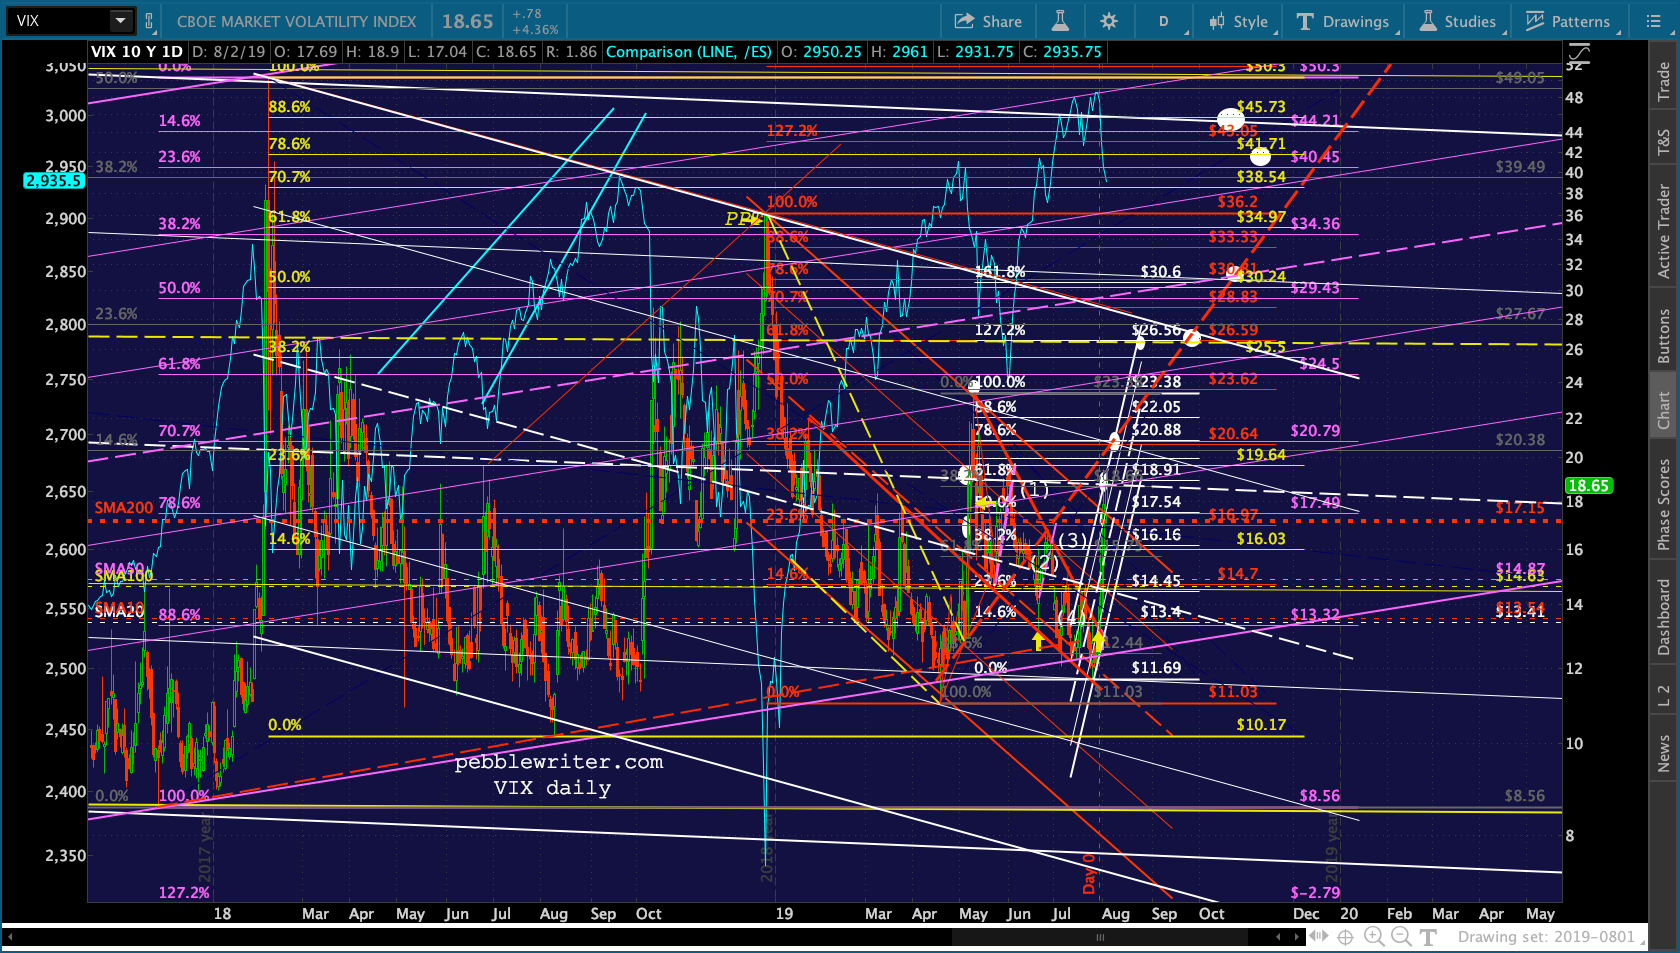
The top is currently around 28.53, but it’s more likely it won’t be tested until mid-September when it is closer to 26.60. Obviously, if VIX spikes out of control as it did in Feb 2018, it would change pretty much everything. This is a real and present danger.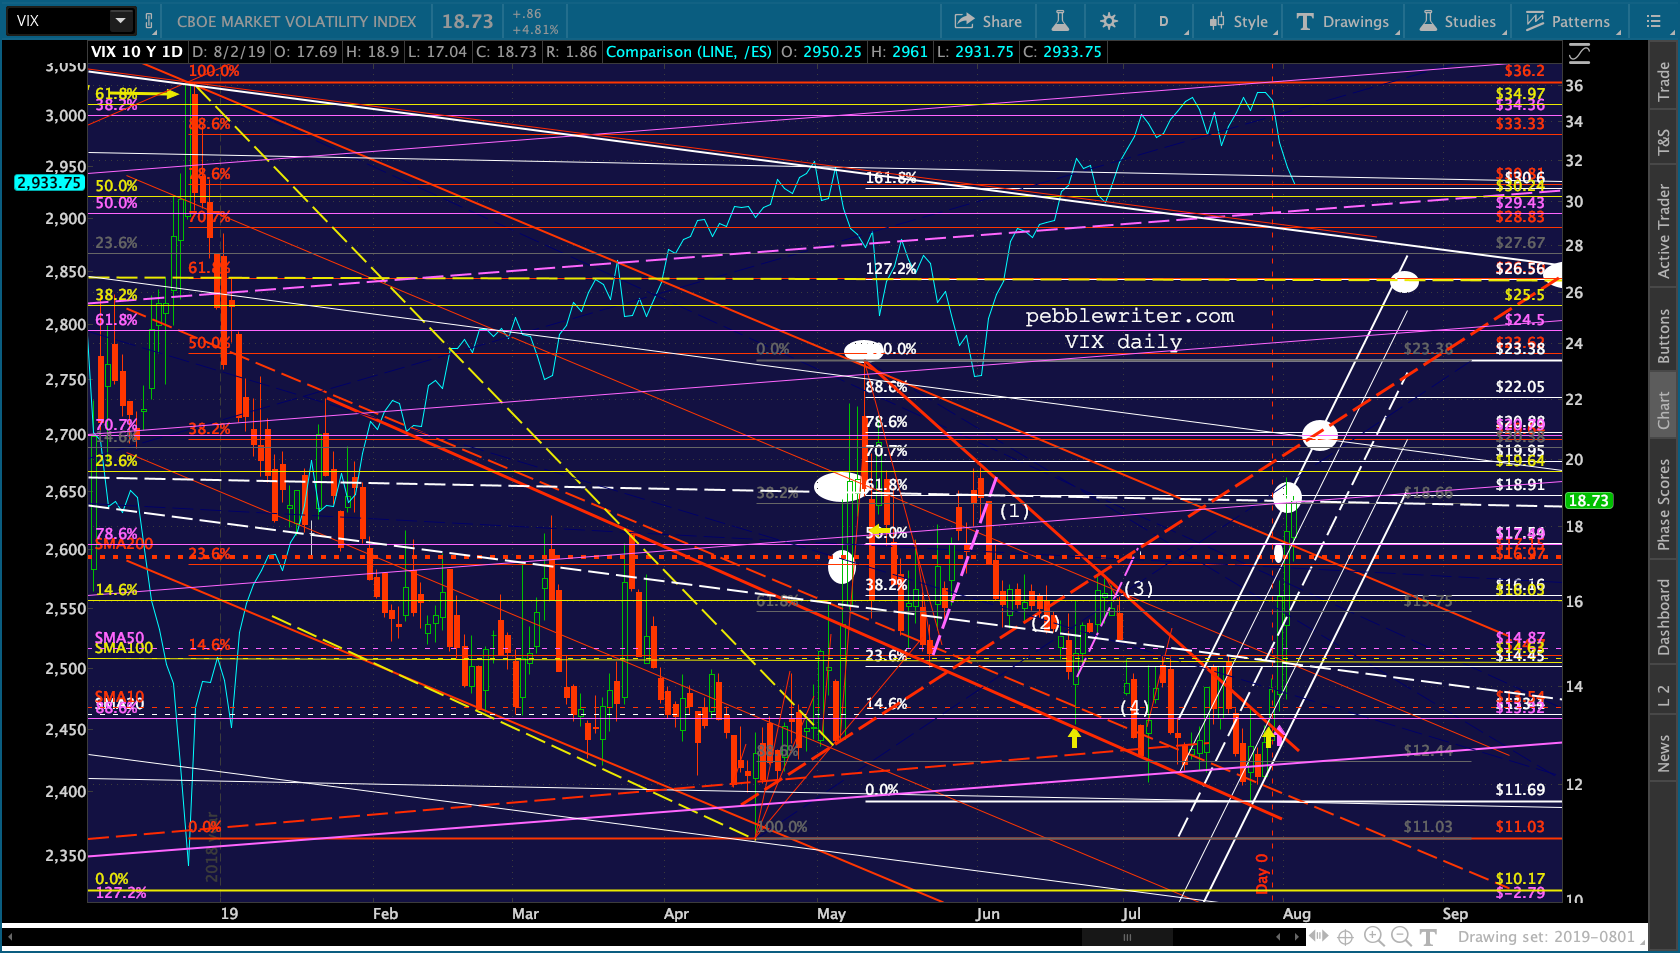 I currently have Aug 19 as the first significant turning point on the downside with a bounce up to Aug 30 and another lower low around the time of the next Fed meeting on Sep 18. I will spend the next few hours analyzing the timeline and price levels given the faster/farther start we’ve seen.
For those who have been with me from the start, you might remember the 2011 analog experienced a similar hiccup in June when Obama released oil from the Strategic Petroleum Reserve, sending oil and stocks lower than expected for a few days. In the end, the analog recovered its original path in terms of both price and date. So, I will need to model it under both scenarios — at least 6-8 hours of work.
As to the immediate path ahead, I would expect SPX to bounce at 2928-2930 and backtest the white midline or falling SMA60 10 — whichever comes first — at around 2968 or 2980. I’ll check back in if something completely unexpected happens. If it plunges through the SMA50 at 2926 it has downside potential to at least the SMA100 at 2899.05.
More later.
UPDATE: 10:20 AM
SPX just tagged its SMA50 and is trying to bounce.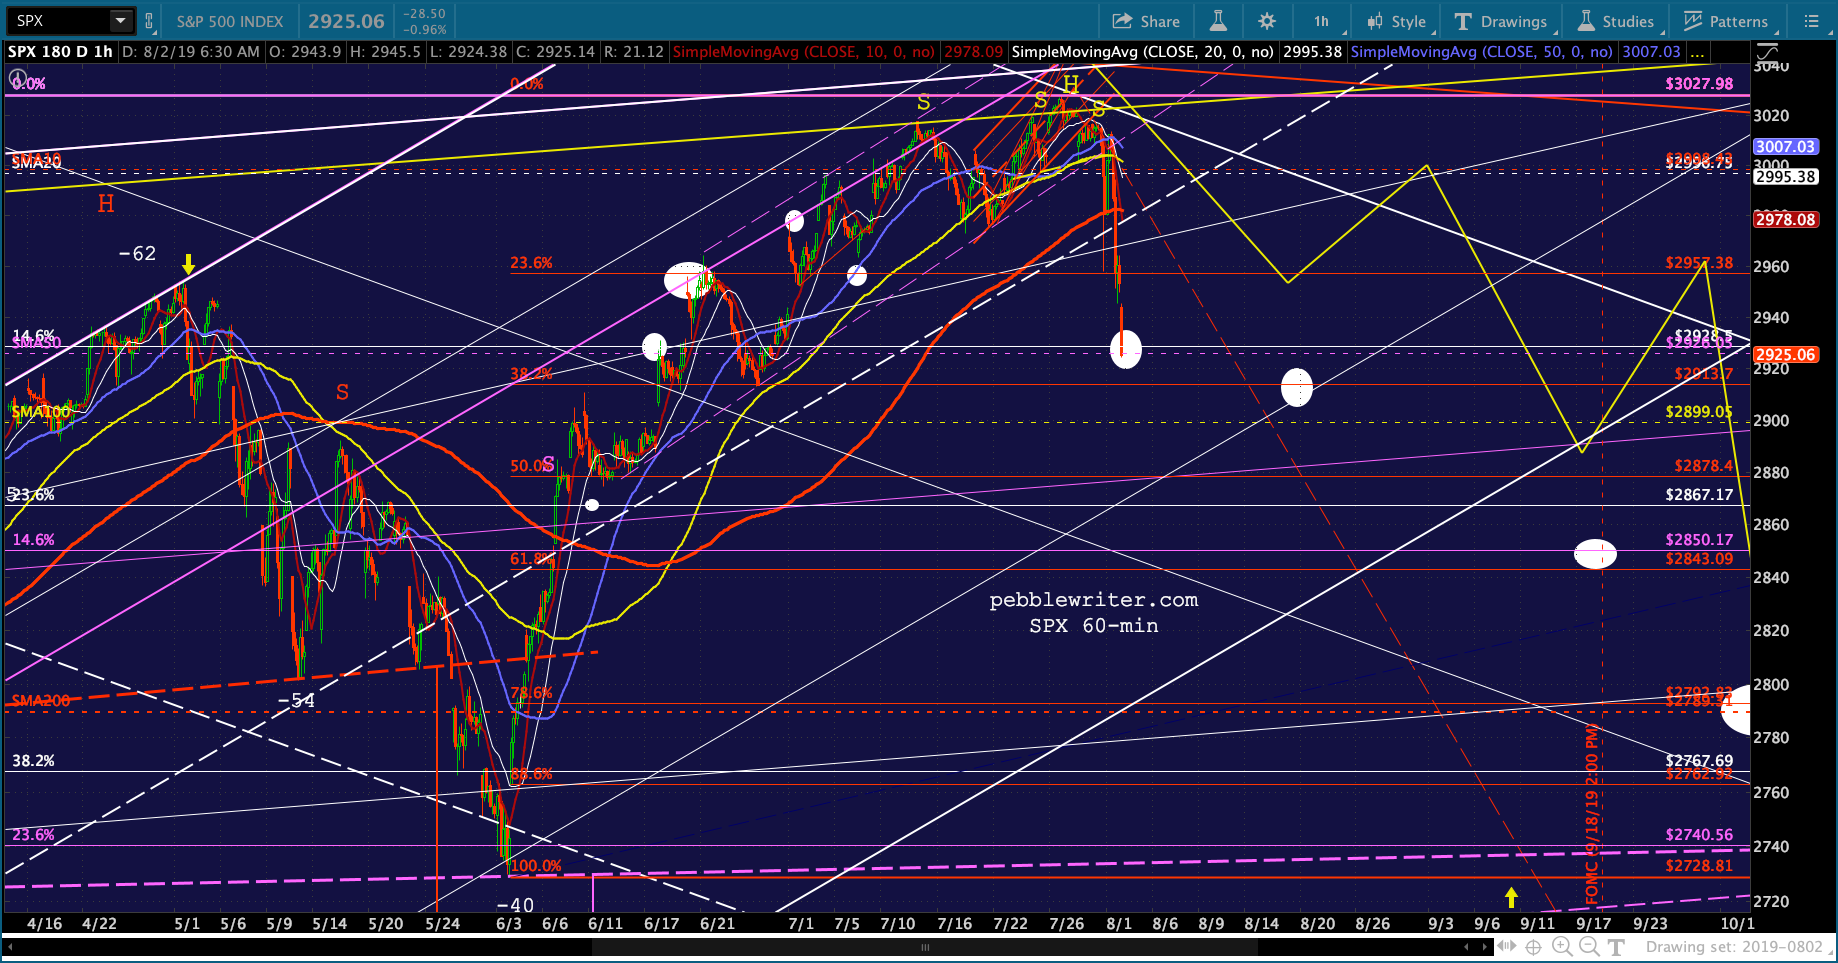 UPDATE: 11:45 AM
SPX and ES fell through their SMA50s and are currently testing their .382s. With VIX punching out of the rising white channel and above the .618, there’s a very good chance SPX and ES test the SMA100 as discussed earlier.
Note that this is the same price level as the analog scheduled for Aug 19. If things get really crazy, the red .618 at ES 2844/SPX 2843 come into view. 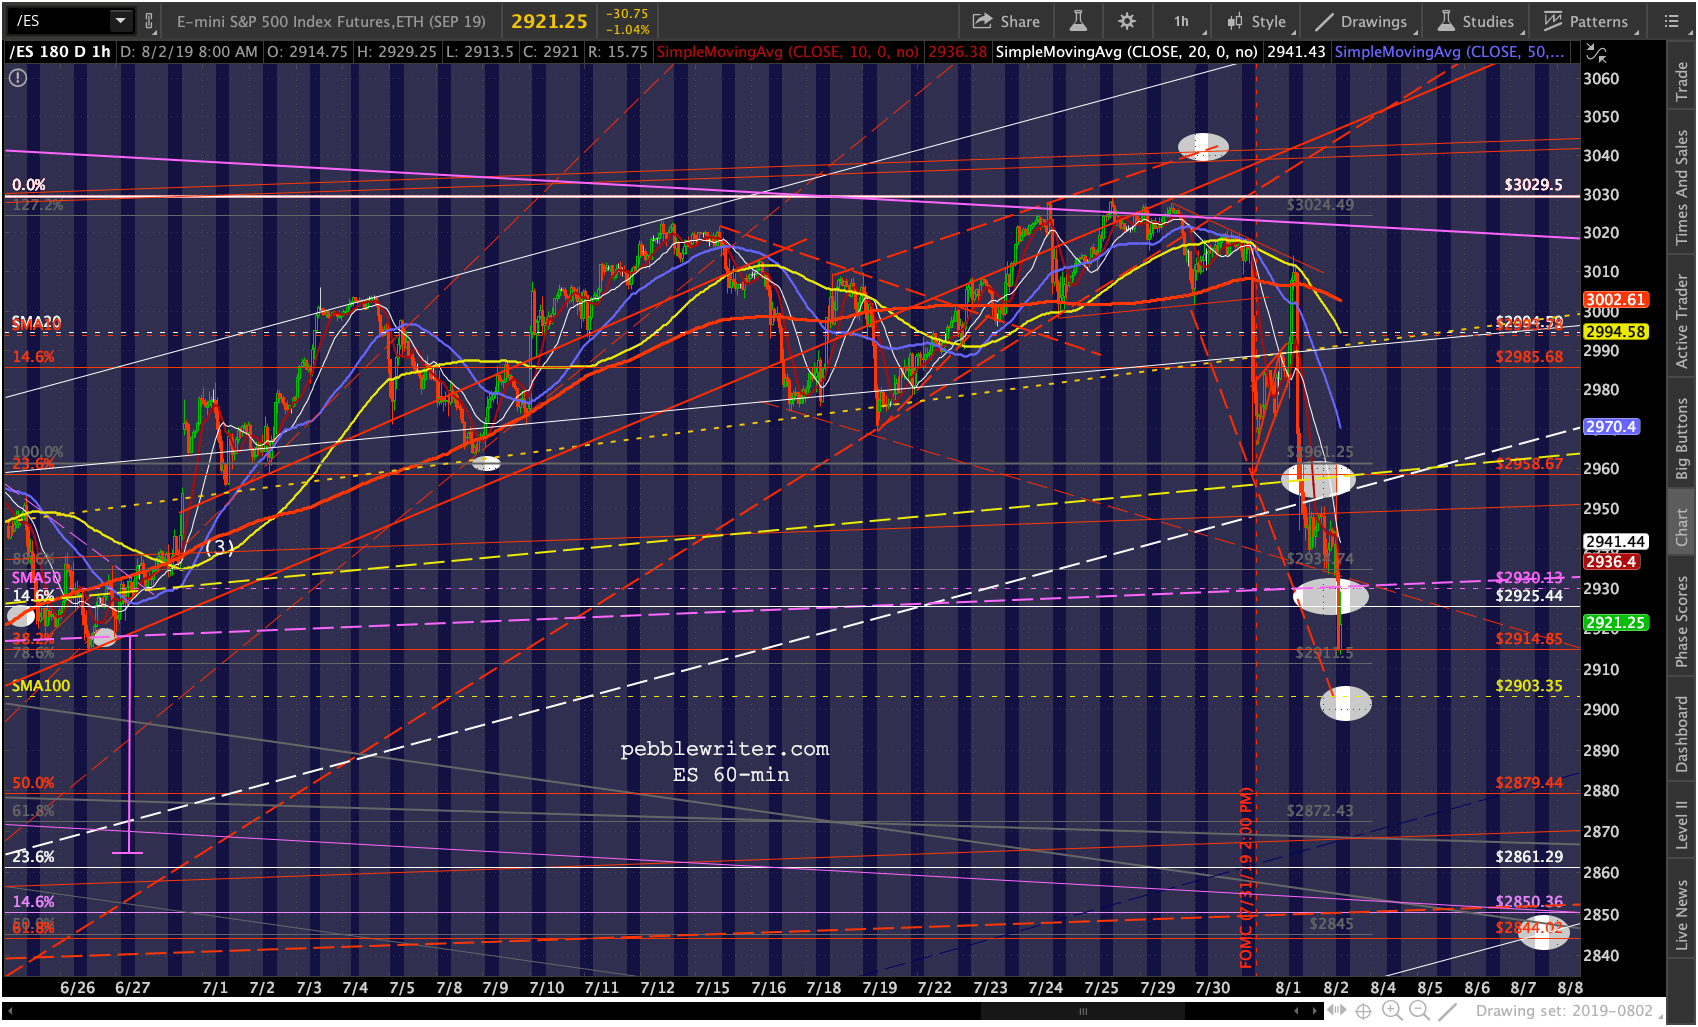
 I know many of you are playing the gold breakout. Our next upside target range remains 1484-1495.
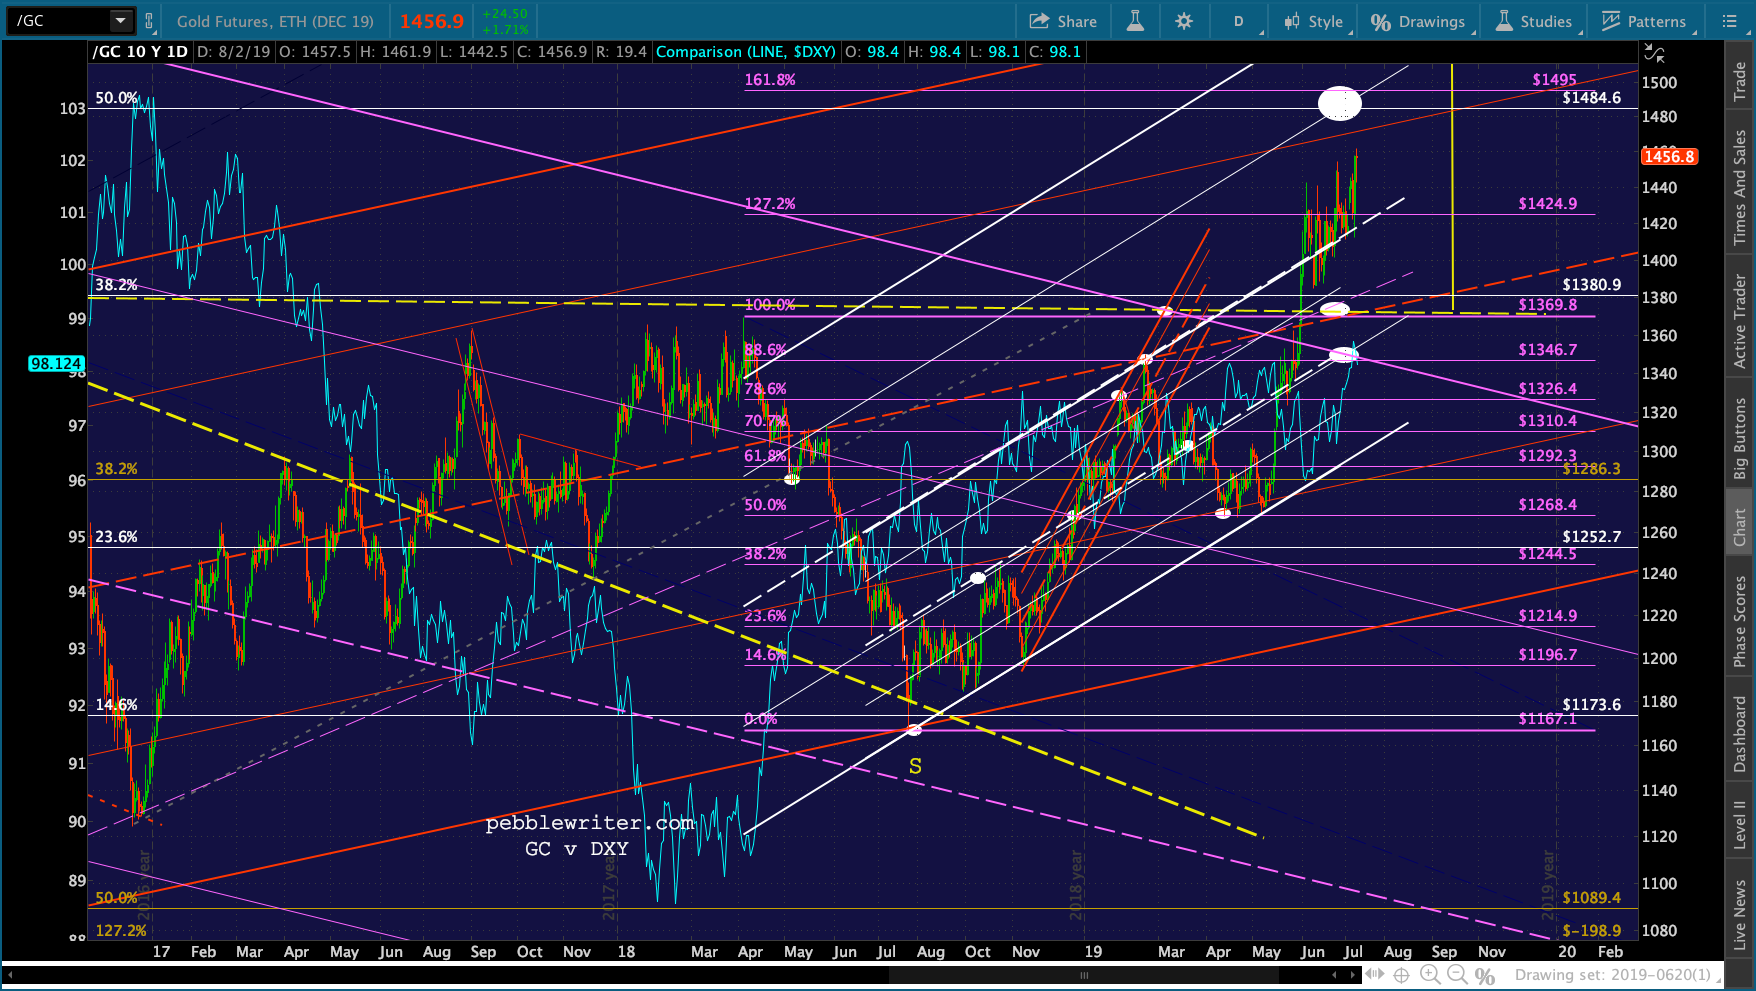 UPDATE: 3:50 PM
SPX’s SMA60 10 finally caught down to it. Big test re the close — bounce or flush? I’m guessing flush to the SMA100, but it’s a crapshoot. Please be careful if you’re tempted to hold short into the close. Hedging or going to cash isn’t a bad idea after a day like today.