We went long gold at 1286 back on Mar 6 with the expectation that we’d get a bounce up to 1346, but recognizing that there was more potential downside. From The Trade War: A Year Later:
GC has reached the 1286 target we laid out on Feb 21. It has clearly overshot its channel backtest, so more downside is warranted. However, DXY’s uncertainty is weighing on it. I’d take profits here and try a long position with tight stops. A bounce up to the purple channel top at 1346 (yes, again) wouldn’t surprise me.

The initial bounce only reached 1325. Gold tripped our stops on Apr 16, tagging our next lower target (1267.90 versus our target of 1268.40) on April 23. It liked that target so much it tagged it twice more before finally lifting off on May 21.  On Friday, it finally reached our 1346.70 target. We’ll take a fresh look, and evaluate the potential for a breakout.
continued for members…Note that it has not only reached the purple .886, but has tagged the top of the falling purple channel and backtested the purple TL.
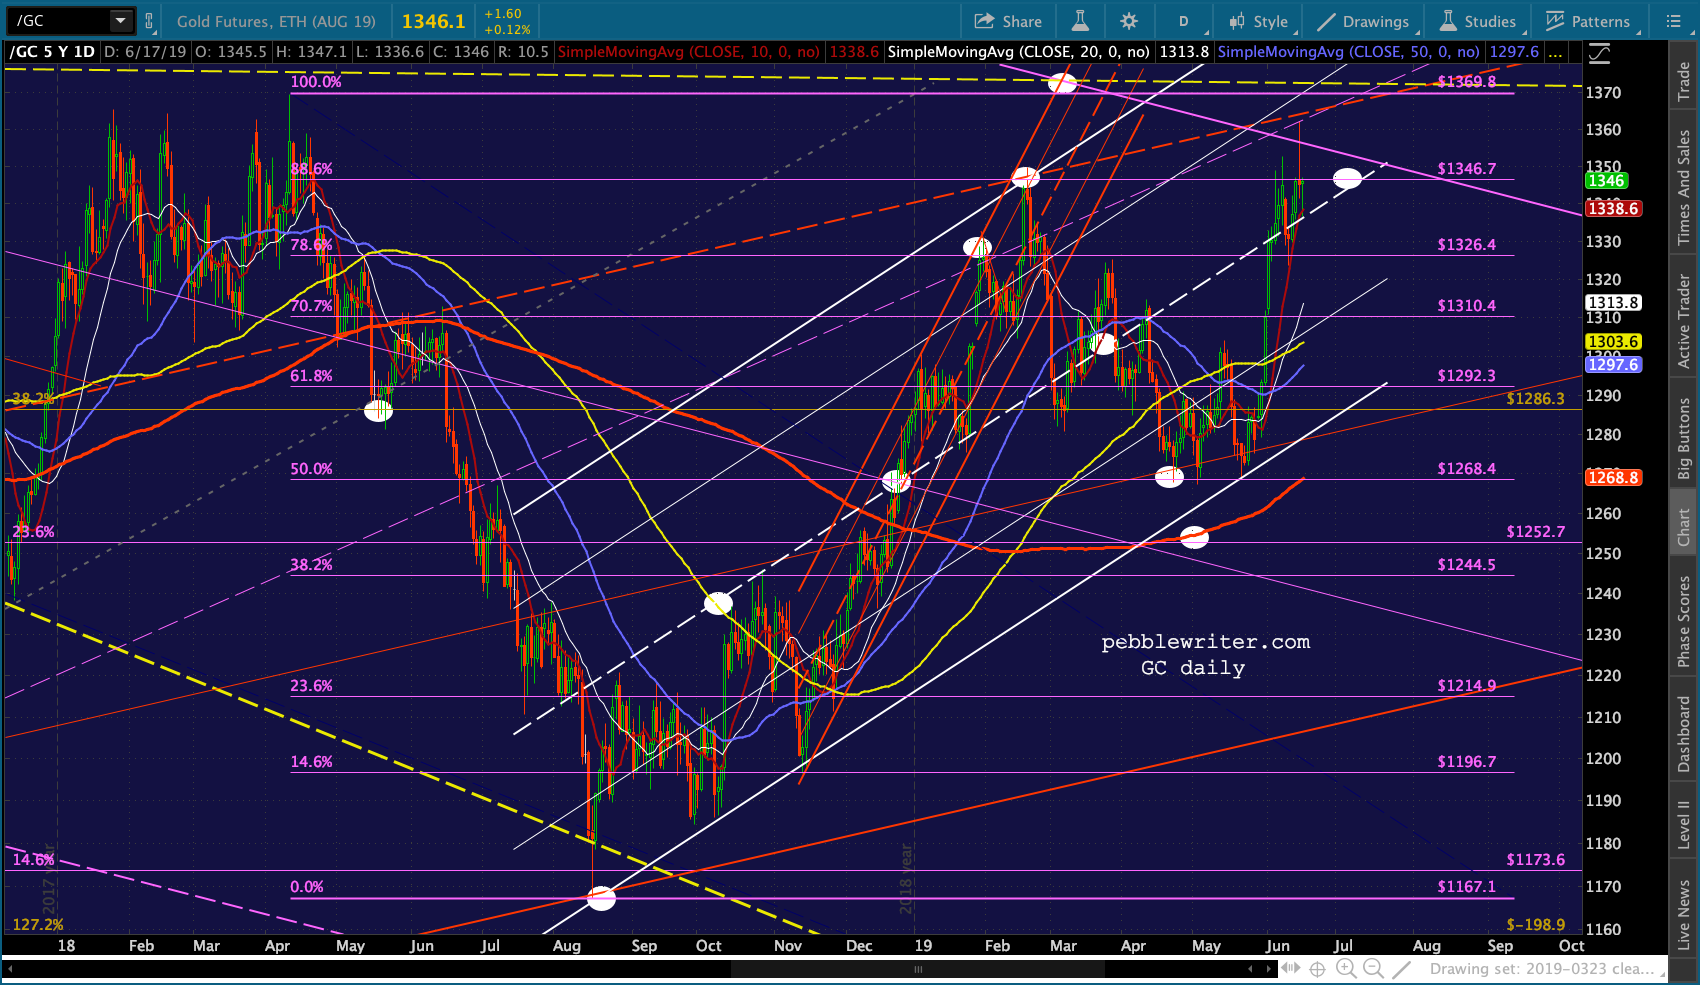 The purple channel is based on the Sep 2011 high and four major lows since Jan 2011.
 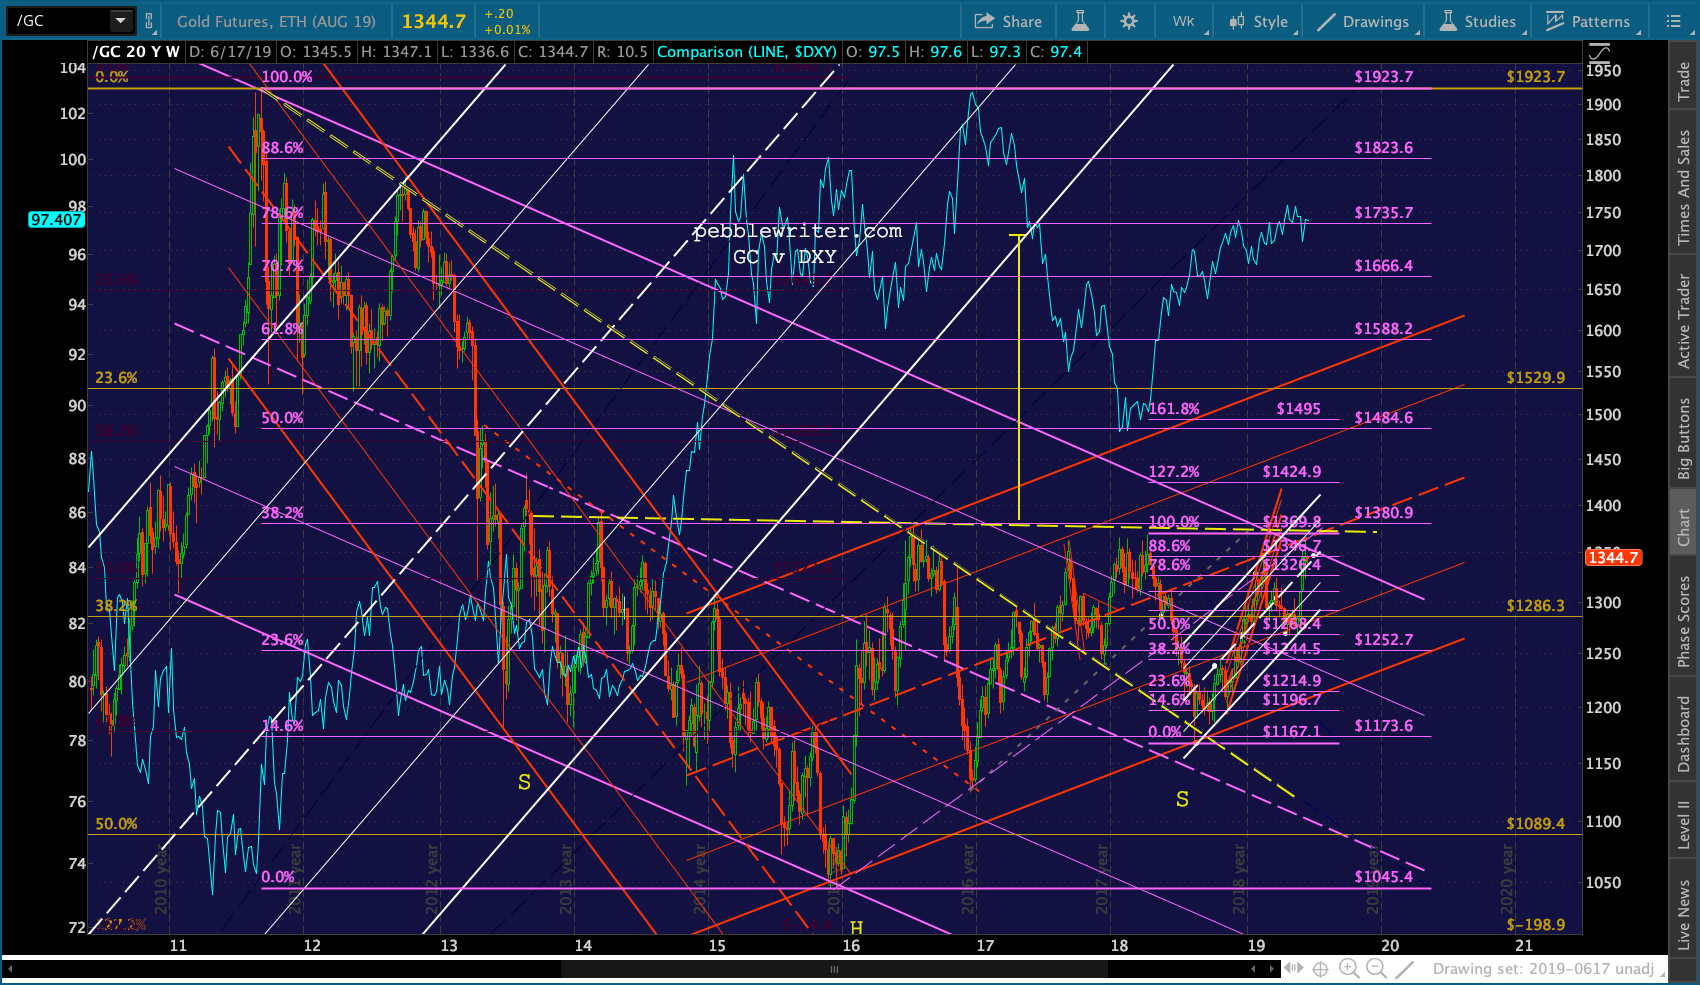 It’s questionable to draw a channel with only one point by which to place the upper bound. In this case, however, we also have the horizontal resistance at 1370ish, the red channel midline and the aforementioned .886 Fib. They all suggest heavy resistance here.
Note that DXY also has a lot to say about the future of gold. Each time since Mar 2014 that GC has retreated from the yellow horizontal resistance, DXY has bounced nicely. This has happened every time but on: the most recent reversals. Here’s a closeup of the above chart.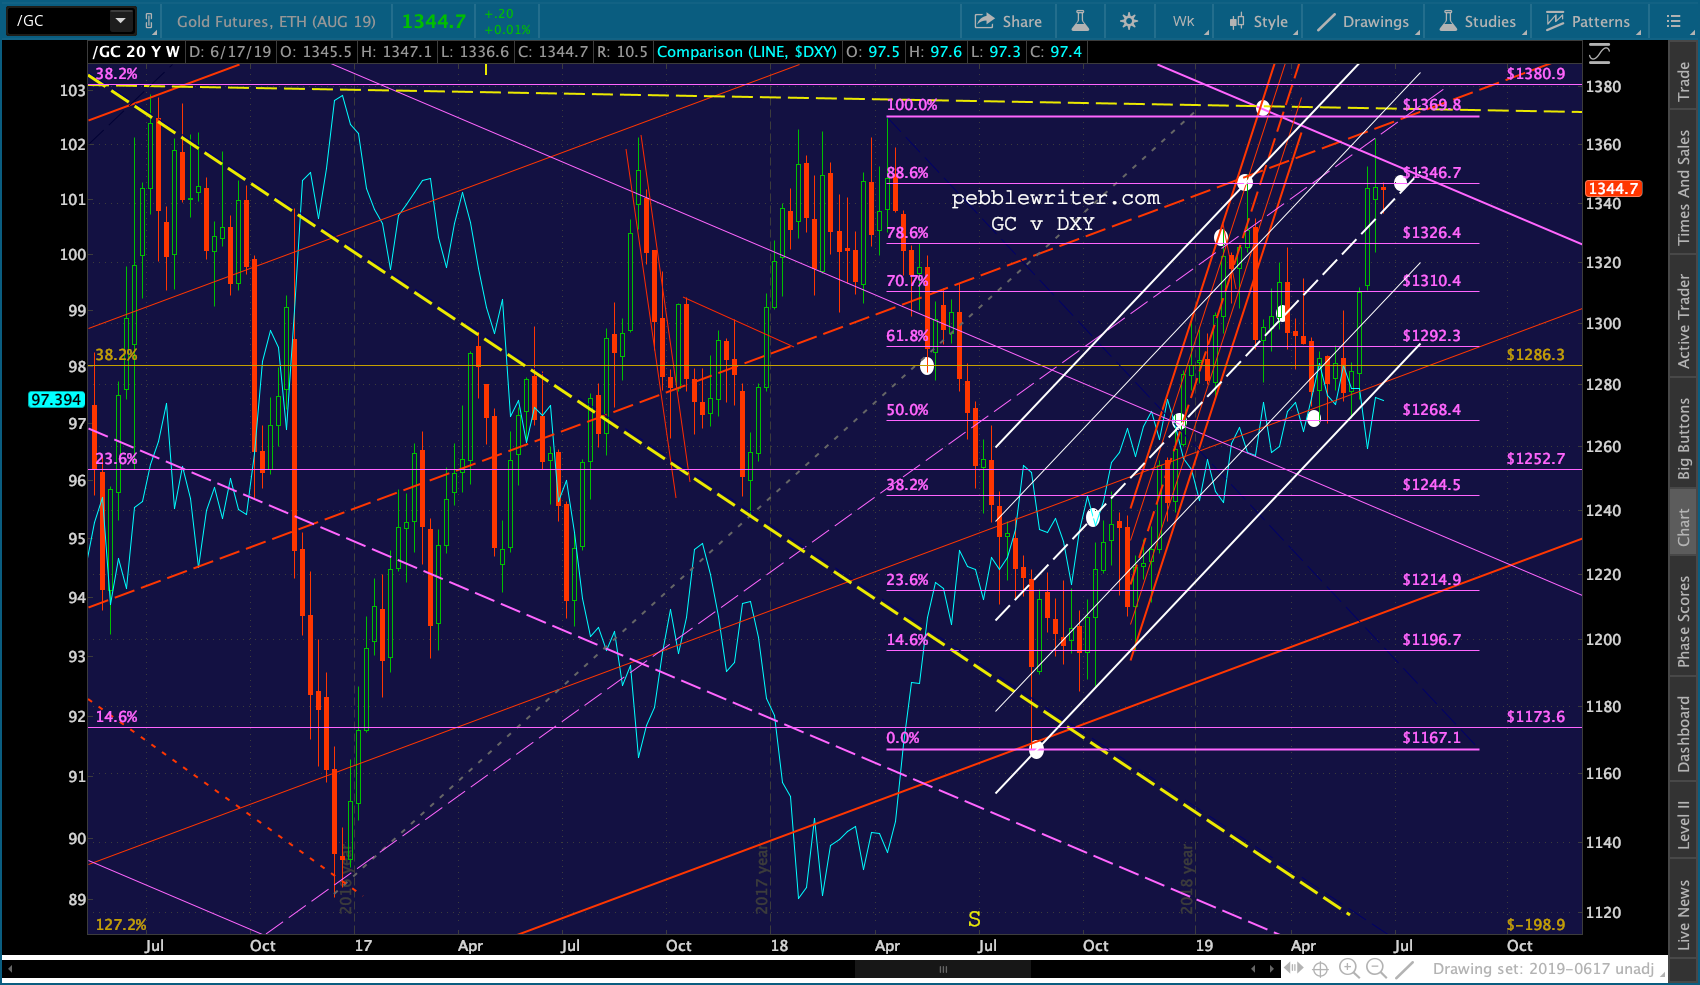 Gold and DXY usually move opposite one another. Since Sept 2018, however, that relationship has broken down. DXY’s highs in Dec 2018 and Jan 2019 came on new highs in GC. It took a long overdue backtest of DXY’s white channel bottom to get GC up to its purple channel top — a goal it failed to reach in Feb.
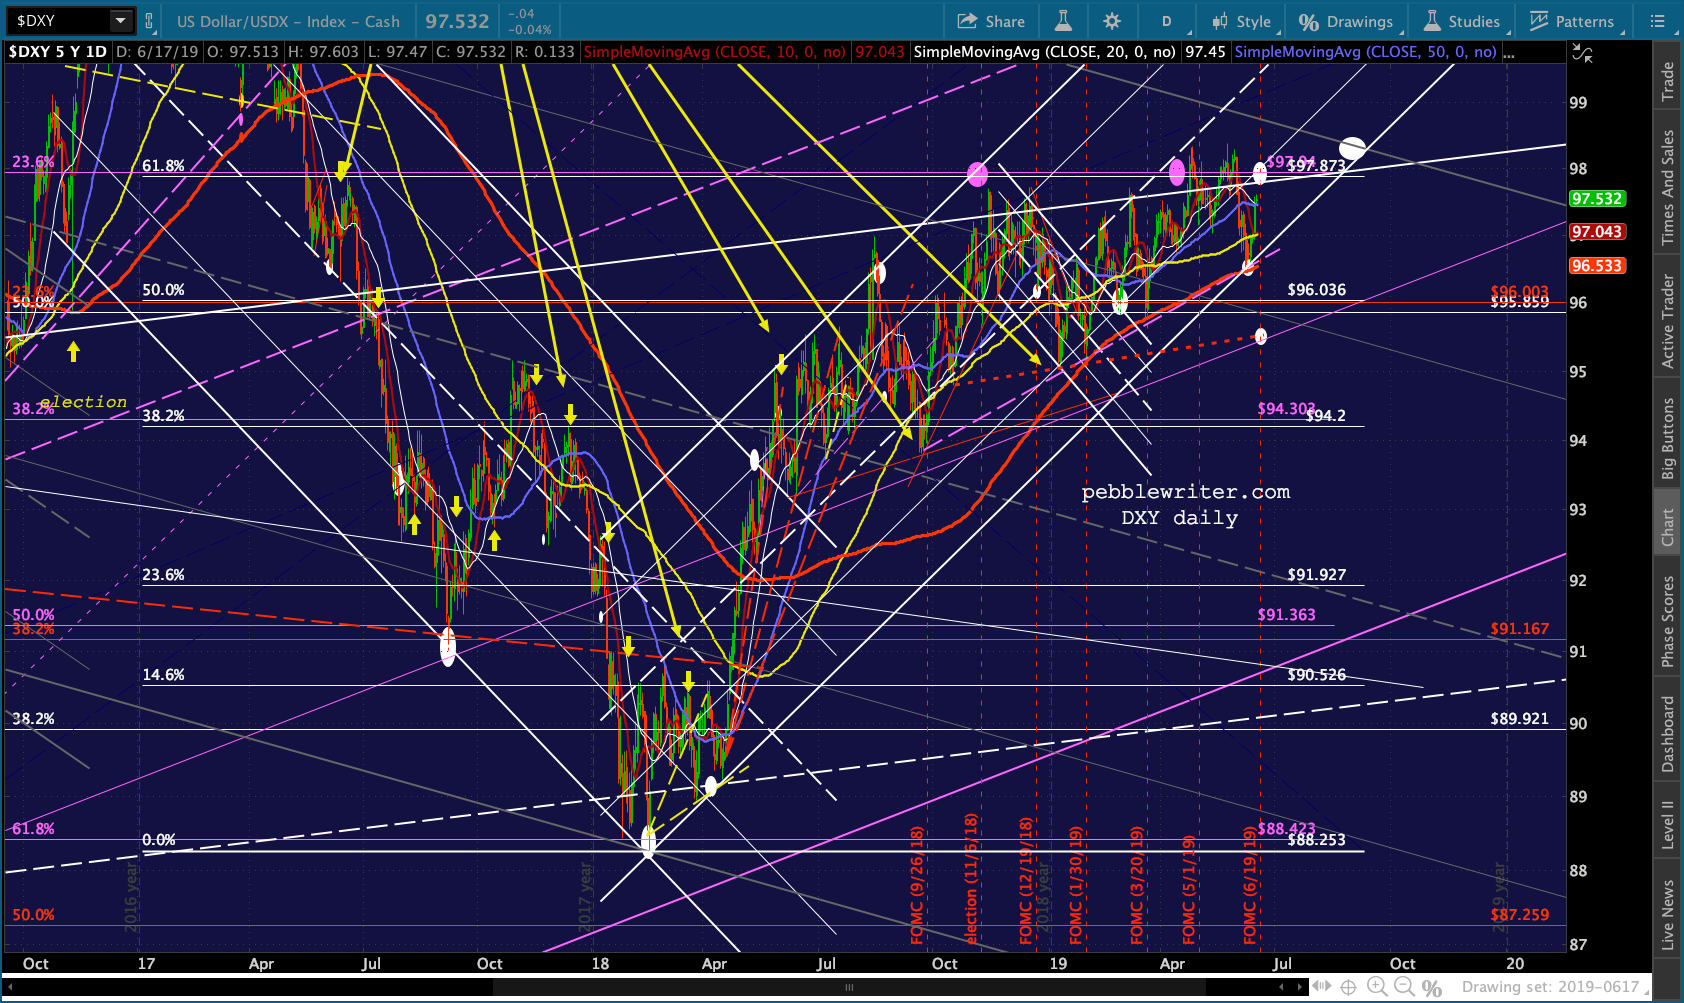
If we look at it from the standpoint of DXY, we can see that DXY has steadfastly refused every opportunity to break out past its .618 — just as GC has refused every opportunity to break out past its horizontal resistance.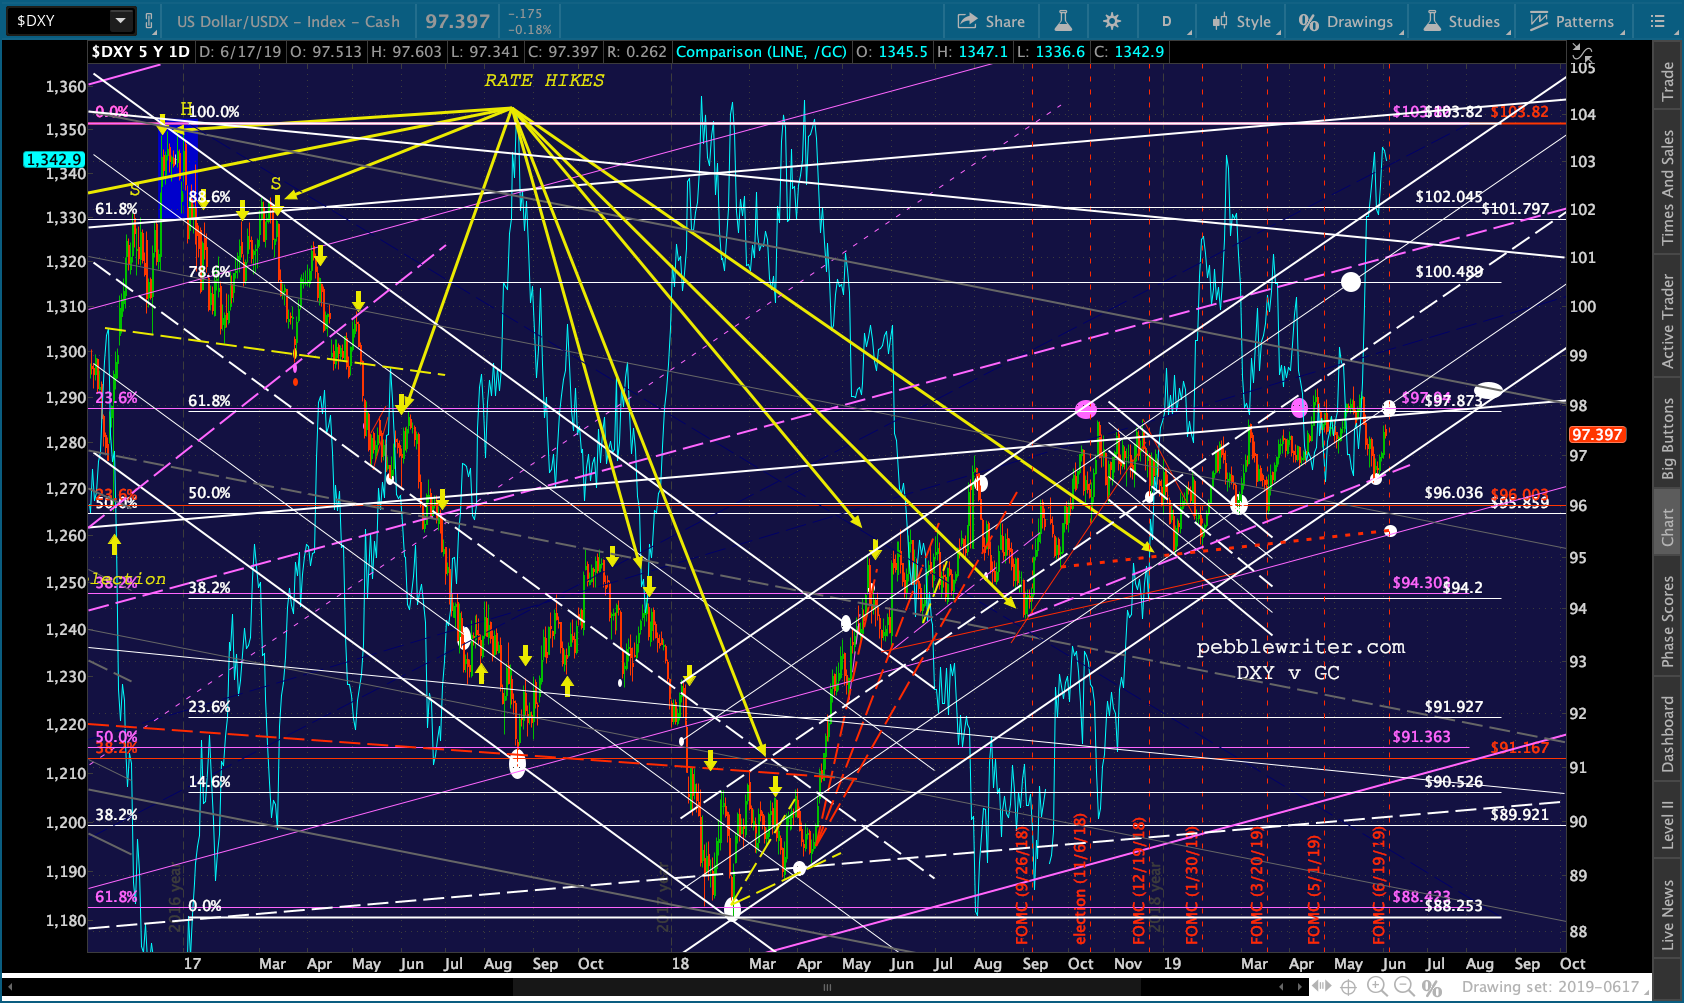 The other thing that stands out from this chart is that it took smaller and smaller declines in DXY to produce those tests of GC’s overhead resistance.
With GC sitting barely below overhead resistance, this suggests it wouldn’t take much of a drop in DXY to produce a GC breakout. If there a case for a sizable drop in DXY?
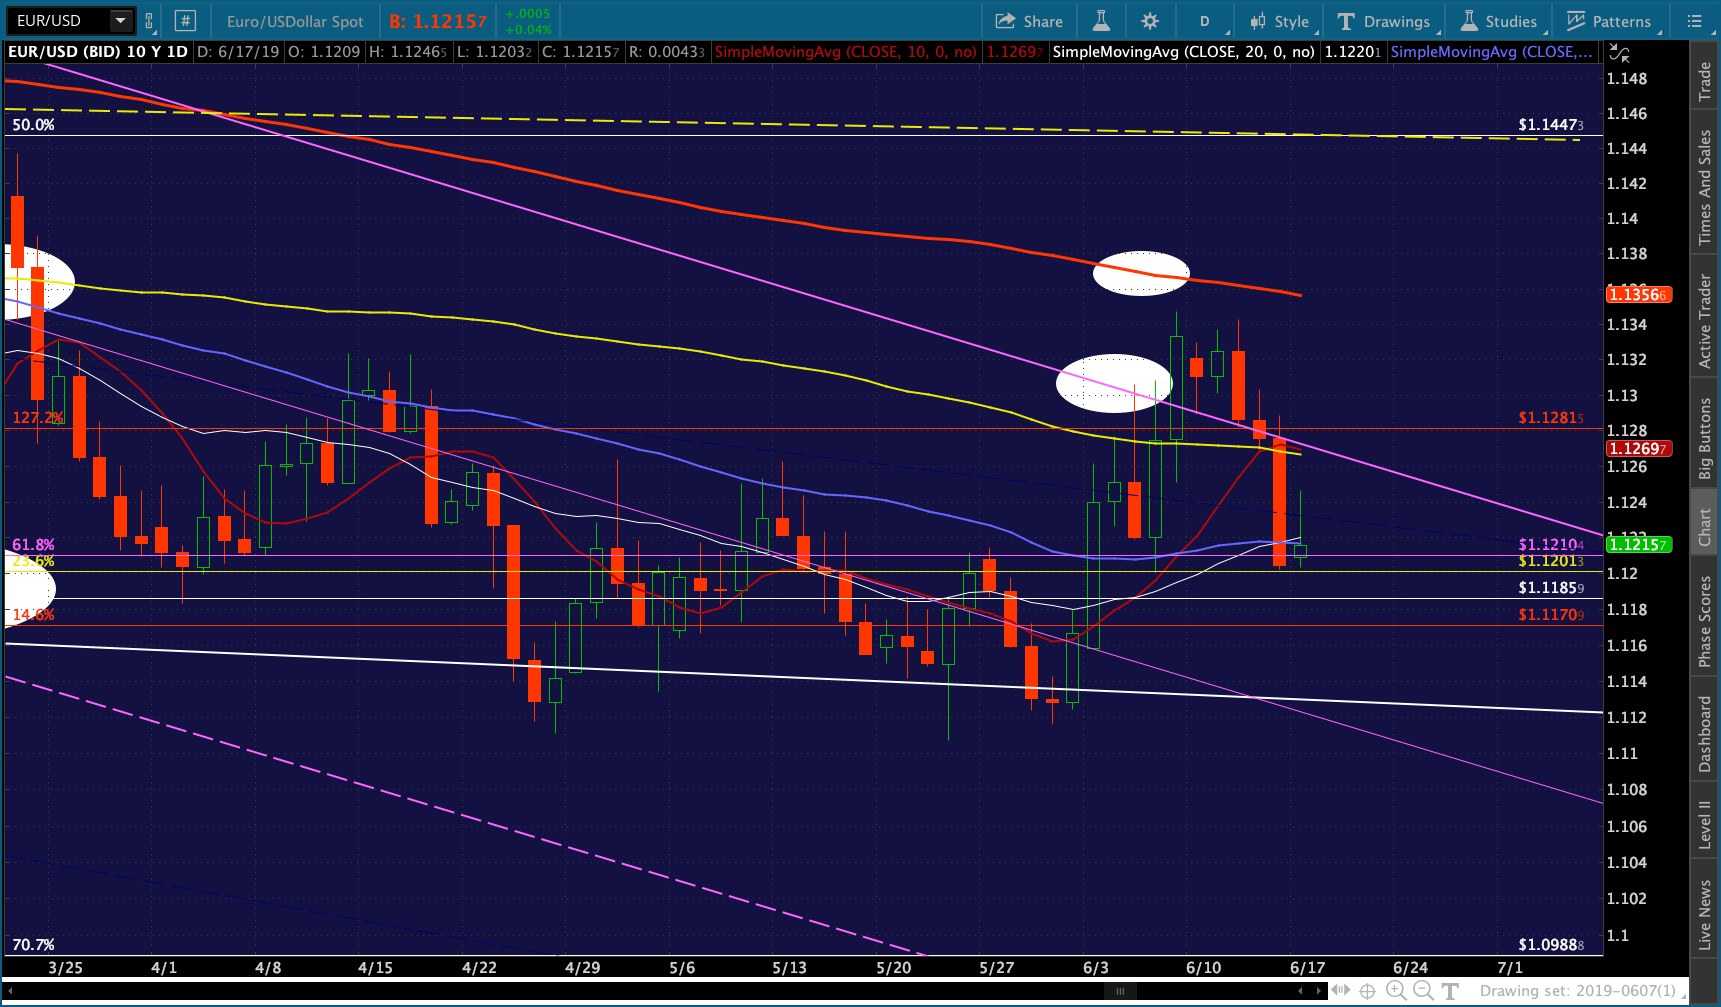
The index has consistently surprised me with its ability to delay its tag on the bottom of the rising white channel since April 2018. There have been 6-8 instances where it might have completed a tag, but the EURUSD always got in the way — spending Apr 2018 to Jun 2019 unable to tag the top of a pretty clearly defined falling channel or break down. It hasn’t backtested its SMA200 since May 2018.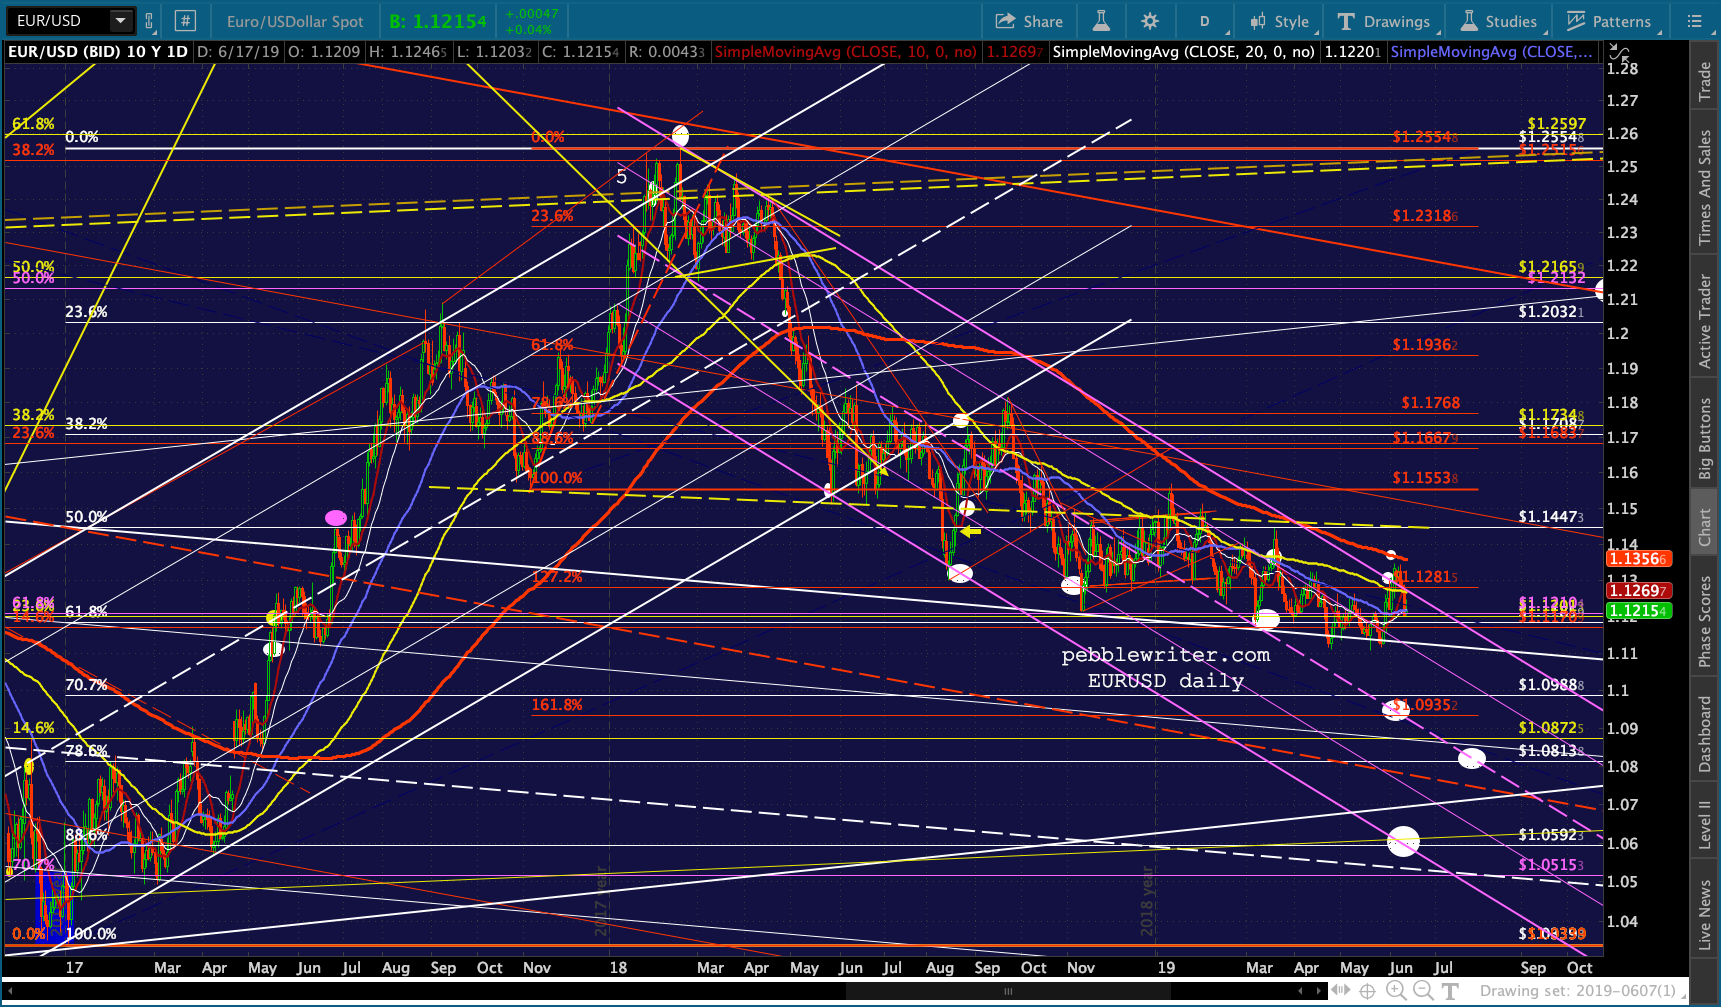 Since Aug 2018, the pair has gone essentially nowhere. Though it made noises about breaking out between Jun 7-13, it couldn’t even manage to tag the SMA200 — just .0021 above the Jun 7 high. It promptly fell back into the channel and below the SMA100. This doesn’t mean it can’t break out — but, it was a pretty pathetic attempt.
 Likewise, it has been completely unable to break down — continually backtesting the top of the big white channel detailed in our last EURUSD update.
It seems central bankers are content to keep DXY and EURUSD going sideways for the duration — though a choice must be made by Aug 21 — when DXY’s rising white channel bottom passes through the .618 that has been the obstacle thus far.
History says GC will be rebuffed somewhere between today’s highs and 1380.90 and will retreat to around 1224-1241.60. But, as long as GC can remain above 1346.70, it makes sense to remain long with stops back around 1345. Maybe this will be the time it finally breaks out.
* * *
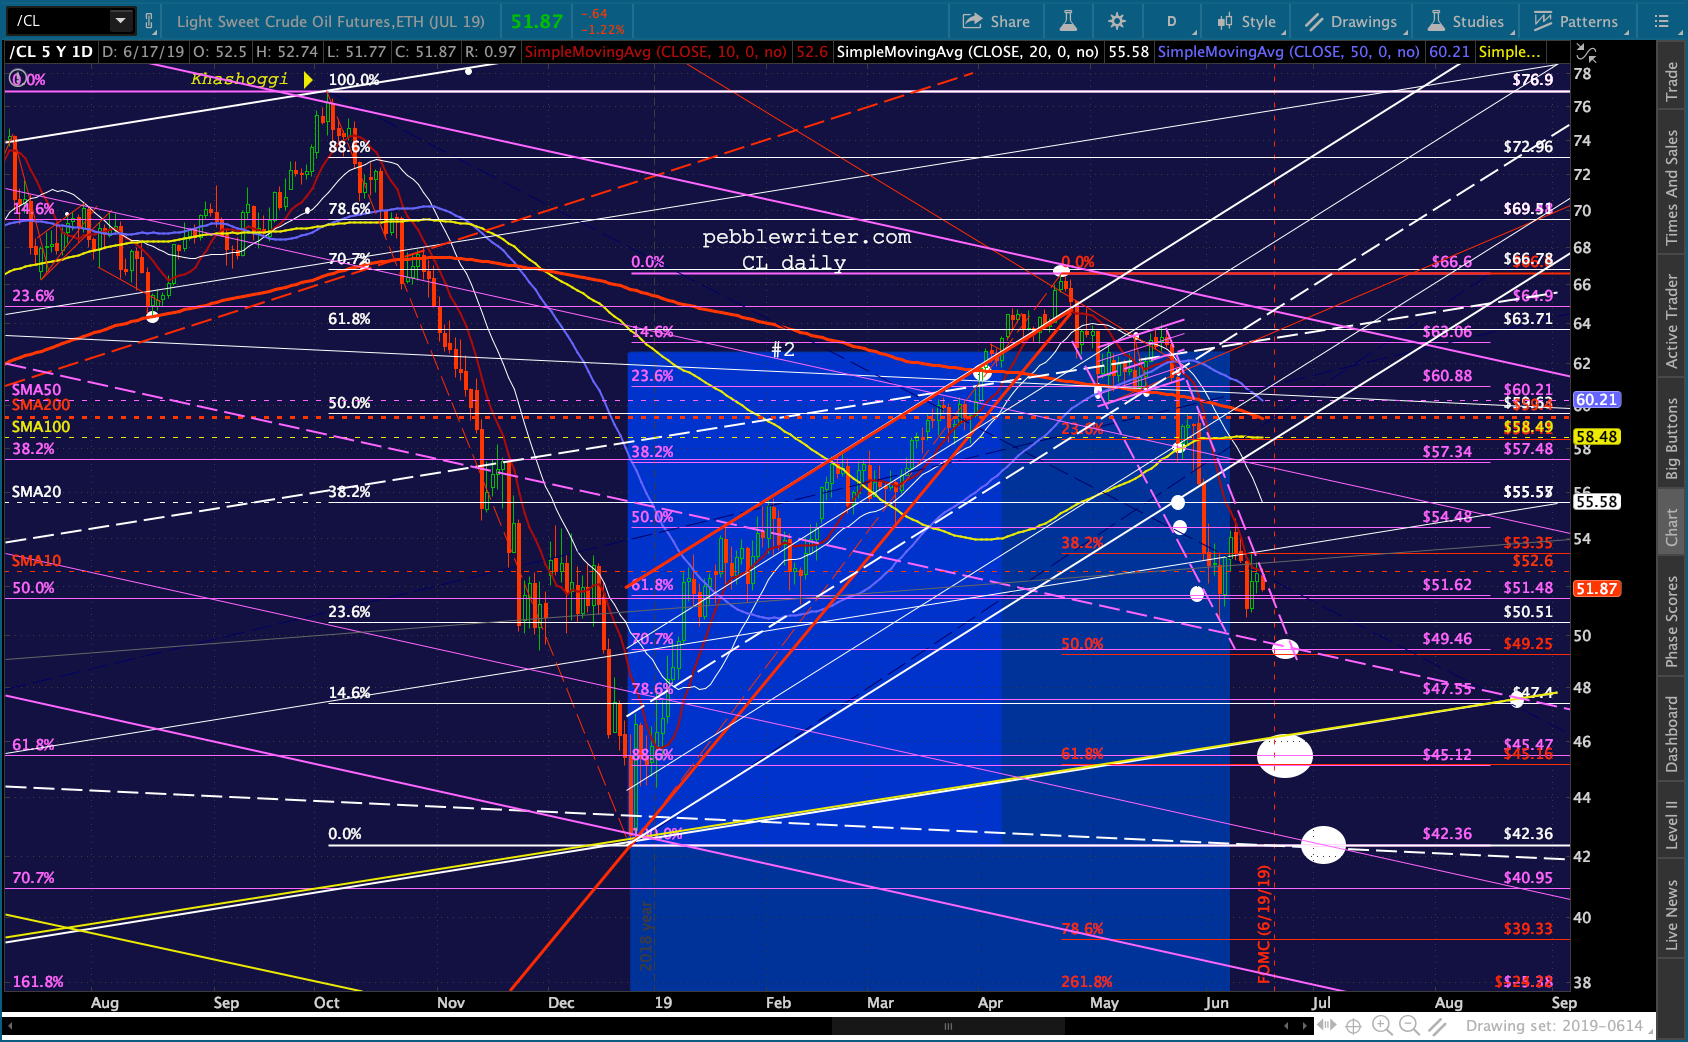
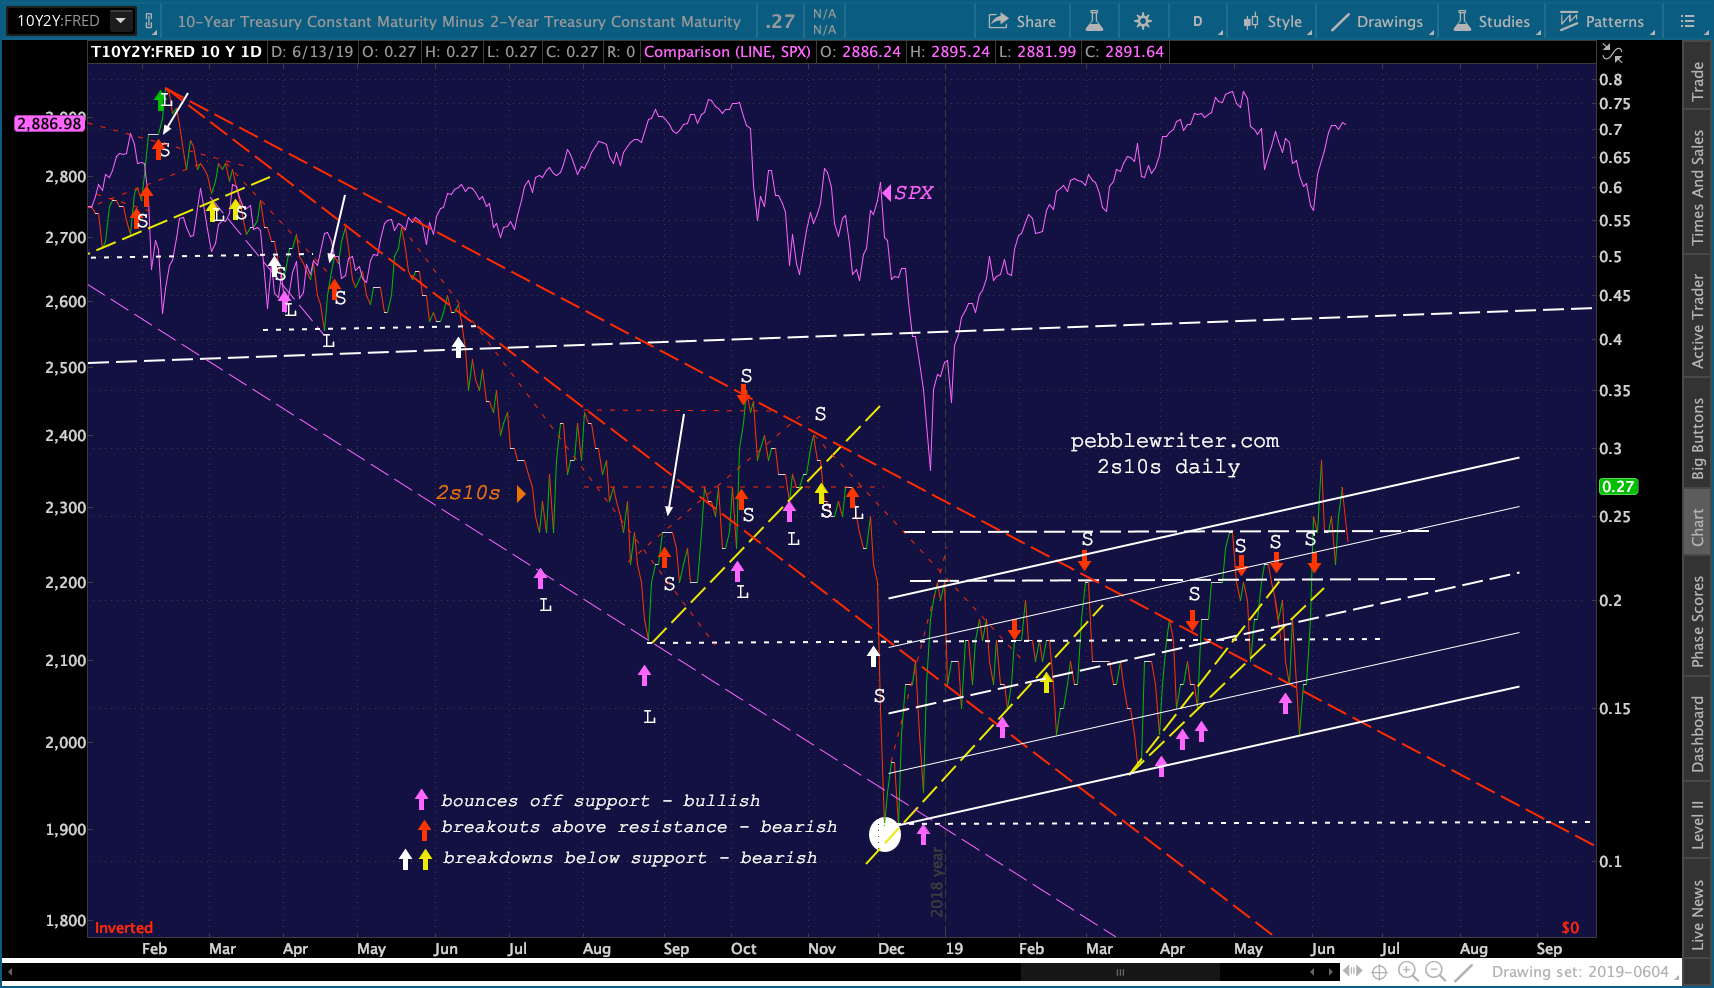
The rest of today’s charts… I remain bearish on stocks, oil and gas, bullish on bonds. The yield curve is still playing cat and mouse with a breakout.
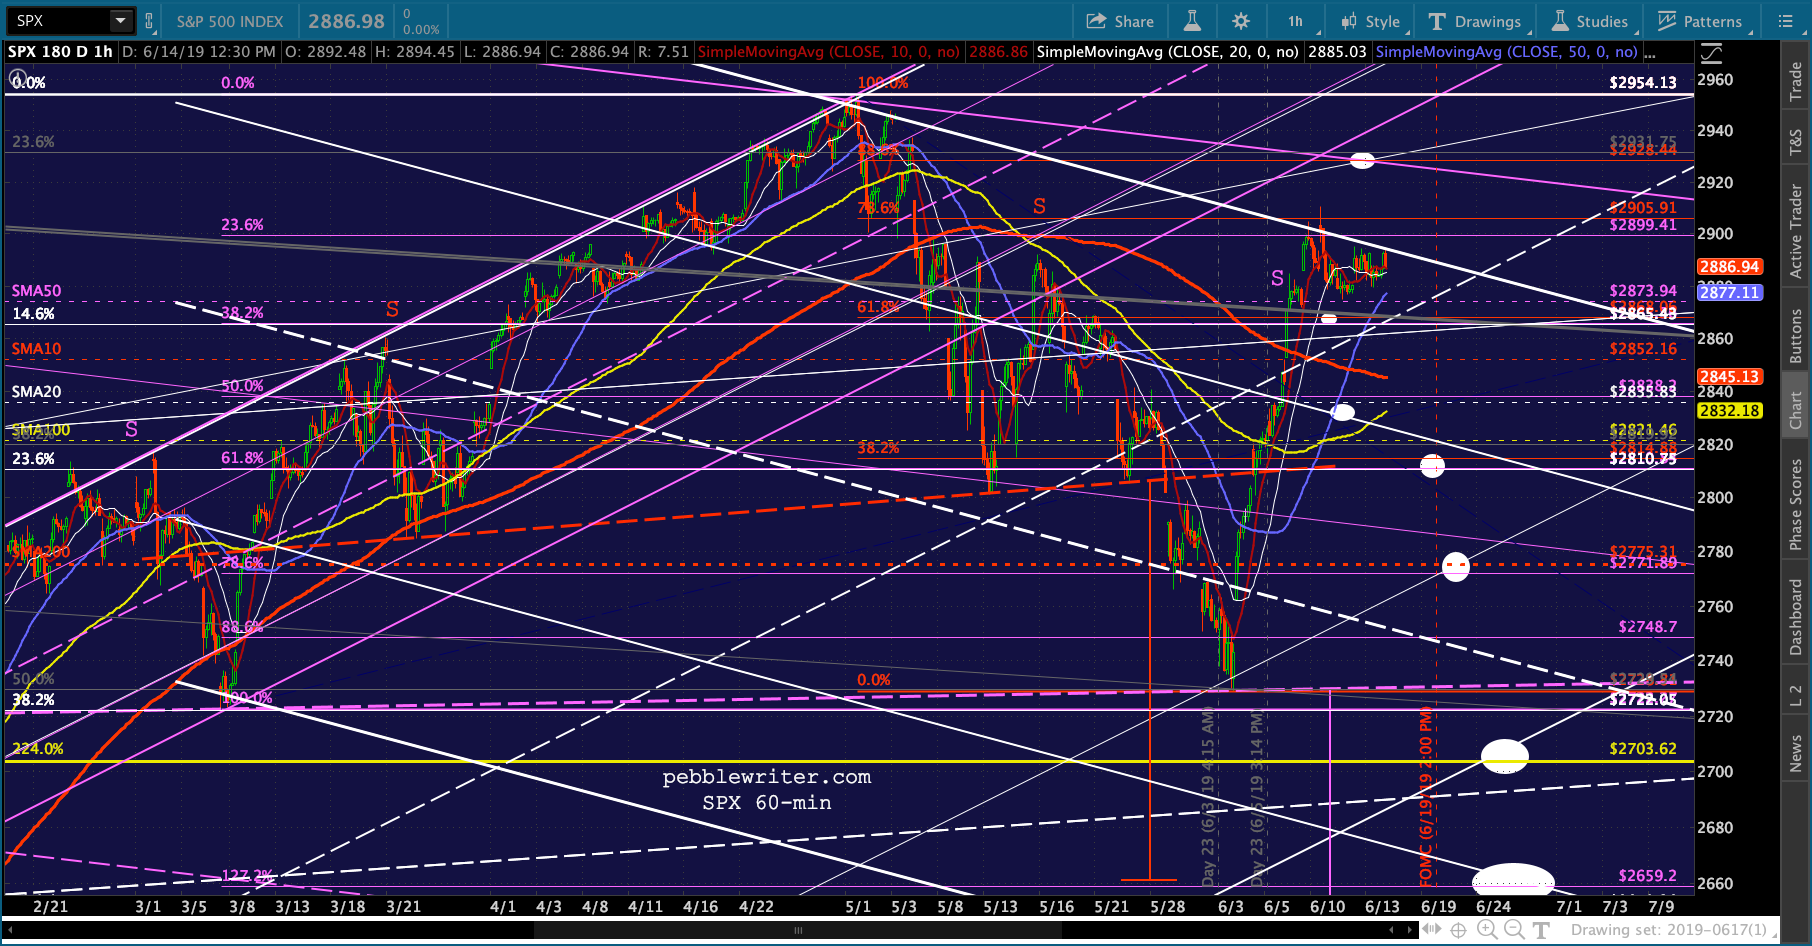
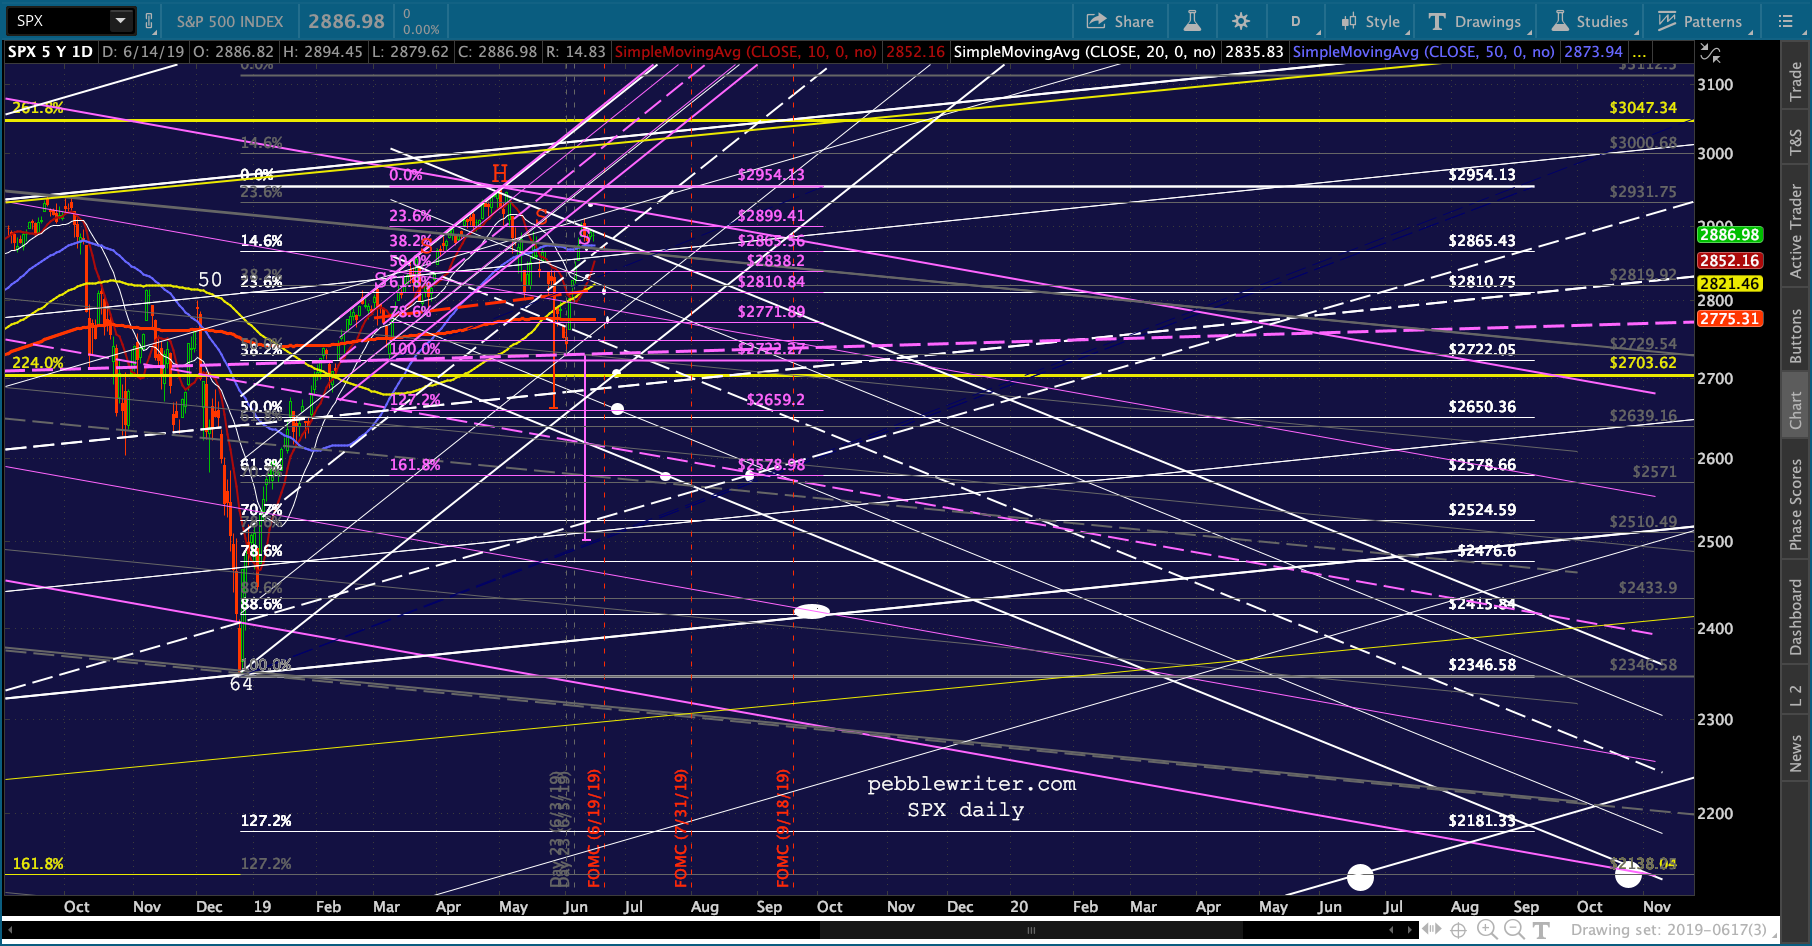
 I’ve drawn ES and SPX’s falling white channels to reach their 1.618s in October 2020. This remains my primary thesis unless Trump resigns or it becomes obvious along the way that he has no chance at reelection.
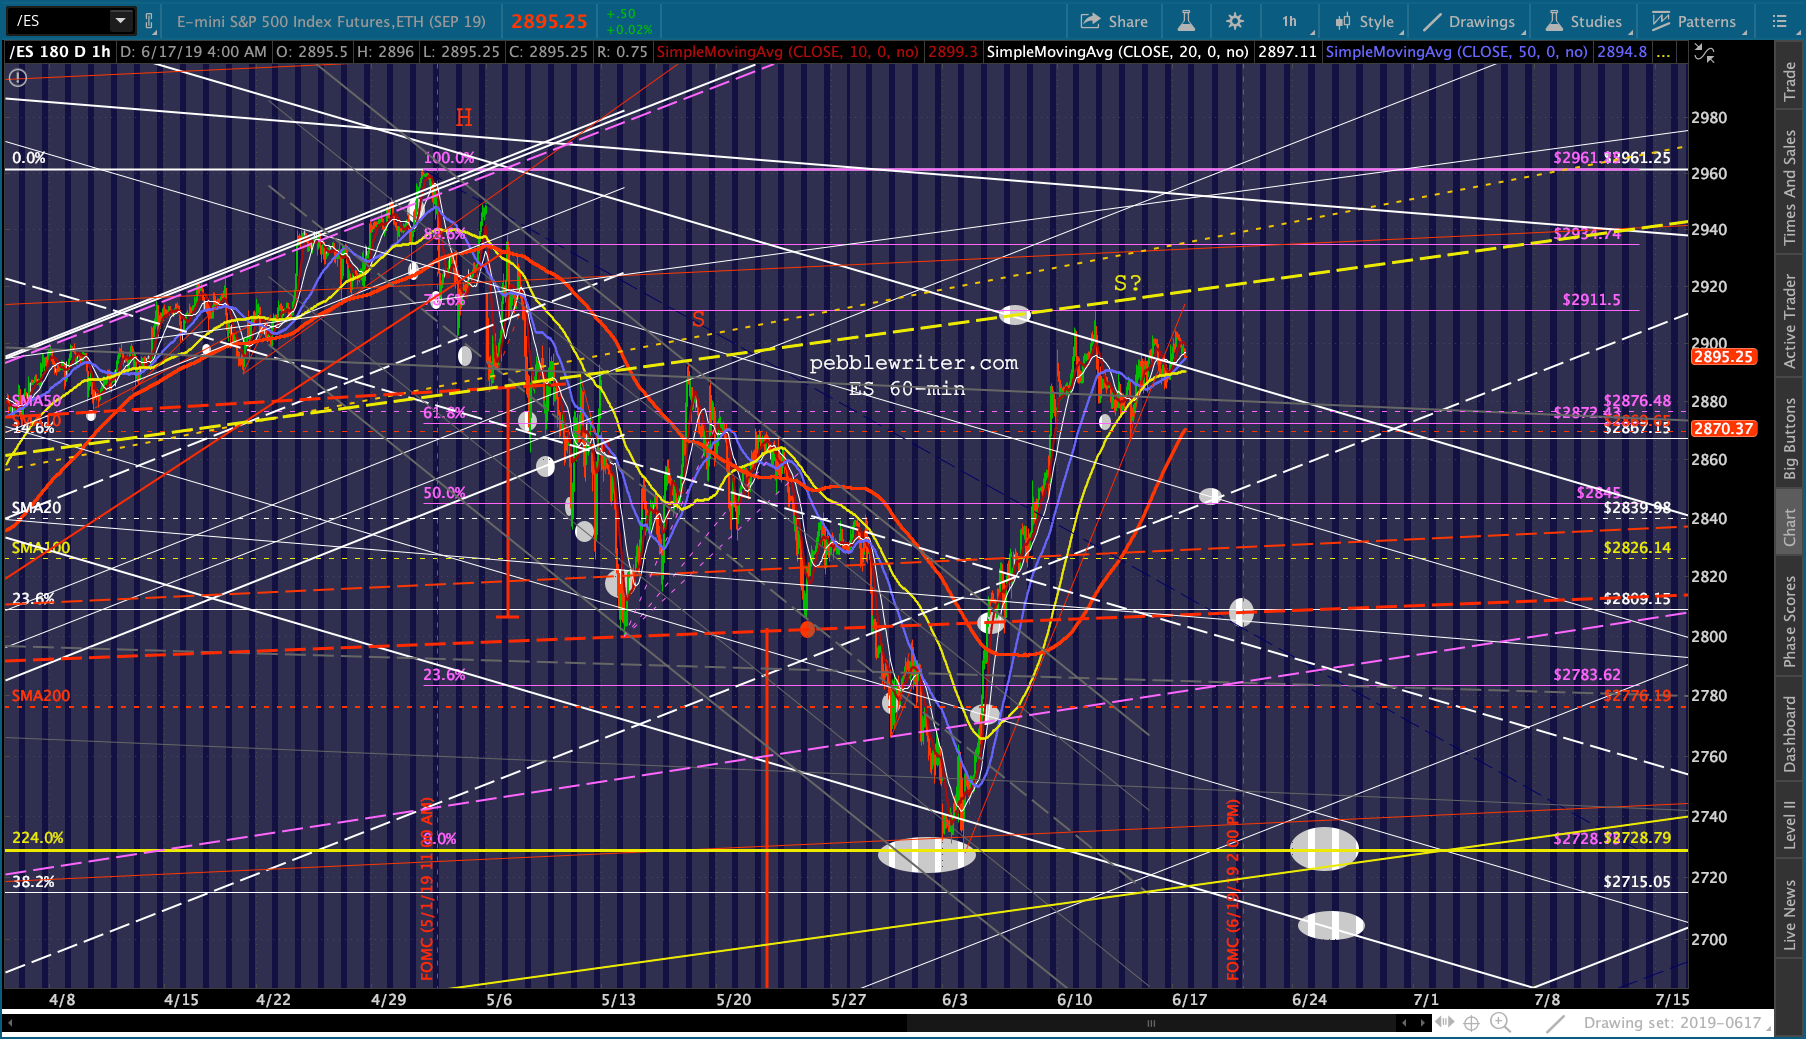
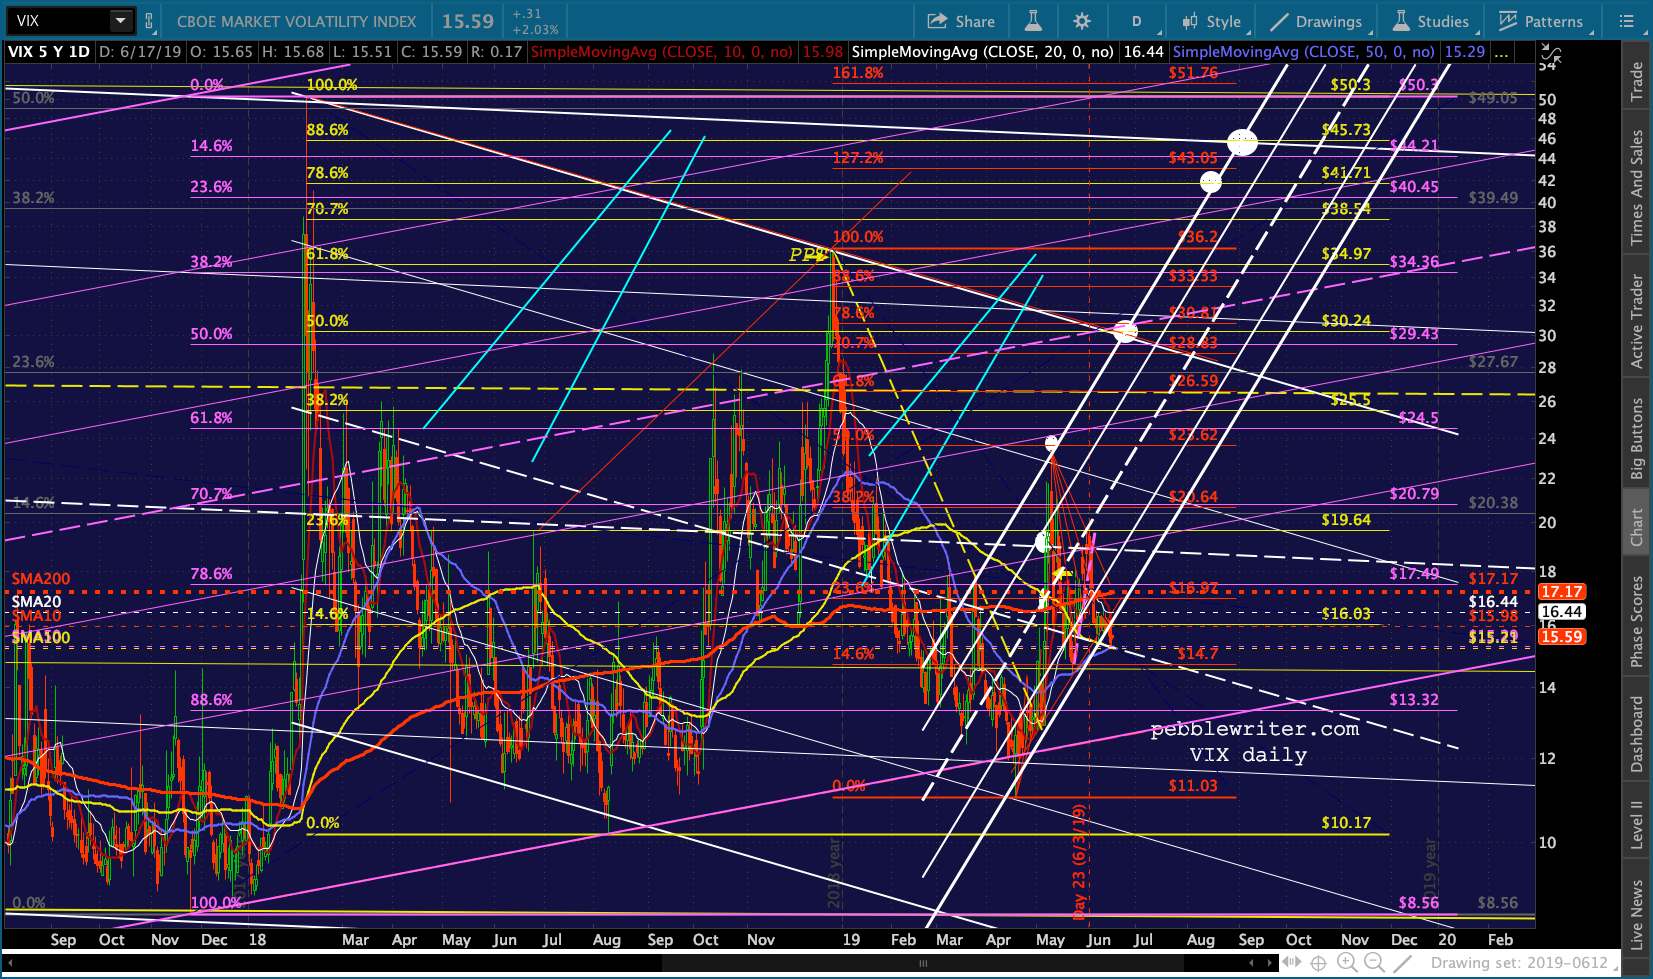
 VIX is threatening to break down, but in reality is doing just enough to prop up stocks in advance of the FOMC statement on Wednesday.
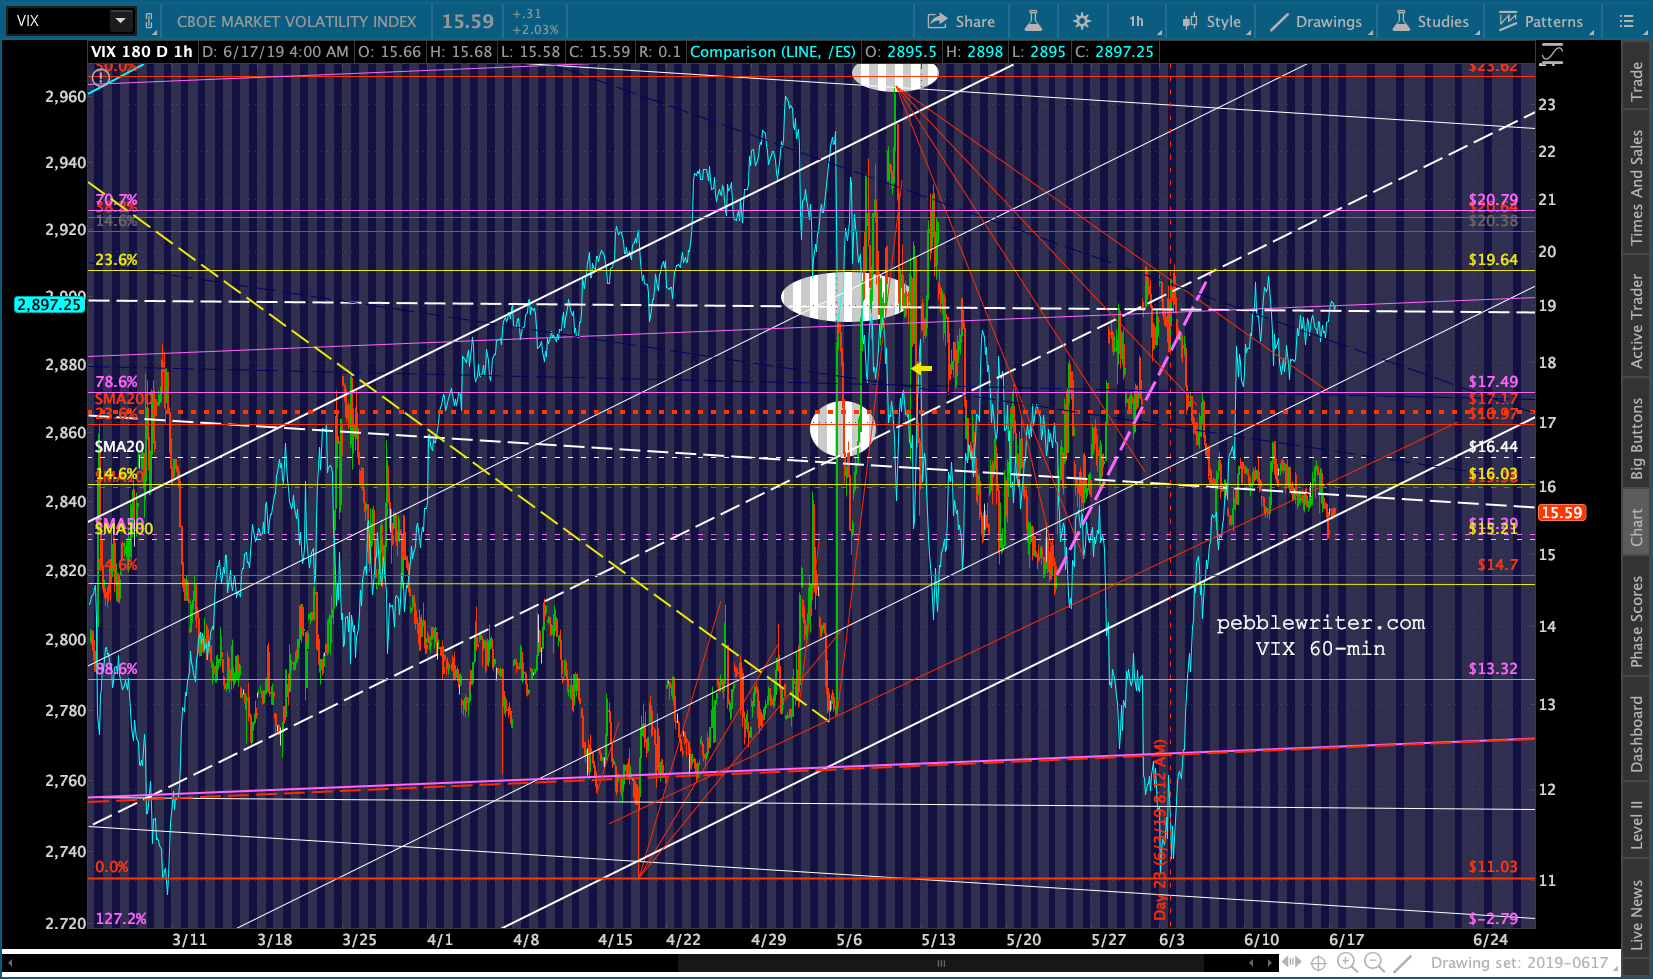
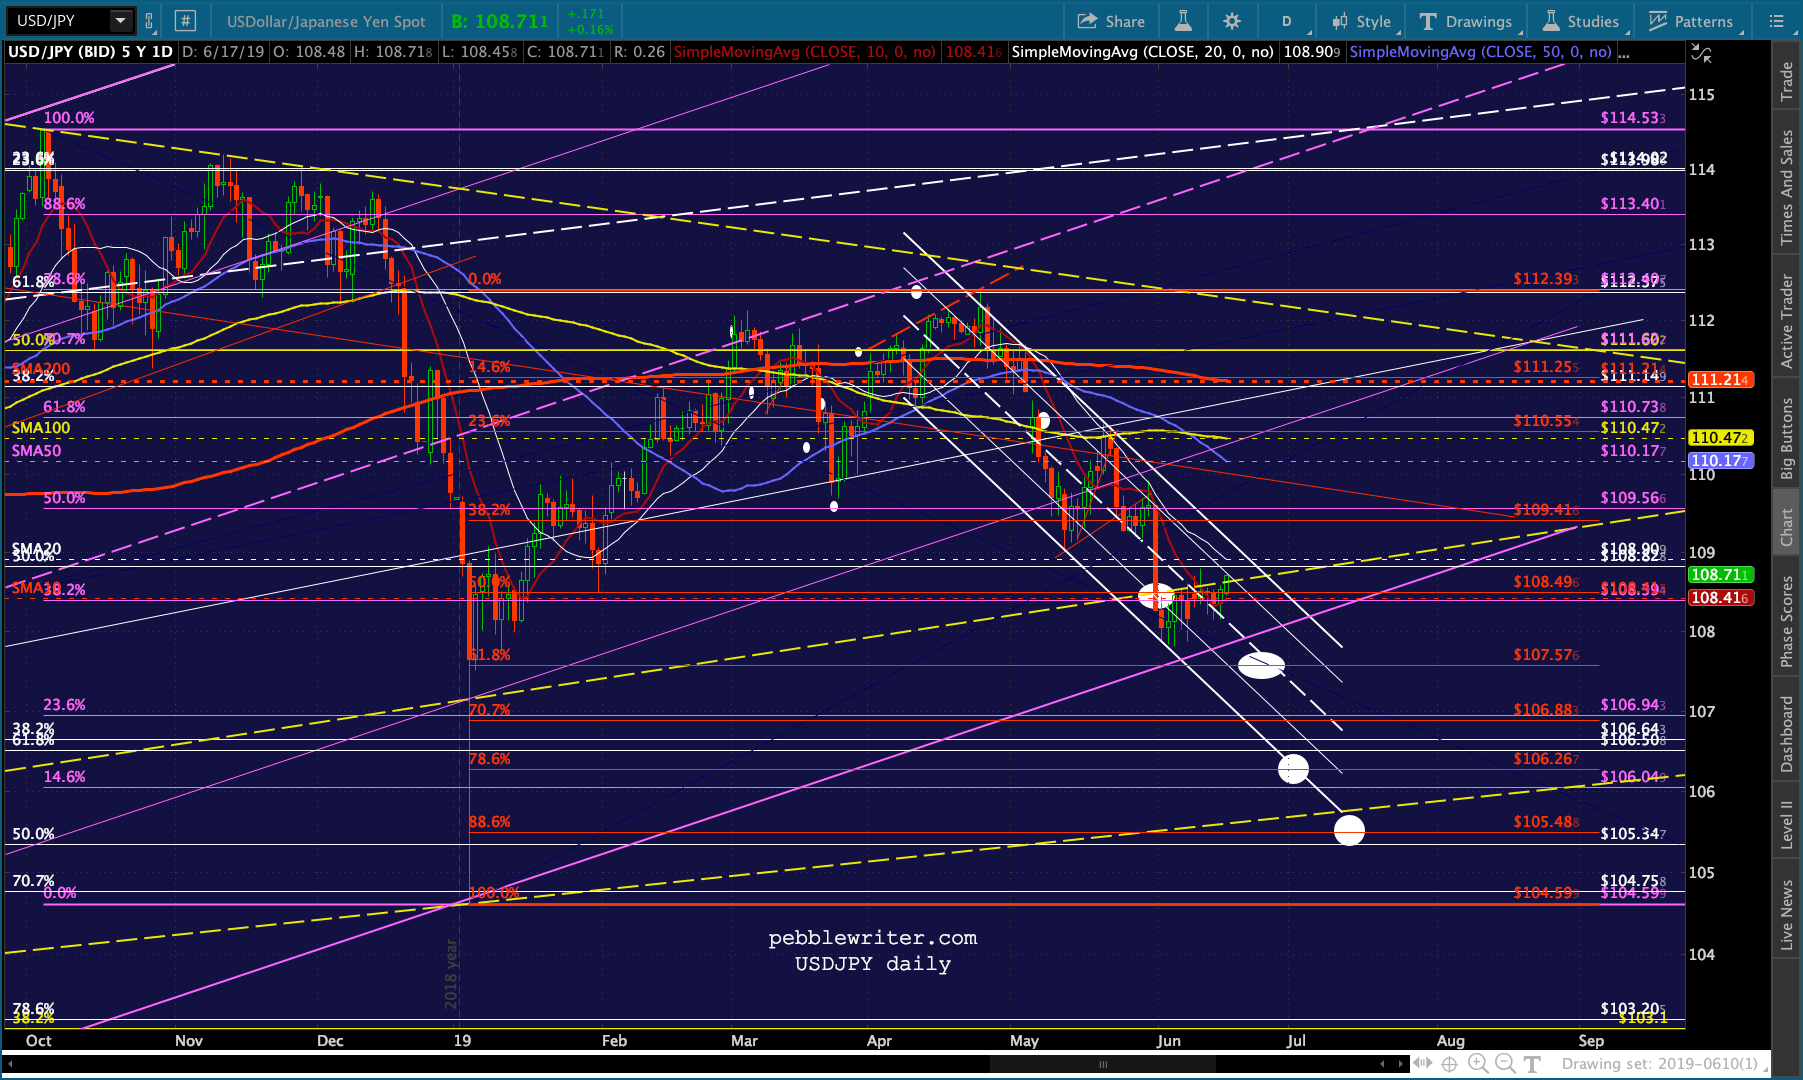
 Currencies continue to go sideways, with DXY continuing to slip slightly higher after finally tagging the channel bottom.
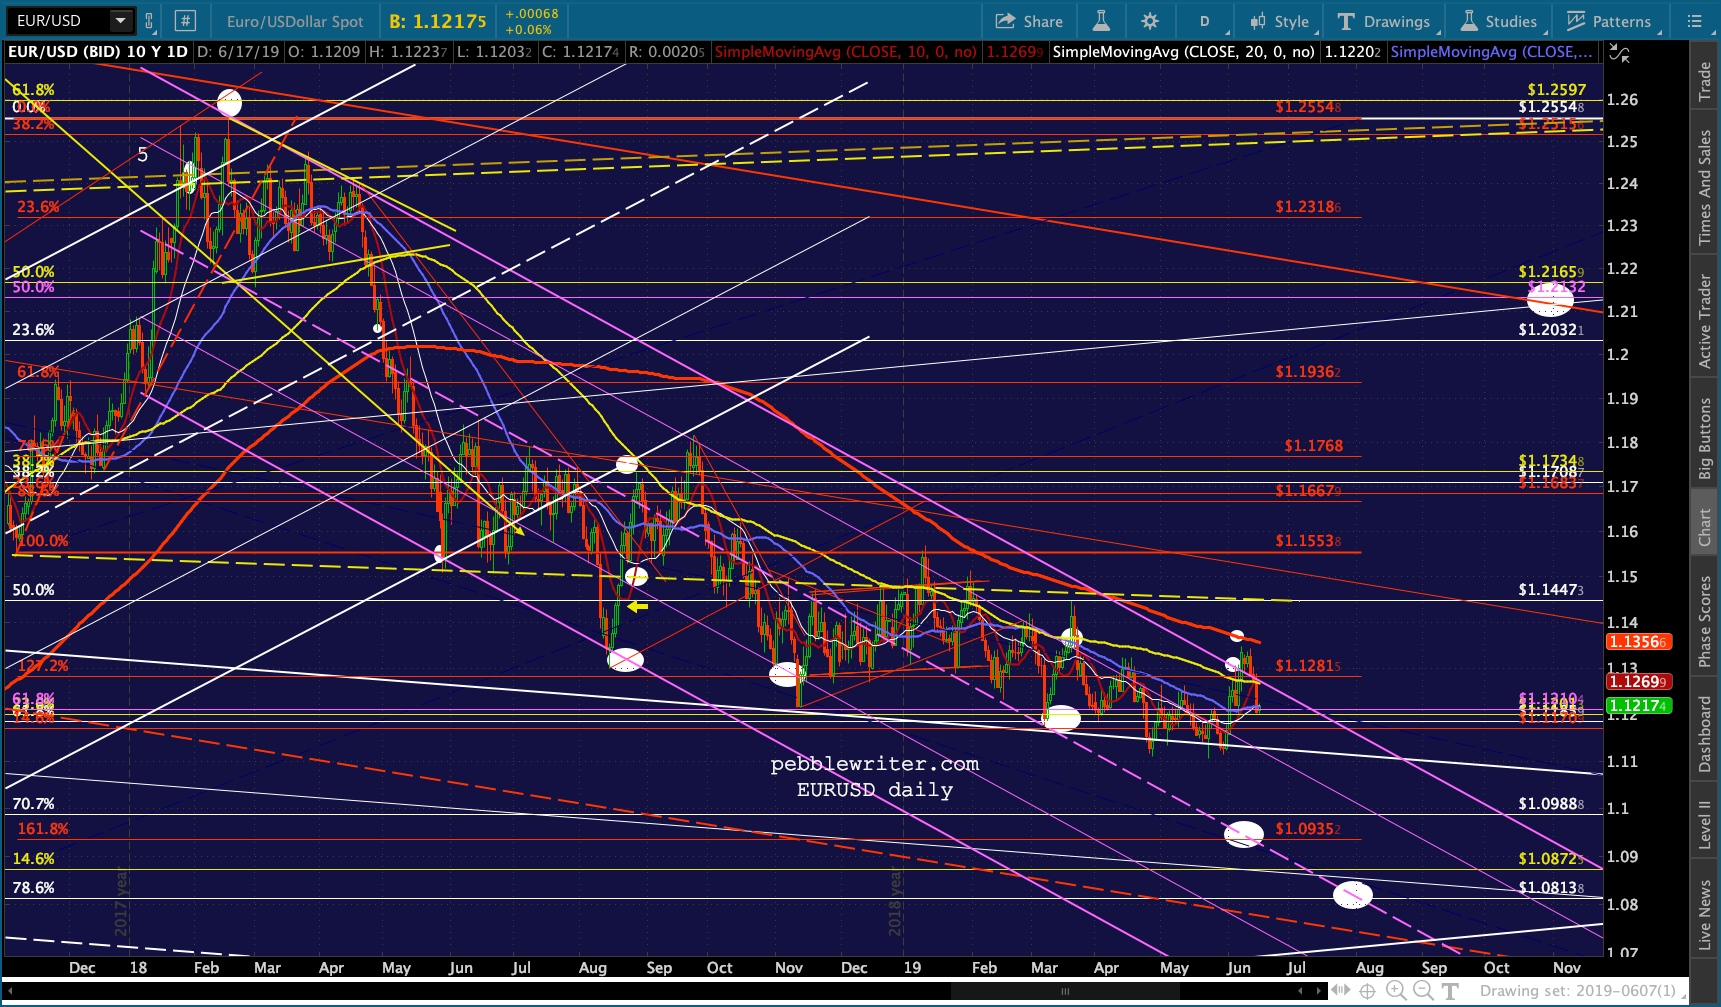
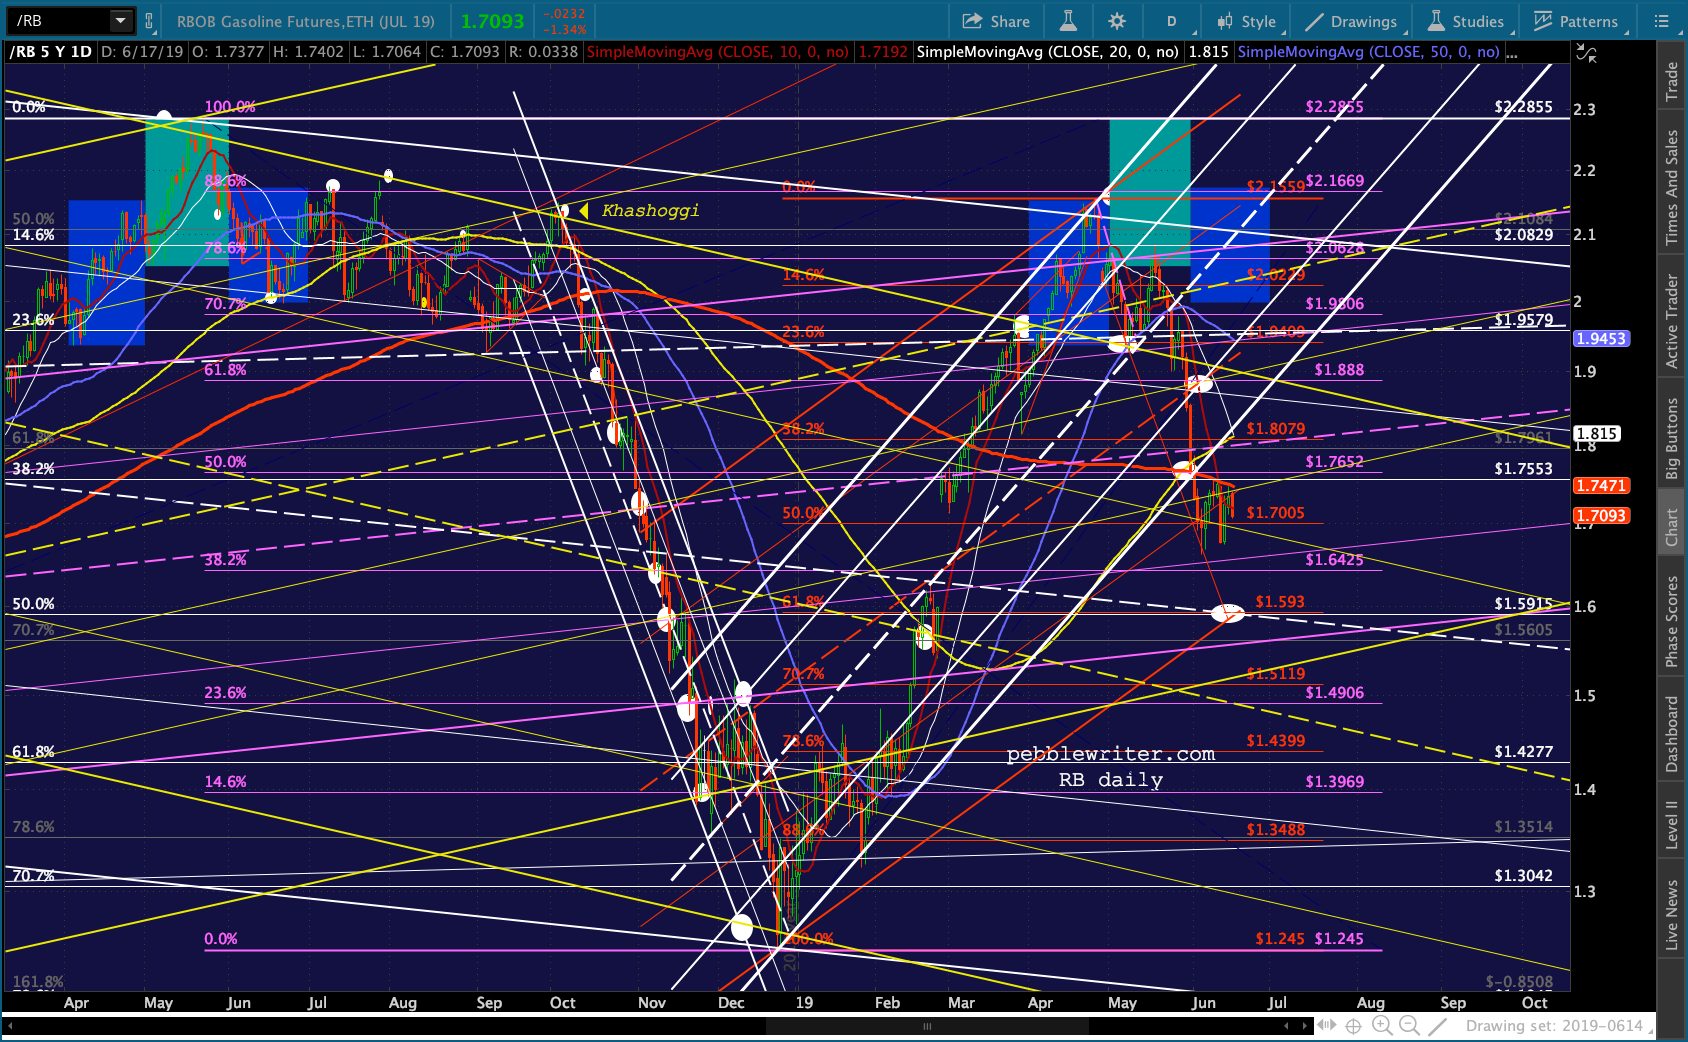
 I remain bearish on oil and gas and believe they are still poised for another downward leg.