

We’ve only done five analogs over the years. One worked out spectacularly, three were fairly accurate, and one just plain fizzled.  Ideally, an analog provides exceptionally accurate forecasts of a very significant move. I think this could be one of those and that stocks are on the cusp of the biggest drop since the Great Financial Crisis.
For more on analogs, click here.
continued for members…First, the morning round-up…
Yields continue to get a bounce, which most observers are heralding as positive. 
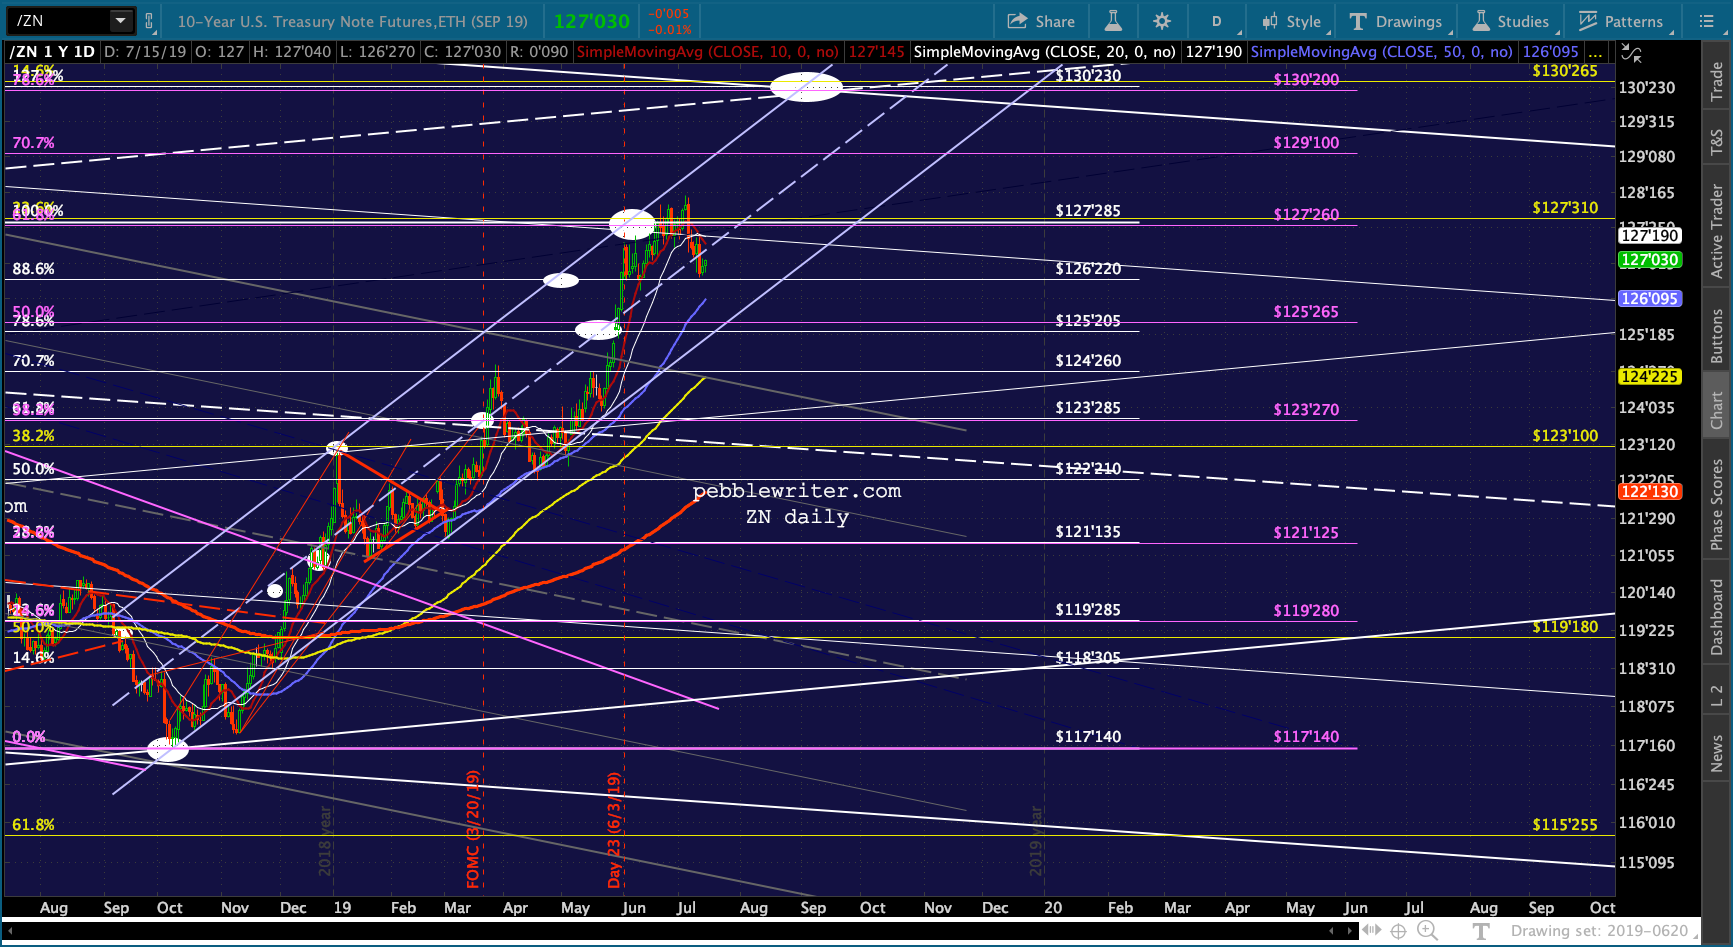 But, as we’ve seen, this could signal a breakout in the 2s10s, which would be bearish for stocks.
 Although oil is still signaling a potential breakout…
 …RB has clearly broken down.
 VIX continues to facilitate the meltup.
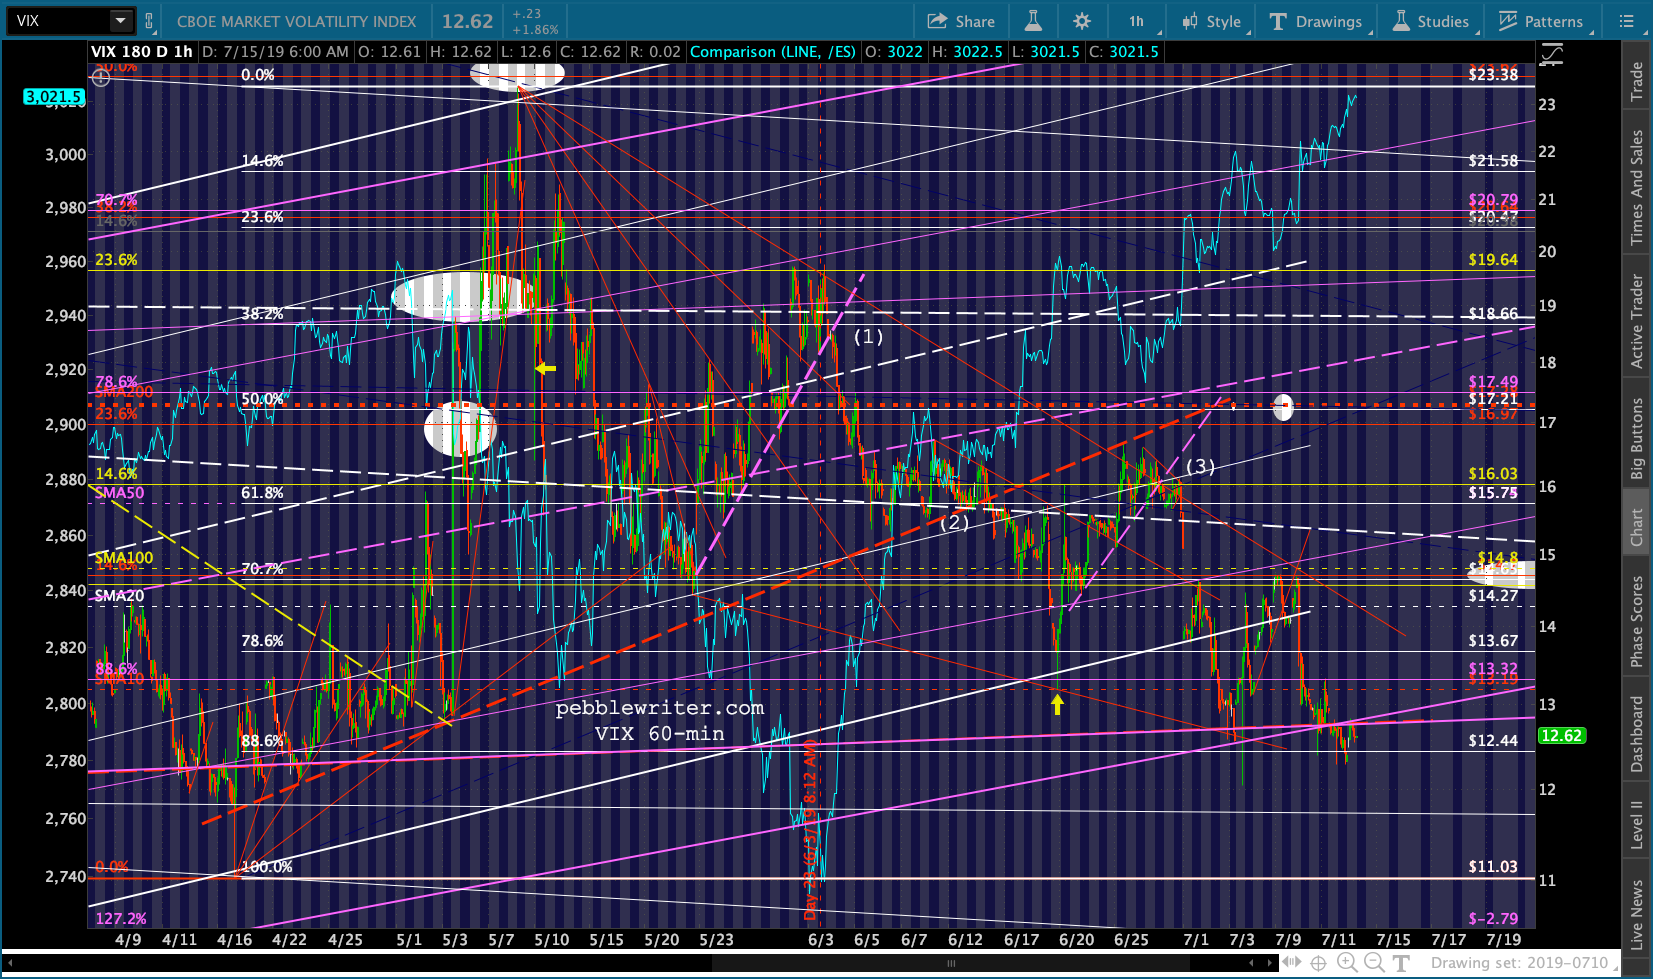 Though, AAPL has yet to break out…
 …and BA is coming under renewed pressure.

 The currency picture is leaning toward bearish, with last week’s breakout of the USDJPY not expected to hold…
…and, DXY backing off the channel rejoin. The clean version of ES…

 SPX’s 60-min chart with the 3047.34 2.618 extension target…
 As we discussed last week, there is no guarantee that we’ll reach 3047.34 exactly. SPX is less than 1% away.
As I touched on last week, the analog I’m watching is 2019 as a repeat of the 2015 top. There is ample fundamental support for the idea of the market topping: an earnings slowdown, global economic weakness, trade wars, a huge bond bubble, narrowing leadership in stocks, elevated multiples, inverted yield curve, etc.
I have also felt there was a political argument for a downturn over the next 16 months. While the market has performed well under Trump, I believe the folks who actually run the country — even those who are philosophically aligned with Trump — are uncomfortable having a loose cannon in the White House.
The best way to ensure he leaves after one term is to run the market back down to where it was when he was elected: the 1.618 Fib extension at 2138. It was never properly backtested — despite two significant opportunities which would have been too soon — and a long-term channel rises through it in late 2020.
I’ll spend the next few hours sketching out the turning points. For now, I show it ending at 2138 around May 6, 2020 with scads of spikes and dips along the way.
UPDATE: 4:50 PM
Here’s the first pass at it. There’s a lot that’s wrong with this iteration, but it’s mostly an attempt to get the turning points in the right place. The 2011 analog probably took about 20 iterations before I was comfortable with the forecast, so don’t put a lot of stock in this any time soon. The important thing is it calls for a top around July 30 at or near 3047.34.  Obviously, the 2.618 extension for SPX at 3047.34 (33 points away) is well below the 2.618 for ES — which is way up at 3076.93 – almost 60 points away. Will need to reconcile that and many other things along the way.
Again, when we’re only 1% away, it could turn at any time and may indeed have turned already. I’d be very comfortable being short here at 3017.
Remember, in January 2018 SPX overshot the 2.24 Fib at 2703.62 by 169 points (6%.) The same thing could obviously happen again. But, odds are it’ll reverse short of 3047 as it has with every other important Fib level since the .618 at SPX 1228.
One other thing…if the primary purpose is to ensure a new president, there are many things that can change the plan. Trump could resign, be impeached, or suffer a massive coronary and a more easily managed President Pence take over. His numbers could also be so bad by the time SPX hits 2703 that there’s no impetus for another 600 point drop.  We could be at war with Iran and the market goes nuts in its own time. We could have another financial crisis when DB and its $43 trillion in derivatives implode. As the chart below shows, things could get much worse than our analog currently indicates.
 Stay tuned.
* * *
FYI, I will be out of the office Tuesday through Thursday of this week. I’ll post a quick summary in the morning when possible and if anything major occurs.