

Since the top came two sessions earlier and 0.6% lower than our original forecast called for, I’ve spent the weekend adjusting the price and timing targets for the next 9 months. If it continues to play out as it has so far, the total drop will be greater than anything we’ve seen since the GFC.
It will feature 9 peak-to-trough moves of over 10%, 3 of which will exceed 20%. I’ve mapped out 23 significant turning points which average almost 300 points each. In short, it will be a trader’s market. It will test the resolve of buy-and-hold investors and trash the returns of momentum investors.
Buckle up.
continued for members…Here’s the revised path of the 2019 as 2015-16 analog. The next turning point is currently set for SPX 2856 around Aug 14.
 I’m working on two other potential paths, but this one is fairly precise. As I’ve stated before, there are any number of events which could throw it off course. We won’t know for sure until we get our first significant bounce — which usually helps confirm timing and the extent of the total potential drop. So, as always, use stops and don’t get out over your skis — especially in dealing with weekends and holidays.
Before continuing, I’d like to make one request of all members. This site doesn’t generate huge piles of money for yours truly. Institutional clients who pay by the month or hour generate the lion’s share of fees.
I maintain the site primarily out of loyalty to the many subscribers who have been with me through thick and thin over the years. You are the ones who made it possible for me to pursue and maintain a premium website.
Having said that, the website takes up a significant amount of my time and resources. I ask, therefore, that members refrain from sharing charts and forecasts with those who are not subscribers.
If you have a friend or colleague who would benefit from the information I post, suggest they get a membership of their own. For the past few months, I’ve been offering half-off the initial month of a monthly membership. For only $79, they can get started and find out if the site suits their needs. If they like what they see, they can even apply that amount toward a quarterly membership.
The forecasts I make are very often quite contrary to those of mainstream analysts. From time to time, I see my charts reproduced on the blogs of other analysts’ — some of whom put a lot more effort into marketing to the masses and therefore have large followings. If the information becomes widespread, it can even alter the path markets might otherwise follow — meaning it could have less value to you, our members.
Also, when members share log-in credentials, the extra traffic on the site can cause it to become sluggish — again, diminishing the value to paying members.
This is the link to sign up for new memberships: https://pebblewriter.com/membership/sign-me-up/
Okay, with that out of the way…
I have slightly modified the oil and gas charts to comport with SPX’s.

 Likewise, for USDJPY:
 VIX is the other important chart to revise. Here’s a reminder of the big picture:
 Note that VIX hasn’t ever reached the .618 retrace of the 2008 highs. Though, it came pretty close in Aug 2015 — SPX’s initial plunge during the 2015-2016 correction — especially if we use the then existing lows seen in 2013 or 2014.
Ignore the rising purple channel. It’s just there for me to try to make sense of the upside potential. The more important channels are the falling ones, such as the large falling white channel dating from the 2008 highs and the much smaller one dating back to the 2018 highs. It’s easier to see on the daily chart below.
 A year ago, we saw VIX get out of control. So, I’m leery to put specific price targets on it. I’ve labeled highs and lows (for VIX, not SPX) on the chart below and have tossed some plausible price targets which might work. Once we get a sense of whether the time and price scale we can probably work up some more precise targets.
With VIX being as volatile as it is, the timing alone should help traders take positions that, if the analog holds together, will pay off.  UPDATE: 2:42 PM
SPX just dropped through the .618 at 2843.09 — putting it slightly below the Aug 14 target. At this point, stocks are being driven more by VIX making a new cycle high and DJIA’s impending tag of its SMA200. In other words, there’s a good chance of a bounce soon.


 A few individual stocks from this morning’s analysis…


 And, a quick glance at gold — almost to the .500 Fib at 1484.60, with a secondary target of 1495.
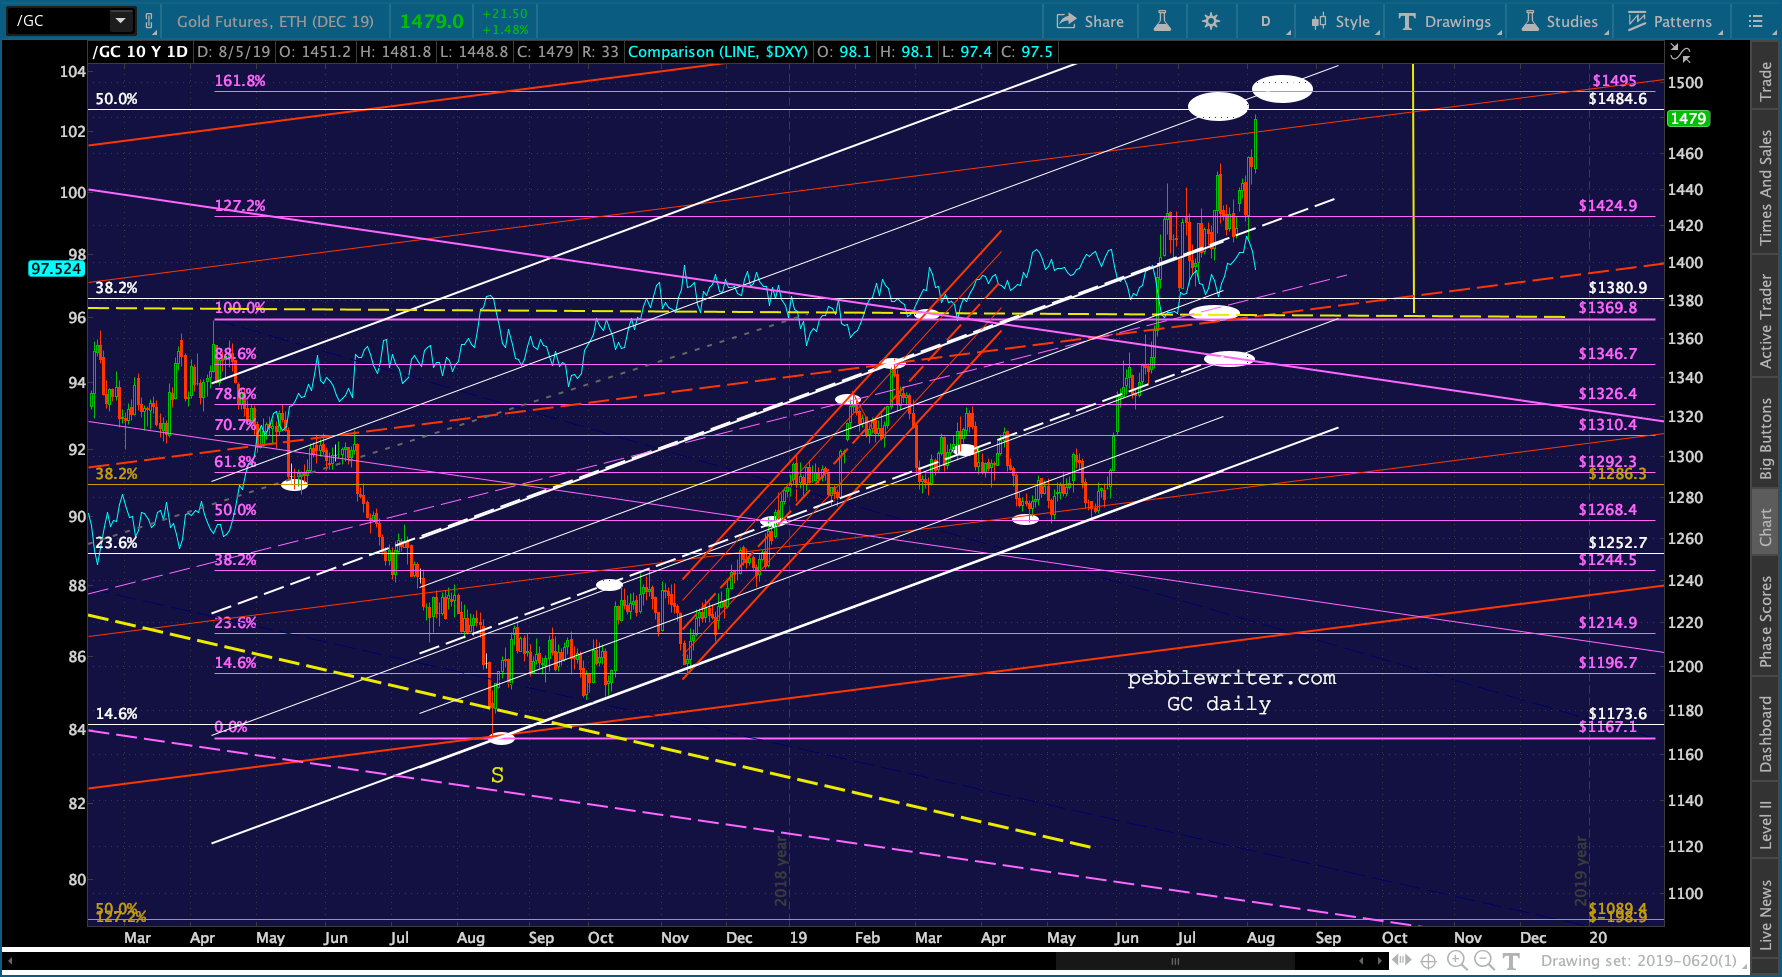 UPDATE: 3:06 PM
DJIA’s SMA200…

 UPDATE: 10:20 PM
SPX closed just above the Aug 14 target of 2843.09, though it pushed as low as 2822 intraday. That would be well and good, but after hours ES pushed all the way down to and through its SMA200 at 2791. Even though it recovered much of the losses, it still suggests new lows for SPX tomorrow.
The only problem with all of that is that SPX has already exceeded the lows suggested by our analog. At today’s lows, SPX had shed 6.77% since the Jul 26 highs six sessions ago. This is greater than the losses suffered during the first 6 sessions of the 2000, 2007, 2010, 2011 and 2015 tops. The only top wherein SPX fell more than 6.8% was in Jan 2018 when it tumbled 8.2% in the first 6 sessions.
My analog targets are based on the percentage of the expected move from top to bottom (i.e. 3027.98 to 2138.04.) I’m open to the idea of the analog being on a different scale than the 2015 top. I should also point out that the timing of the reversals is more important than the price levels. It’s early — only 6 sessions into a 192-session process. So, we’ll have to see how the next week or so shakes out.
As of right now, it appears likely SPX will follow suit in the morning and tag its SMA200, now at 2790.39. In so doing, it would tag the bottom of the rising white channel — a perfectly logical turning point. I’d rather see this occur on the 14th, but we’ll see how it plays out.


UPDATE: 6:00 AM
Our analog was rescued by the futures last night. That 50-pt decline that dipped below the SMA200 has turned into a 25 point gain, which should be enough to put a bounce in SPX’s step and should be enough to get it back on track for a low on the 14th and a bounce into the 16th.
As stated before, it’s still early. The important thing for our analog at this stage is to stay on track from a timing standpoint.
 BTW, the question came up last night about the drawings on the SPX analog chart. The light purple lines represent the path I forecast SPX will take over the next 9 months if the analog holds.
The little white dots are the exact price levels suggested by the model based on percentage retracement between the cycle high 3027.98 and the expected low (2138.04) in May 2020. The percentage retracements for each peak/valley is based on the actions during the 2015-16 correction – the current model for our analog.
In some cases, the forecast analog path and the white dots are not the same. This is because some of the peaks/valleys aren’t quite at a natural turning point such as a channel top, a typical Fib level, etc. In these cases, I’ve tweaked the model just a bit to reflect what I think is a more logical turning point.
An example is the Aug 14 low. The model suggested 2856.42. But, I felt a turn at the red .618 would be more logical and drew the analog path to reflect that level, leaving the white dot as a reference for how well the model is working.
 More in the Aug 6 post.