Year: 2018

  • Update on Oil & Gas: Nov 25, 2018

    In our Nov 9 Update on Oil and Gas, I reiterated the importance of the support that had just been reached.

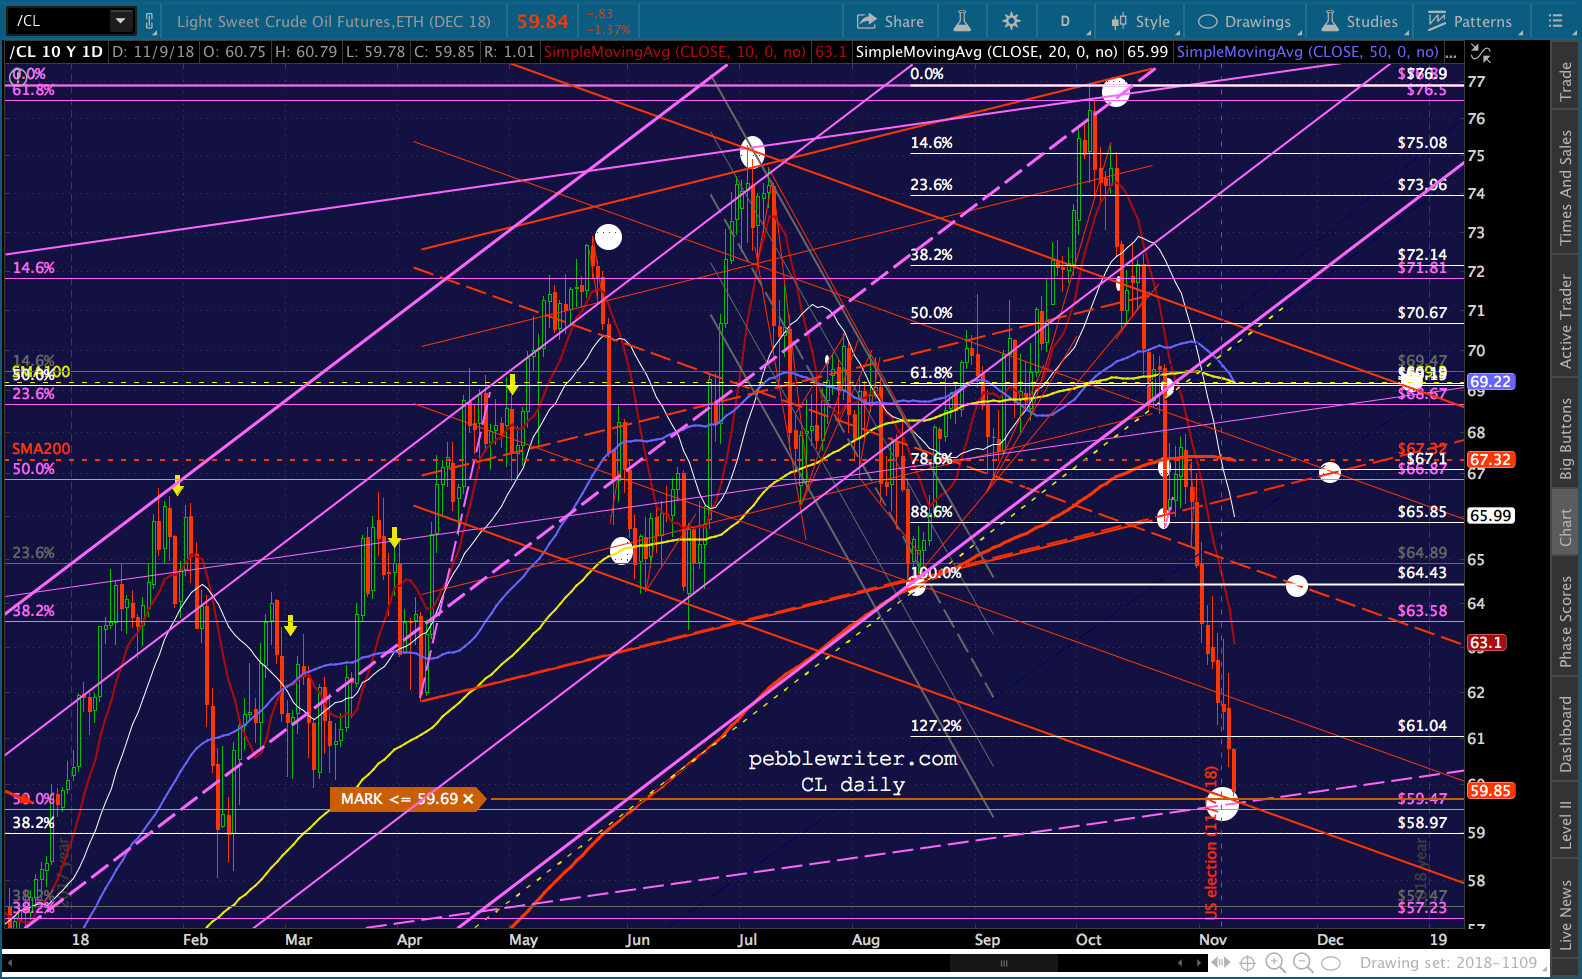
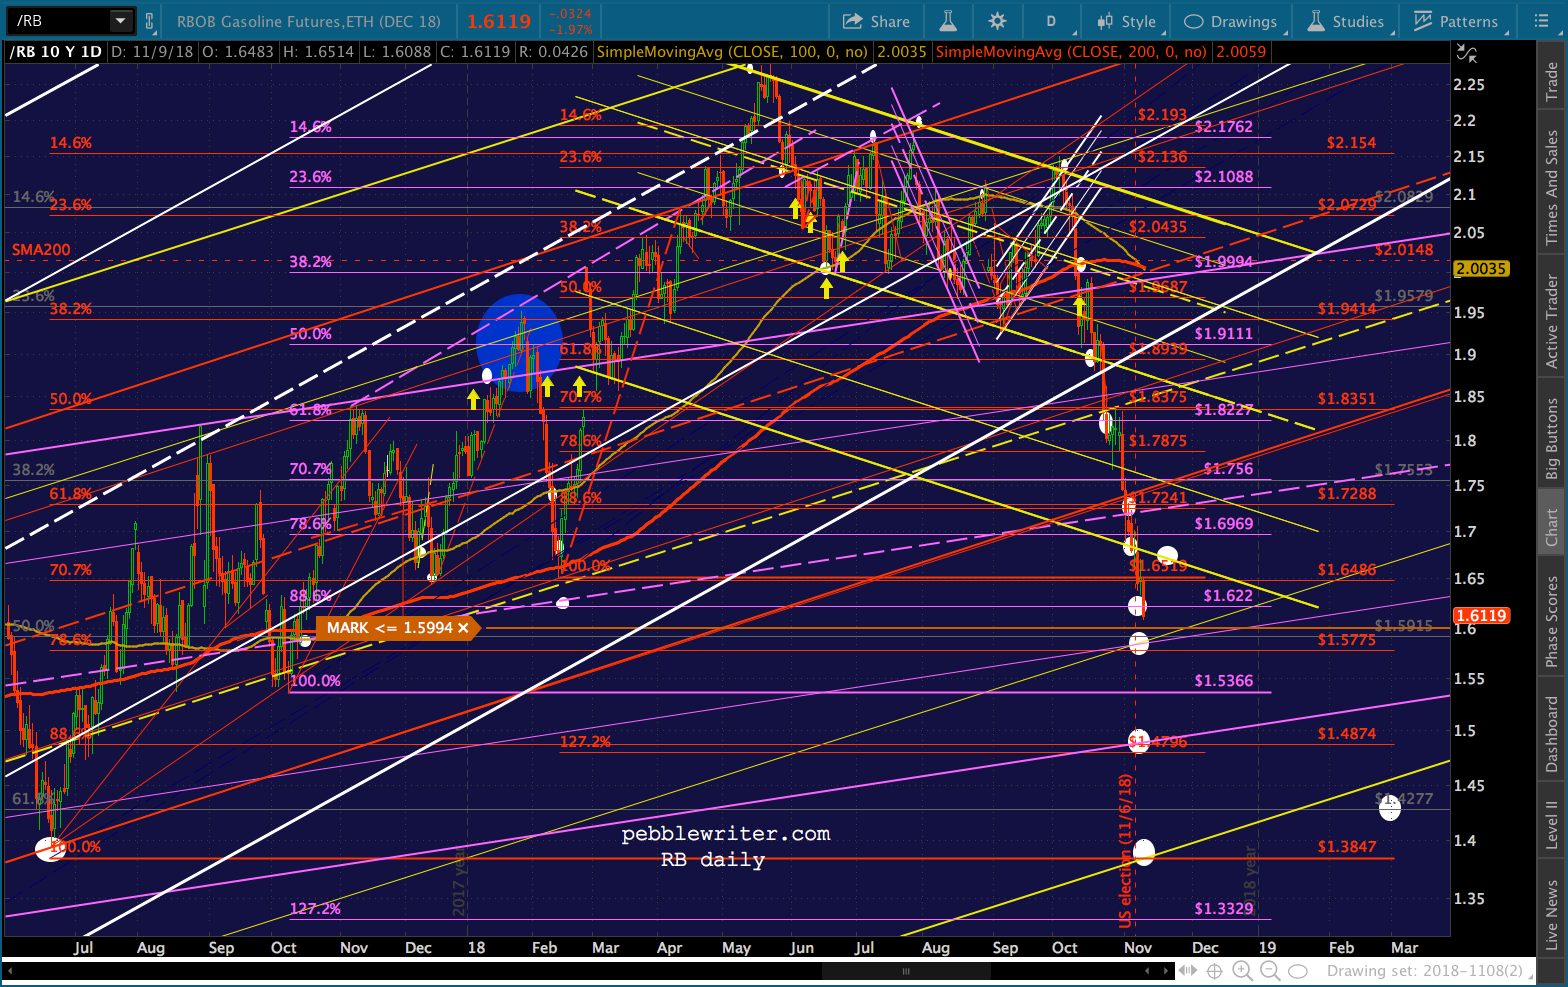
    CL just reached our next downside target of 59.47 and RB has reached our target range of 1.58-1.62. This is important support for both which, if broken, would portend much more downside.…the charts show [RB] could really benefit from tagging 1.58ish. There, it would enjoy not only red .786 Fib support, but channel line support as well. If that support doesn’t hold, there isn’t much help until the purple channel bottom at 1.48, followed by the previous low and yellow channel bottom at 1.3847.

    Virtually all analysts have fixated on supply and demand, shifting geopolitical currents and OPEC’s end game. But, for many months, I have remained steadfastly focused on Trump’s primary objective: lowering gas prices to a level which would (1) favor incumbents in the midterms, and; (2) reduce inflation enough to stave off any further FOMC rate hikes.

    Surprisingly, Trump substantiated my long-held theory when he took credit for having lowered oil and gas prices as discussed in Trump: “Falling oil prices…that was me”

    “If you look at oil prices they’ve come down very substantially over the last couple of months,” Trump said. “That’s because of me. Because you have a monopoly called OPEC, and I don’t like that monopoly.”

    That tweet barely touches on the drama has played out predictably in the background.  It began with the murder of journalist Jamal Khashoggi at the apparent direction of Saudi Crown Prince Mohammed bin Salman.  Trump and Co. adeptly leveraged the situation to get oil and gas prices down [see: Coincidences and Consequences.]

    Both MBS and Trump are now being schooled by Turkish President Recep Erdoğan who is angling to use proof of MBS’ involvement to force the return of Turkish dissident and supposed coup ringleader Fethullah Gülen (and, likely, other unnamed concessions.)

    The upshot of all this drama is that RB reached 1.3847 on Friday, just in time for the final BLS energy price input which will drive November’s CPI number and could conceivably make it more difficult for the Fed to follow through on its widely expected December rate hike.

    This brings our gain on shorting RB on Oct 3 to 34.7% and the YTD gain to 168%.  Our short CL position has gained 33.4% since Oct 3 and 167% YTD.

    Everybody wins, except of course for Khashoggi, Gülen and the dozen or so Saudi operatives who will lose their heads for having followed MBS’ orders.

    continued for members(more…)

  • Trump: I Take it All Back

    It’s gratifying when a model plays out nicely as this one has.  But, just a reminder, it’s not over just yet.  There are plenty of ways it could go sideways.  CL and RB could continue falling after reaching our next downside targets, which could drive ES/SPX lower than our H&S targets.

    From last week’s Trump: “Falling Oil Prices…That Was Me:”And, ES this morning…

    We’re now seeing the unintended consequences of Trump’s mini-crash in oil prices.  Not a great mystery — though attaching his name to it might not have been the smartest move.  As stocks continue to fall, however, look for the Fed to shoulder more and more blame.

    Tie in the strong decline suggested by our yield curve model, and this was not a terribly difficult forecast.  The tricky part lies ahead: what will COMP do when it reaches our 6730 target from Oct 12 [see: Are We There Yet?]

    Then……and, now.

    continued for members…
    (more…)

  • Charts I’m Watching: Nov 19, 2018

    Our forecast remains unchanged from last week — a very sharp drop this week, followed by a deeper drop the next.  Needless to say, this goes against the grain.

    Holidays are usually all about senseless melt-ups.  So, I’ll look especially foolish or brilliant in the next week or so.  As always, use appropriate stops.We should get the next legs lower from RB, CL and USDJPY.  And, VIX is likely to at least test the fan line from the February highs — think 26.50ish, depending on the timing.  If it breaks that, things could get quite messy.continued for members(more…)

  • FAANGs: Now or Never

    Interesting pause here at support.  If a model I’m watching plays out, next week could be ugly.  On the other hand…think of all the times we’ve seen a meltup during a low-volume holiday week.

    There are a few tells, as long as they’re not head-fakes.  We’ll start with USDJPY, which has done absolutely nothing to support stocks lately.  It’s clearly headed for 112.71.  If it were to drop through to the SMA100 or SMA200, we could see some ugly fallout.Then, there are all the FAANG stocks – each one of which is either in trouble or about to be.

    First, GOOGL recently broke down from a 10-year rising wedge.Yesterday, it experienced a death cross… …the first one since June 2016.  Being GOOGL, it bottomed the very next day.

    continued for members(more…)

  • Powell: Slowing Global Growth

    One glance at the Philadelphia Fed Index this morning, and you could find yourself wondering whether Powell was really talking about the “rest” of the world.Yet, the Fed supposedly remains hawkish.  Never mind that the 10Y and the yield curve are telling us the rate hikes are drawing to a close. continued for members(more…)

  • When Push Comes to Shove

    The big story yesterday was oil and gas, which have now fallen about 29% since our short call on Oct 23 [see: VIX Takes the Plunge.]  Importantly, the decline has occurred without decimating stocks.  And, the impact on November’s CPI – due out on Dec 12 – will be significant.

    Will it matter to the FOMC, which is widely expected to hike rates on Dec 19?  PCE is due out on Dec 22.  I can only imagine the onslaught of tweets from the White House if CPI comes in at 2.1% and the Fed hiked anyway…

    In any case, SPX is at a very interesting place right now.  A continuation of the drop would complete a H&S Pattern that targets 2250.  A reversal and new highs from here would complete an IH&S that targets 3035.

    So far, oil and gas have been a drag on stocks.  USDJPY and VIX have been conspicuously non-committal.  What say you, BoJ?  Are you ready to sacrifice a few thousand points on the NKD for the sake of market integrity?

    continued for members(more…)

  • AAPL Discovers Gravity

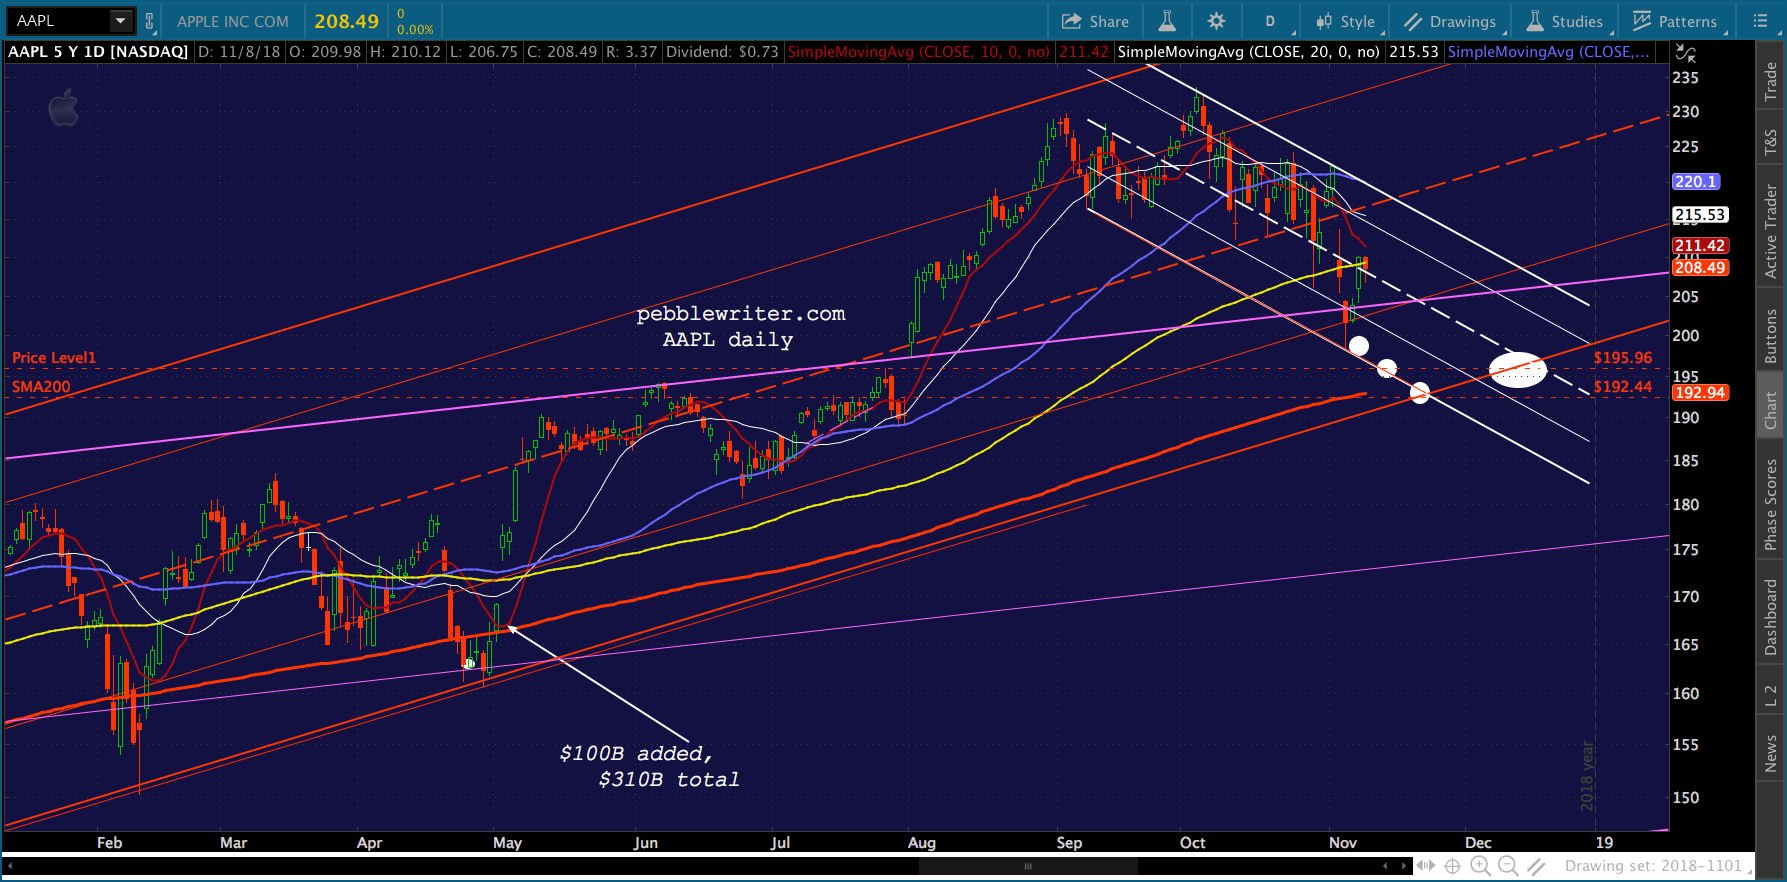
    A quick update on AAPL, which has reached two of our downside targets today…

    As we discussed prior to AAPL’s earnings report [see: All Eyes on AAPL] the stock had a gap to close and 200 DMA to backtest.  The danger in reaching both targets was that AAPL would have to descend below the triangle top above which it broke out in August [see: Focus on the FAANGs.]  But, as we discussed, this wouldn’t necessarily be all that alarming.

    A drop to 200 or so wouldn’t do much to dent bulls’ enthusiasm. Even a drop to the SMA200, currently at 192.17, could be passed off as a base-building exercise.

    It’s been almost two weeks since AAPL posted earnings, and it just reached its SMA200, (one day after closing the gap) posting a low today of 191.45 — an 18% drop from its Oct 3 highs.  Needless to say, some bulls are getting nervous.

    A quick glance at the weekly chart shows why.  If the rising red channel from 2016 doesn’t hold, it’s quite a ways to the first serious support down at the purple channel midline.  Maybe it’s time to expand the company’s stock repurchase plan.Don’t own any AAPL? Wondering why you should care?  Drops through AAPL’s 200-DMA have been a trap door to some big swoons for the overall market.

    With our yield curve model and oil/gas charts screaming “short!” I’d give better than even odds that AAPL’s channel and the overall market are headed lower.  If AAPL closes below its SMA200, I’d say it almost certain.Stay tuned.

    UPDATE:  Nov 14, 2018 – 3:45 PM

    AAPL closed below its SMA200 and its red channel is failing.  As we noted a couple of weeks ago, the nearest significant support is now the .618 Fib at 144.48. (more…)
  • An Oldie but a Goodie

    I turned on CNBC this morning just to see what the “experts” are saying. Basically, they’re all over the map – trying to explain how the fundamentals indicate various outcomes.

    Thankfully, our charts offer a clear path to SPX’s next downside objective: the 2.24 extension at 2703.62.  Yes, again.But, if our yield curve model works as well as it has in the past, we could see a much bigger drop than that.  We first explored this model last February [see: Does the Yield Curve Matter? A Closer Look.]

    Since then, it has facilitated many accurate forecasts.  Right now, it’s suggesting even more downside.If CL and RB (which just officially tagged our 1.5915 target overnight) fall any further, SPX could be in for quite another tumble.continued for members(more…)

  • Charts I’m Watching: Nov 12, 2018

    ES reached our next downside target on Friday, though SPX came up a few pennies short.  The more interesting story is oil and gas, which — after tagging our downside targets on Friday — are both up nicely on reports of an OPEC production cutback. Will it be enough or in time to prop up stocks?

    continued for members(more…)

  • Update on Oil & Gas: Nov 9, 2018

    CL just reached our next downside target of 59.47…

    …and, RB has reached our target range of 1.58-1.62.  This is important support for both which, if broken, would portend much more downside.

    This completes a nearly 23% gain for CL and a 25% gain for RB since our Oct 3 top call [see: VIX Takes the Plunge] and brings our YTD gains to 155% for CL and 158% for RB.

    As we detailed yesterday, this move was as much about politics and chart patterns as it was about supply and demand [see Trump: Falling oil prices…that was me.”]  Now that the election and the Fed’s latest meeting are over, we can focus on November CPI.  Ultimately, oil and gas’ path forward will decide much about interest rates and broader markets.

    continued for members

    59.47 is the intersection of the rising purple channel midline, the bottom of the falling red channel and the purple .500 Fib line.  If it fails, there are much lower targets that would come into play: the gray .382 at 57.47, the purple .618 at 55.36, the gray .500 at 51.47 and the purple .886 / white .236 / gray .618 at 46.02.Note that CL also came quite close to the white .382 retracement of the drop from 112 to 26 — a typical retracement for a retreat from the .618 at 79.32.

    If it bounces from here, the leading candidates are the previous low and falling red channel midline at 64.43, the SMA200 and rising red channel backtest at 67.1 and the white .618 and red channel top at 69.19. While 59.47 is potentially low enough to get CPI back under control, it should leak a little lower intraday to facilitate RB – which the charts show could really benefit from tagging 1.58ish.  There, it would enjoy not only red .786 Fib support, but channel line support as well.

    If that support doesn’t hold, there isn’t much help until the purple channel bottom at 1.48, followed by the previous low and yellow channel bottom at 1.3847. If RB catches a bid here, we can look for it to backtest the broken yellow channel at 1.67ish, the broken red channel at 1.75ish, and the yellow midline at 1.84ish.Futures are off about 18 points this morning, dropping slightly below the horizontal support at 2800.The drop is being facilitated by oil and gas’ drop, VIX’s manicured rise and USDJPY’s pullback.  So, I continue to expect at least a backtest of the SMA200 (2764.67 and dropping slowly) as the SMA10 rises to meet it over the next day or two. Many of our factors, however, argue for a much larger drop.

    The 2s10s has clearly broken down.And, VIX has bounced nicely off its SMA200.   While the red channel breakdown has aided in the latest equity bounce, previous moves above the SMA200 have produced very sizeable drops in SPX.  The trick for bears would be in getting VIX up past 27ish.And, USDJPY faces yet another important test of overhead resistance.  A failure to punch through (remember, this is a backtest of the broken white channel) would be quite bearish for stocks.For SPX, this translates into at least a backtest of its SMA200, currently at 2763.49.  If they stretch it out till later next week, they can flesh out the rising red channel and backtest the yellow midline at the same time.If I massage ES’s rising channel a bit, next Tuesday looks like a very good possibility.As we’ve seen in many past meltups, backtest opportunities are sometimes ignored in pursuit of “higher at any cost.”  But, by the same token, the past 9 months have seen a few backtests break down and open the door to big plunges.

    Don’t be in a hurry to go long on RB, as it probably has further to go. CL might get a playable bounce, but stops are a very good idea. We don’t know the exact level at which CPI can be brought down to a level acceptable to the pols or, more importantly, the Fed.

    VIX has more upside as long as it holds the little red TL – parallel to the purple one which served us well last month.This remains a time to be cautious.  Only stay short over thefb weekend if you can handle the gap risk.  Our yield curve model says we could be in for considerable downside.  Remember, SPX doesn’t like breakdowns of the rising or horizontal support or breakouts above falling TL resistance.

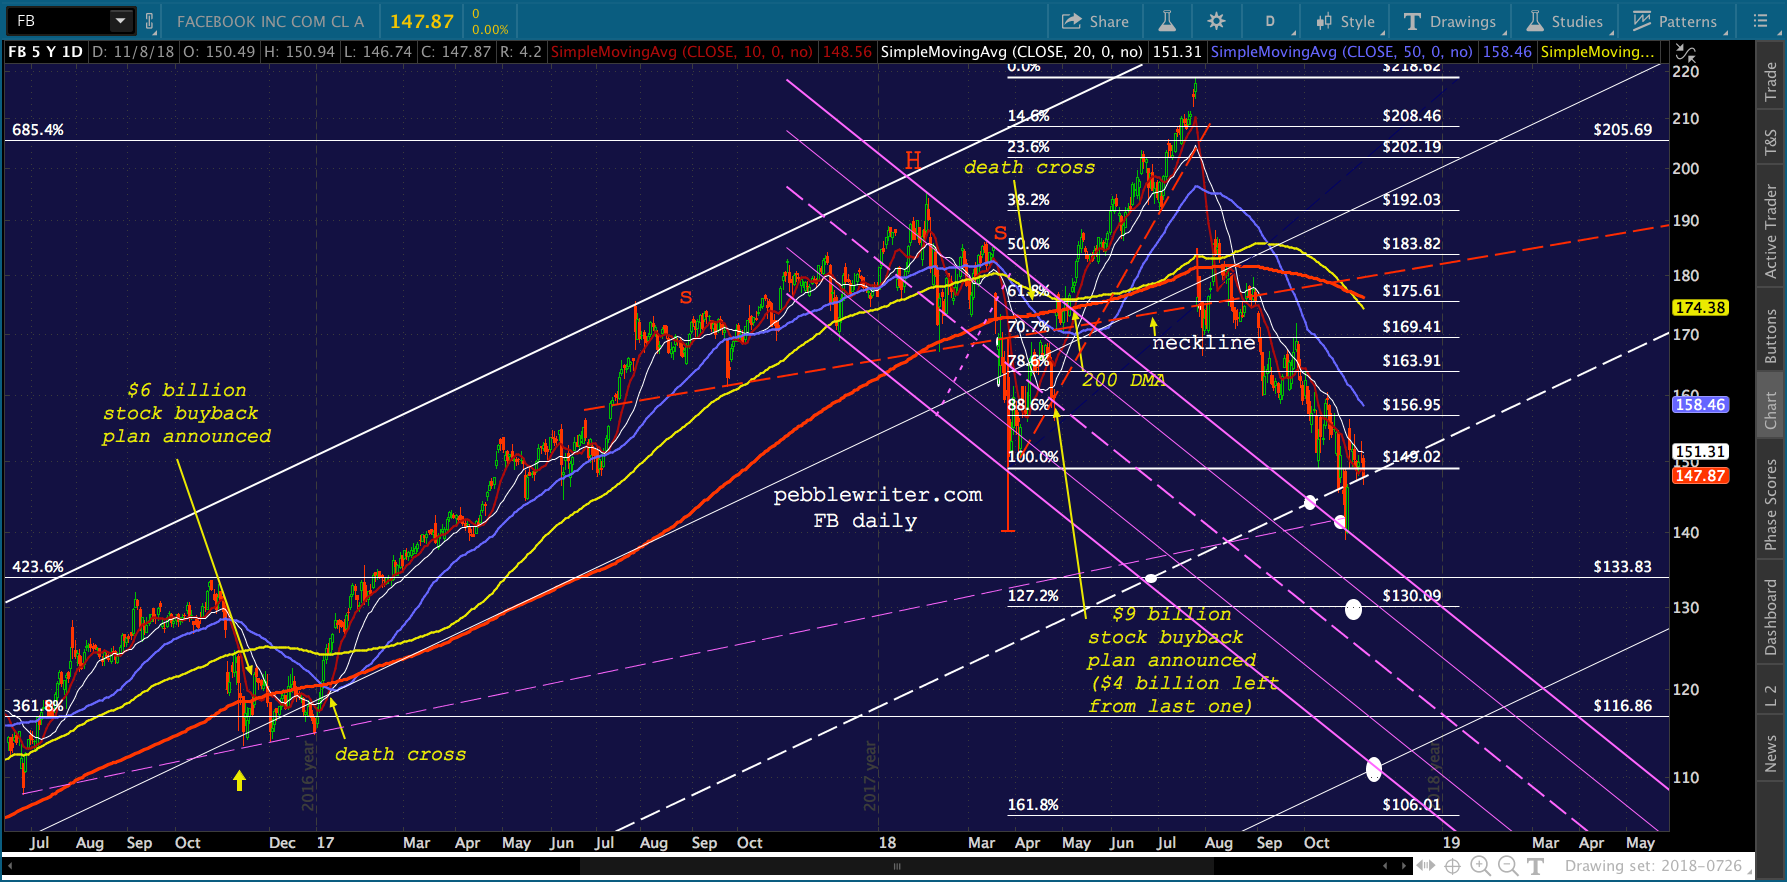
    And, right now, we’re seeing the latest rising yellow TL break down.If COMP doesn’t hold its SMA200… …then, AAPL and FB could easily pace it to a 10% loss. If that should happen, it’s highly unlikely SPX would hold its SMA200!

    I’ve been working some pretty crazy hours lately, so I’m going to get an early start on my weekend.  I plan on taking Monday off, but we’ll see how things go.

    GLTA.