

I turned on CNBC this morning just to see what the “experts” are saying. Basically, they’re all over the map – trying to explain how the fundamentals indicate various outcomes.
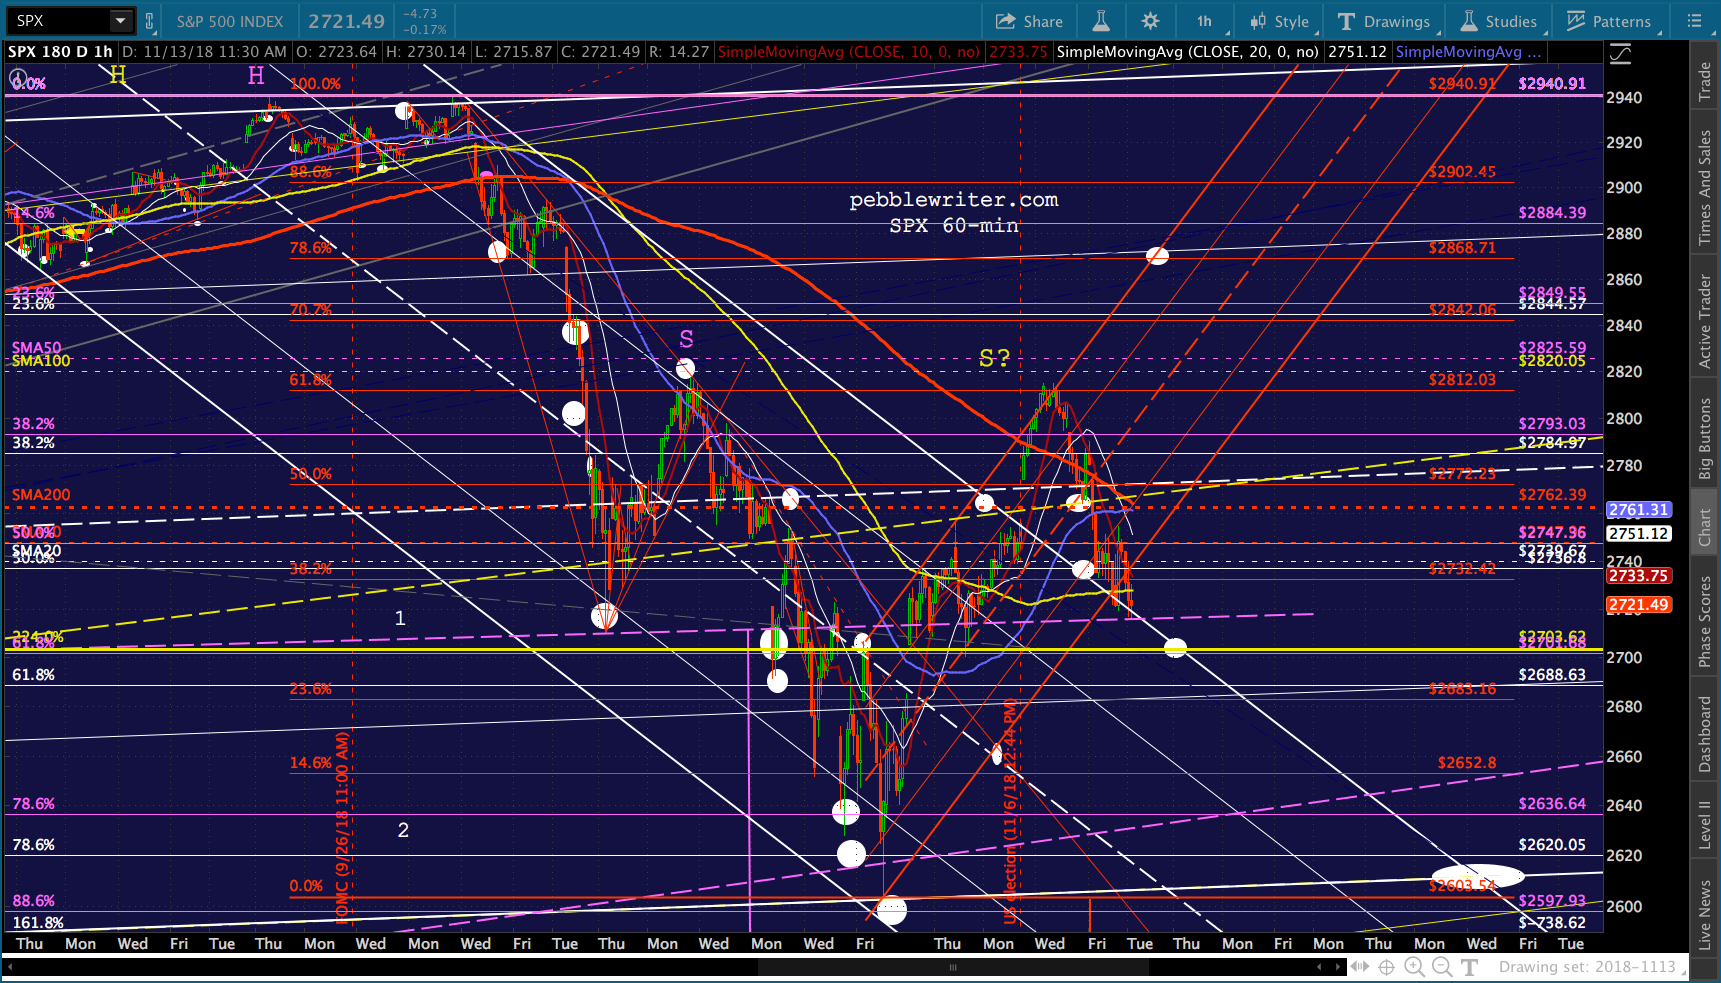
Thankfully, our charts offer a clear path to SPX’s next downside objective: the 2.24 extension at 2703.62. Yes, again. But, if our yield curve model works as well as it has in the past, we could see a much bigger drop than that. We first explored this model last February [see: Does the Yield Curve Matter? A Closer Look.]
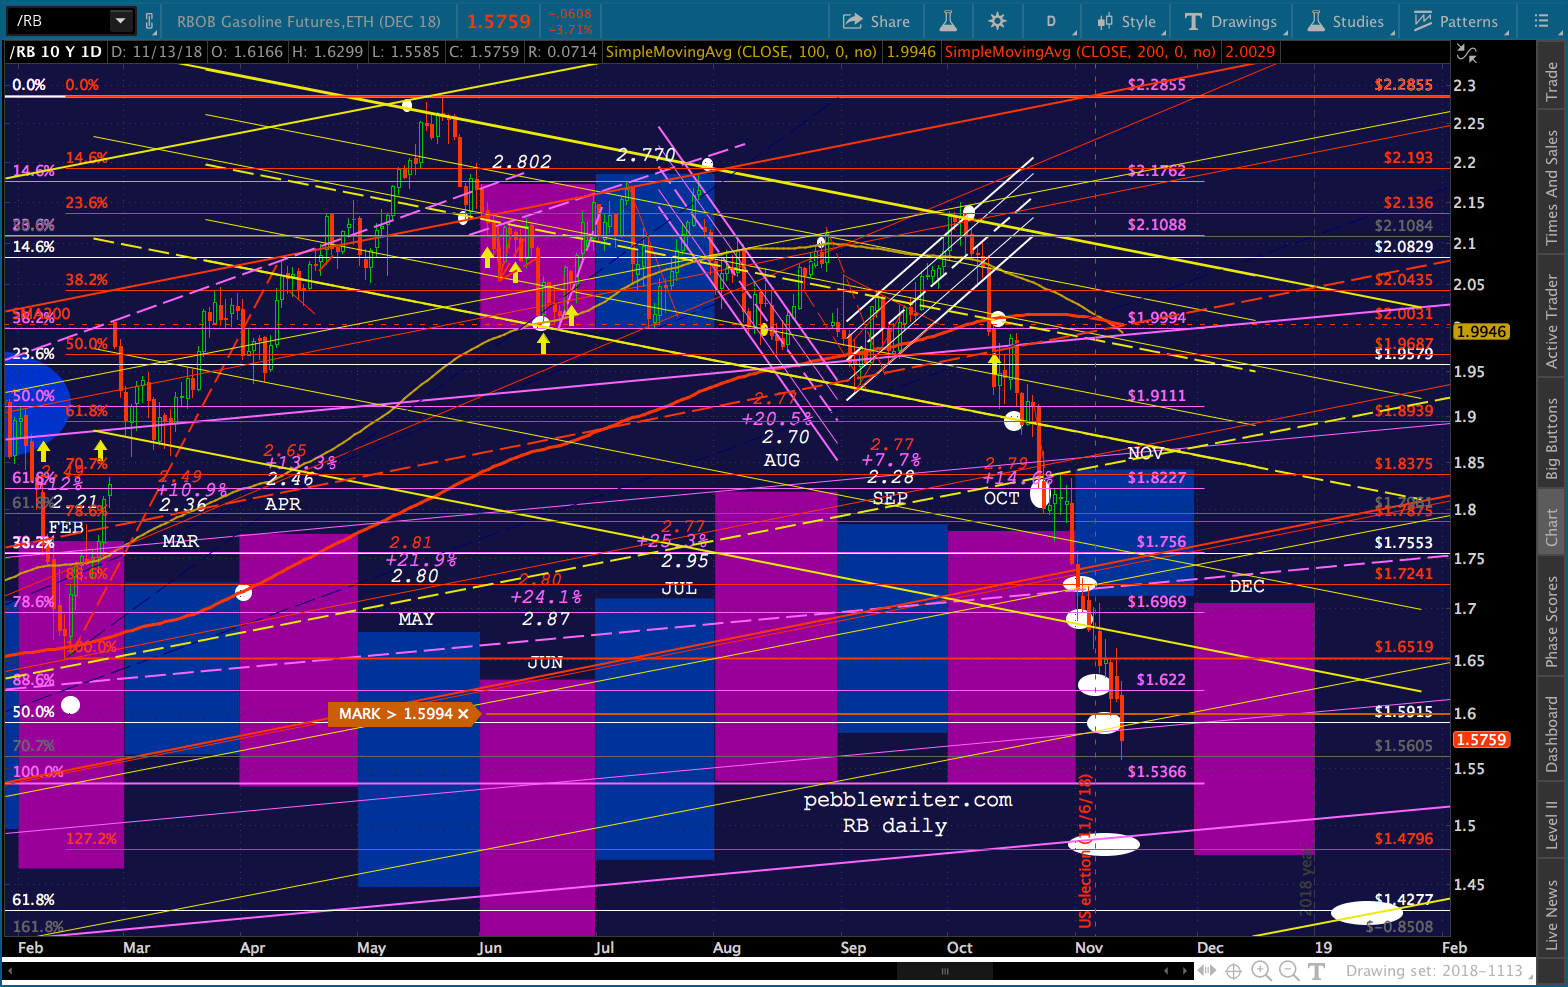
Since then, it has facilitated many accurate forecasts. Right now, it’s suggesting even more downside. If CL and RB (which just officially tagged our 1.5915 target overnight) fall any further, SPX could be in for quite another tumble.
 continued for members…
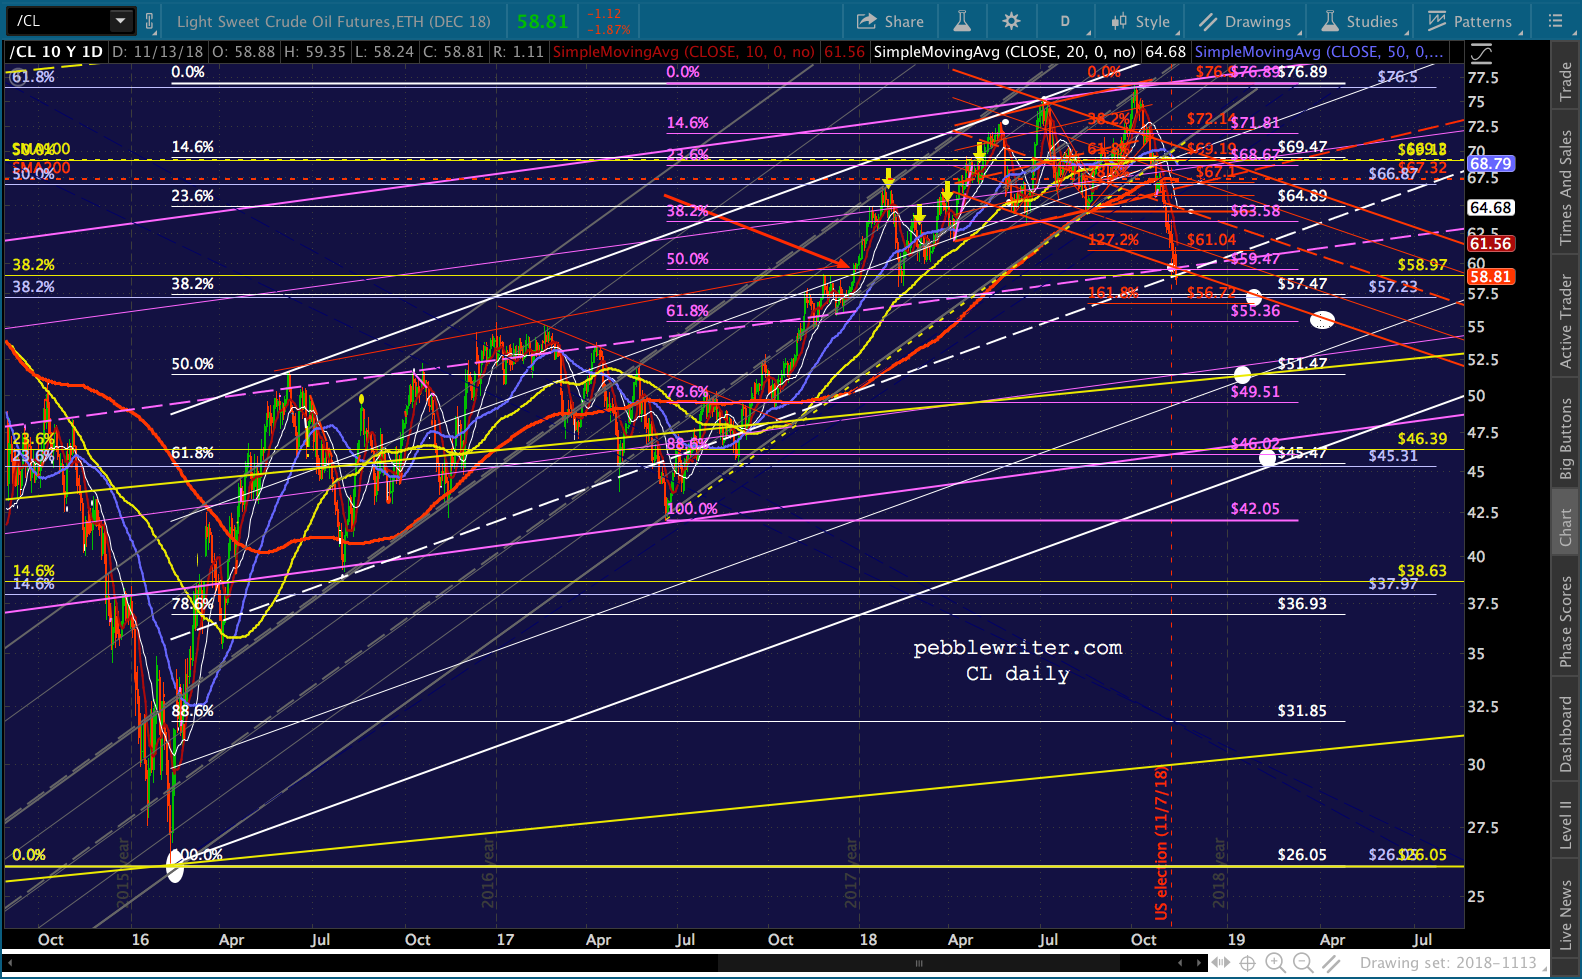
The big picture for RB and CL… Remember, while we were expecting bounces at 1.5915 and 58.97, these are also gateways to potentially lower outcomes. The way Trump is going after lower inflation/interest rates, I wouldn’t be surprised if oil and gas comply. Bottom line, mind your stops.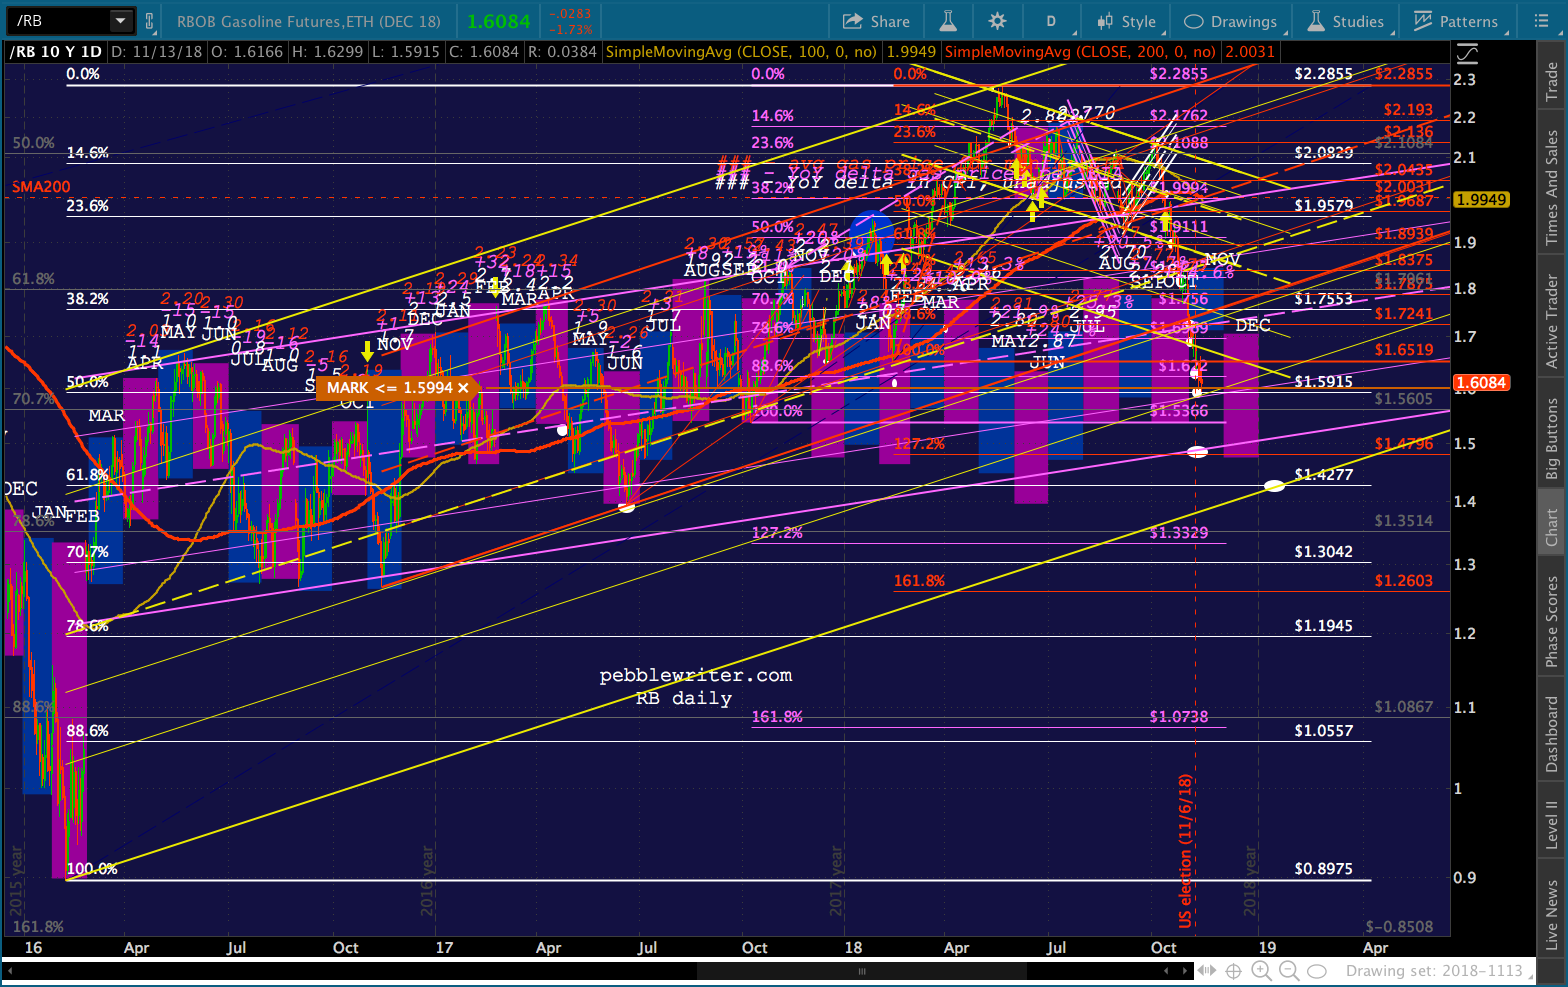 While those lower levels are perfectly legit, the original placement assumed the falling channels could keep it together. If CL’s falling red channel fails, we could get a quick downdraft to 57.47, 51.47 and even 45.47. Ditto for RB and its falling yellow channel — which has already broken down — and 1.4796 and 1.4277.
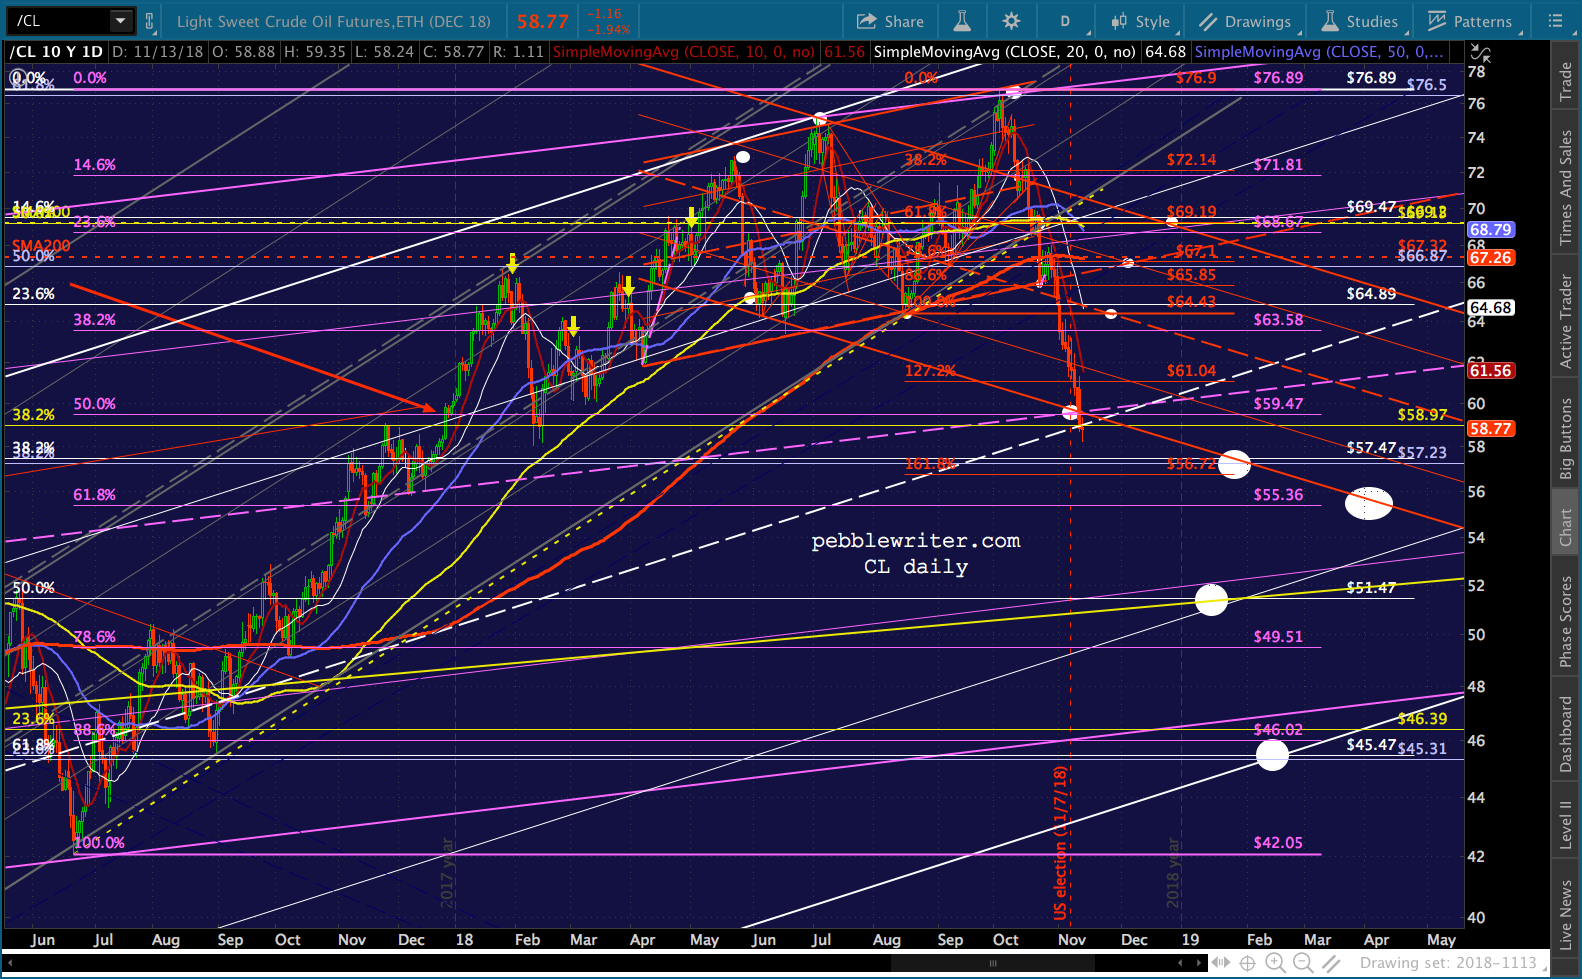
 Getting back to the yield curve model…
Note that the same patterns which have worked so well over the past 9 months have worked pretty well over the past several years, too.
Drops through the yellow TLs (yellow arrows) have always produced sizeable drops in SPX. Breakdowns below the former lows (white arrows) have always produced drops — some larger than others. Breakouts above resistance (red arrows) have been bearish. And, bounces off TL support have tended to be bullish.
There have been exceptions and head fakes. But, it’s been a fairly reliable indicator. Right now, it’s suggesting even more downside.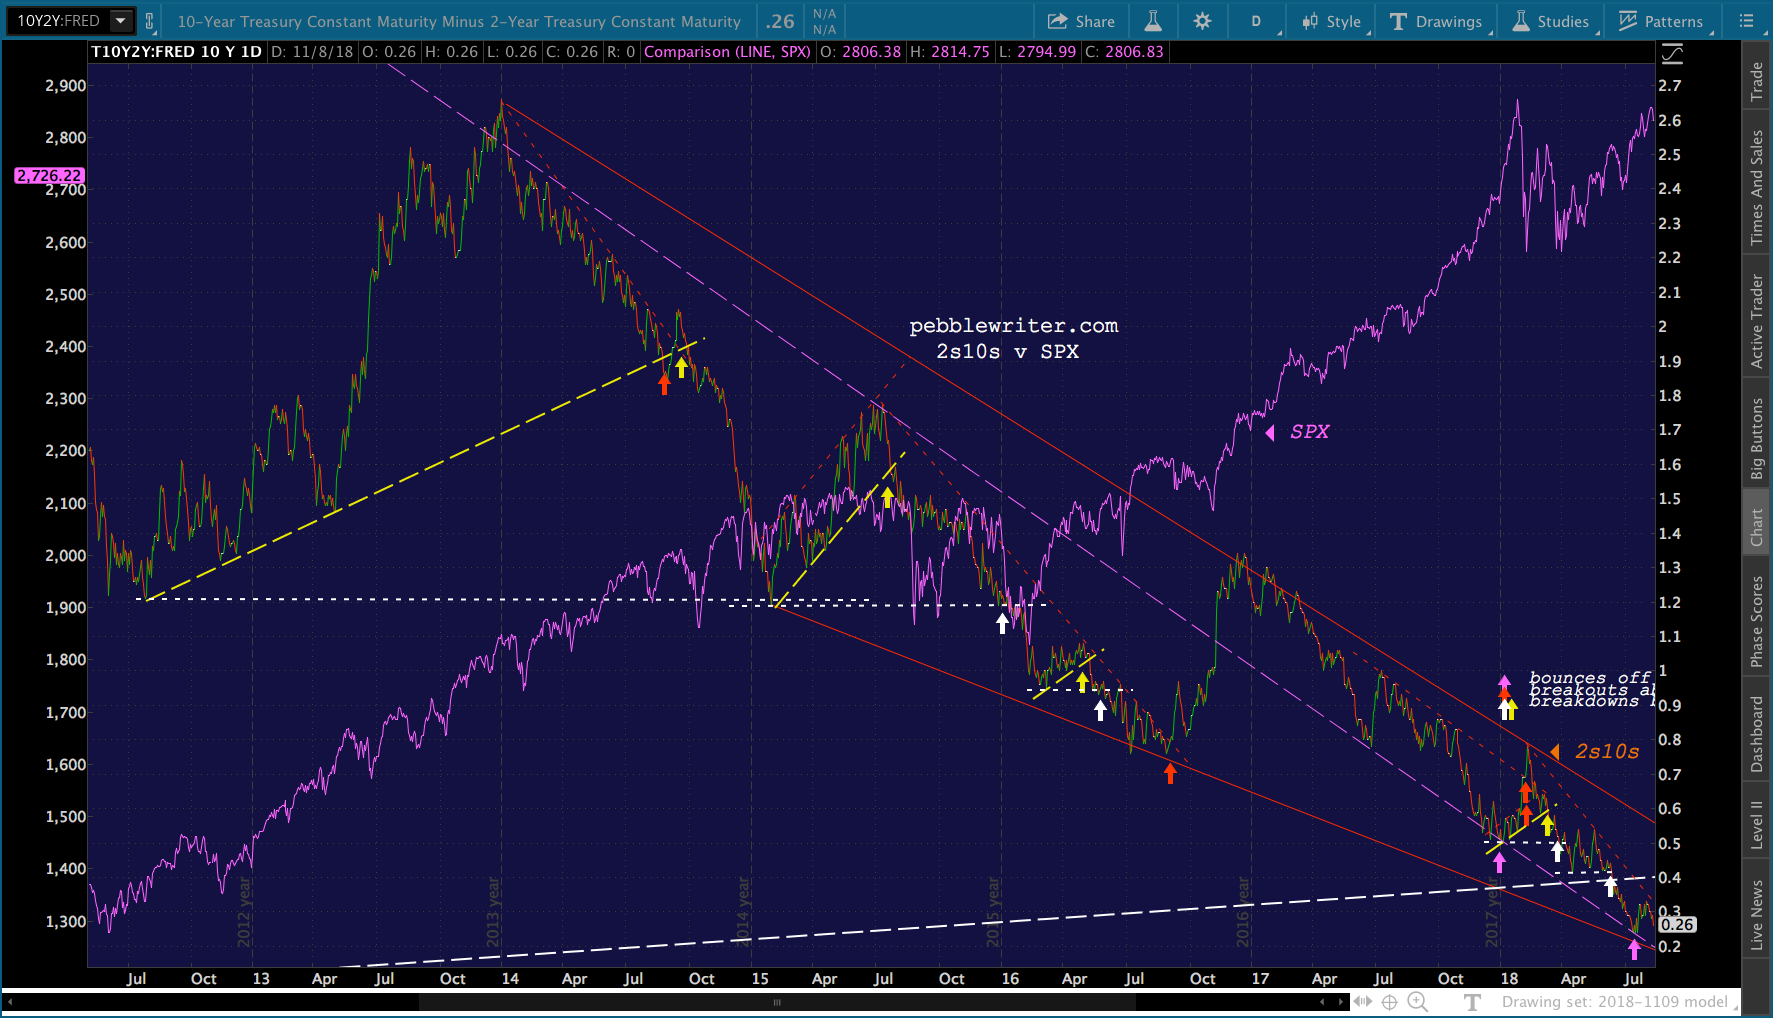 I find this interesting because COMP — which, we should remember, has disappointed us in Feb and April with near misses on its SMA200 — has one last chance to make amends with a drop to 6800ish in December.
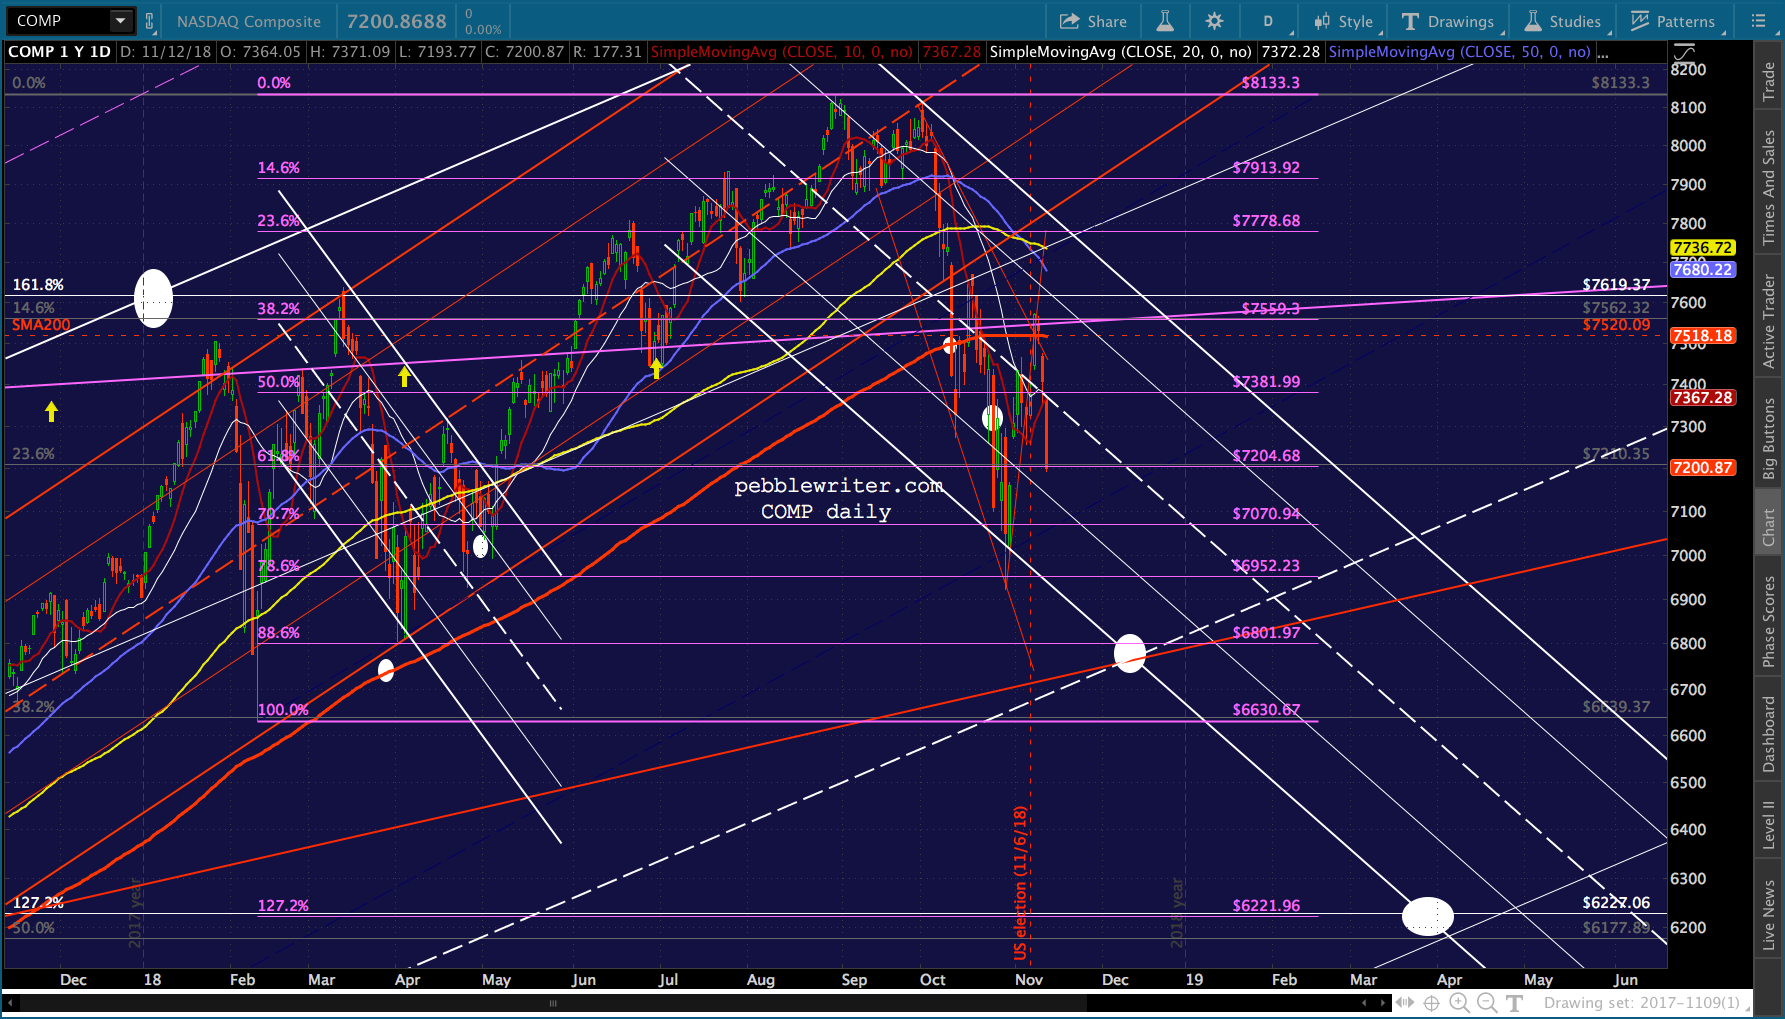 If 6800 holds (5.55% below yesterday’s close), we’ll call it a backtest and go on to bigger and better things. If 6800 should fail, however, the consequences could be quite serious.
 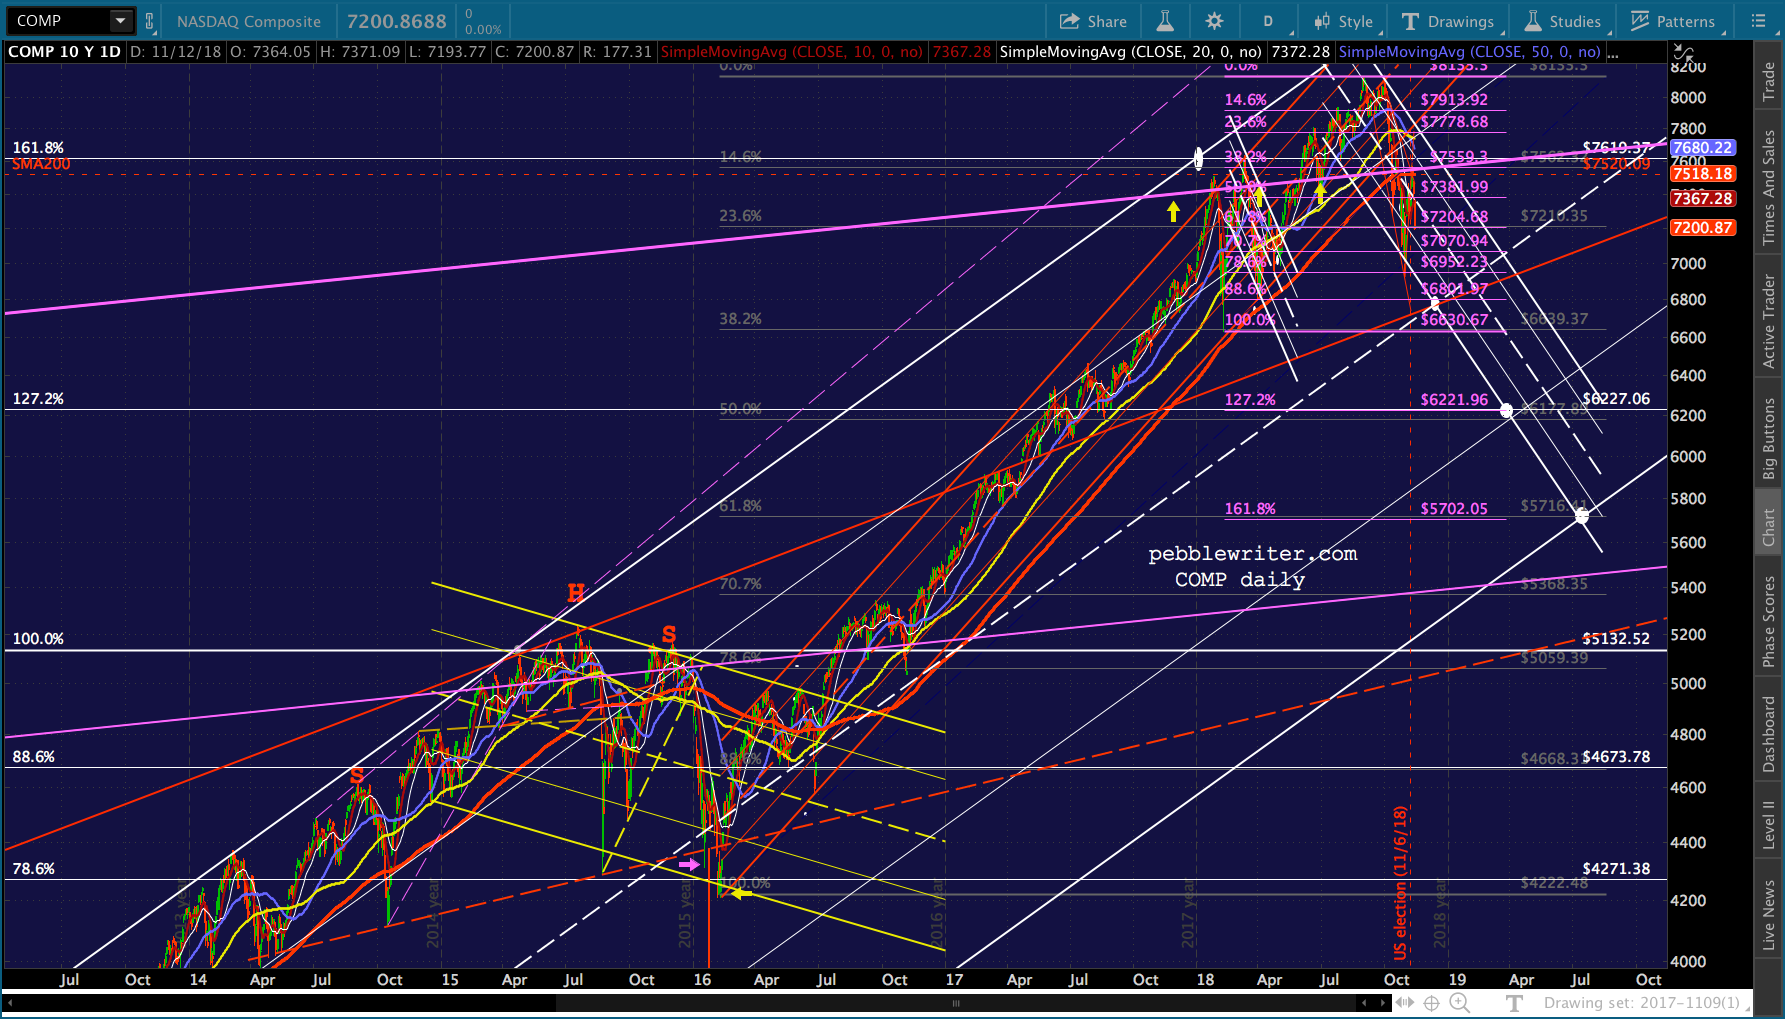 A 5.55% drop for SPX would put it at about 2570 — fairly close to the H&S Pattern completion.
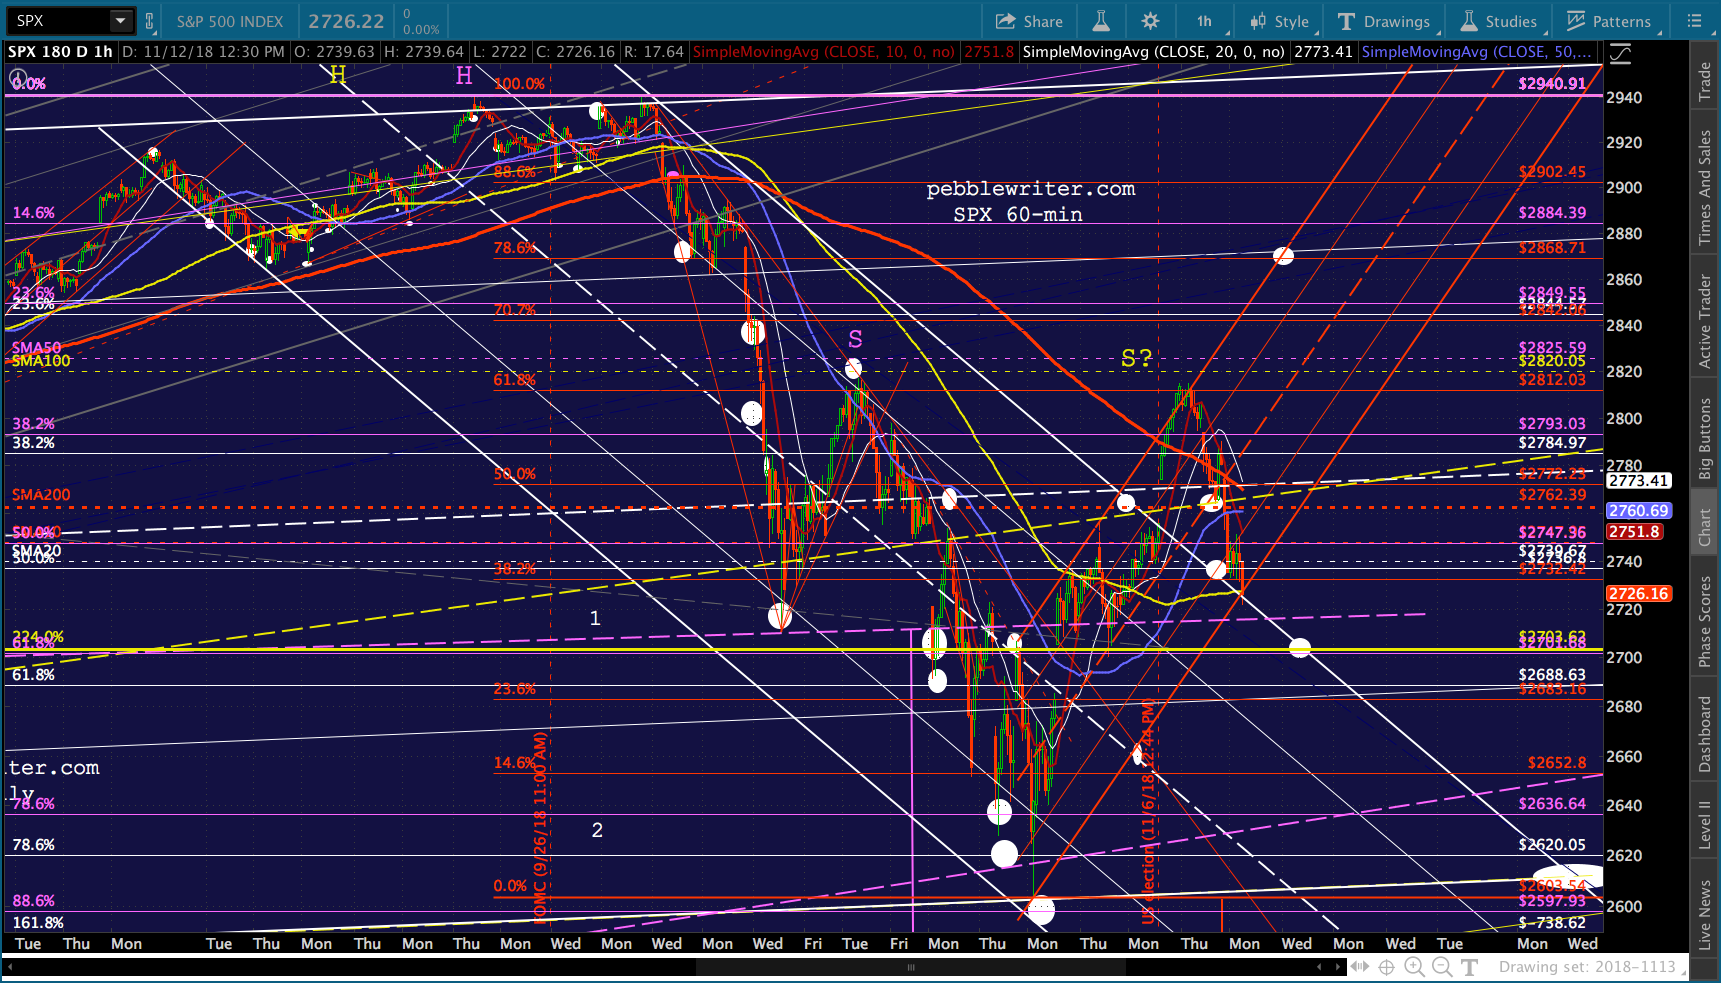
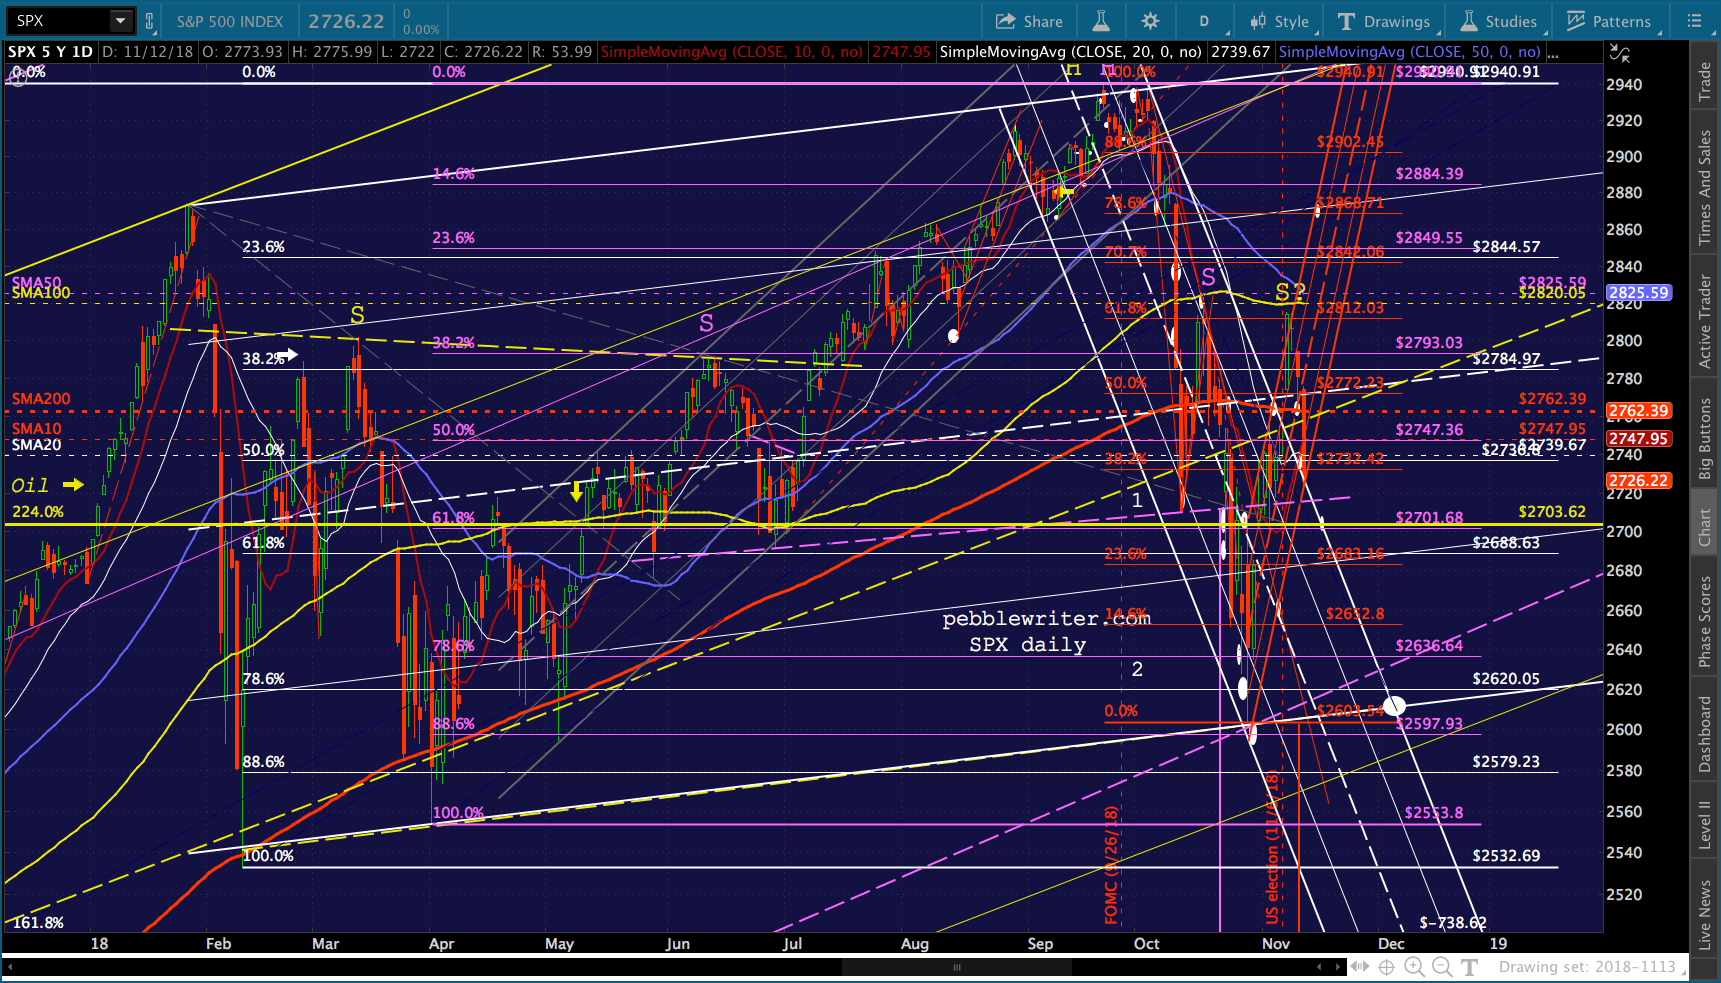 A bigger drop targets some of the other downside targets we’ve laid out, with the granddaddy of all being 2138. SPX’s setup for today…
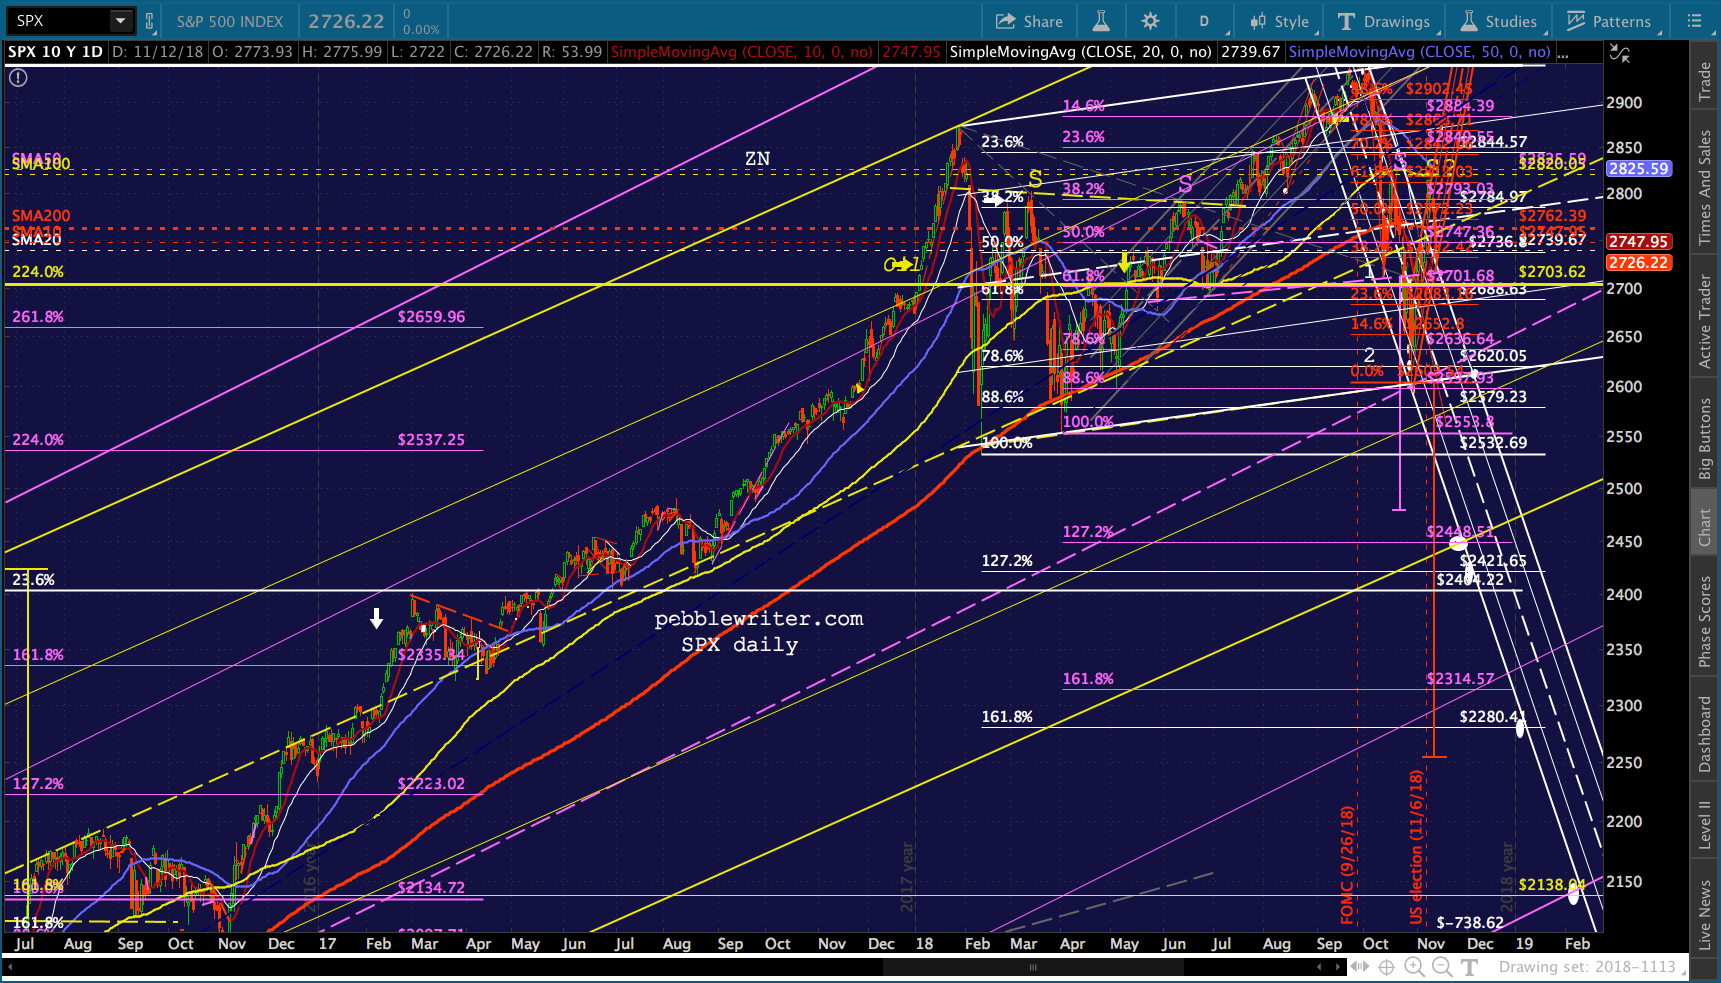 Why don’t I just come out and say SPX 2138 by Feb 2019? Simple. We don’t know how crazy things could get in oil and gas and USDJPY. How far are TPTB willing to go?
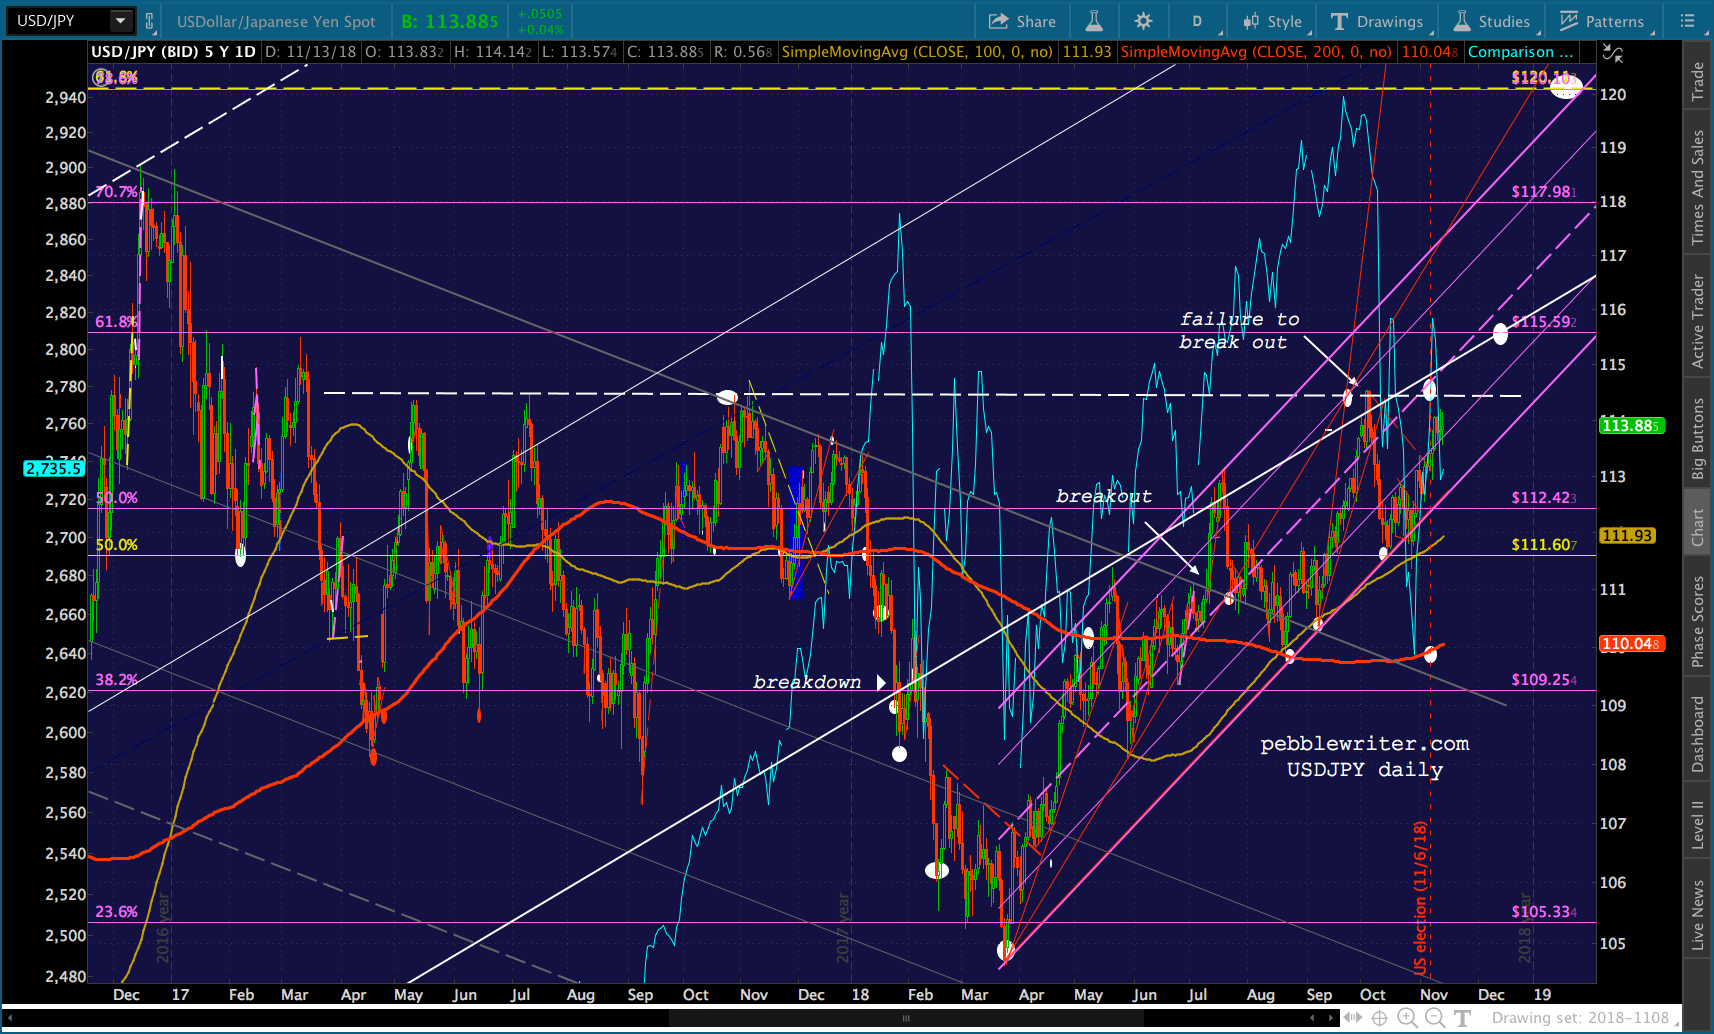
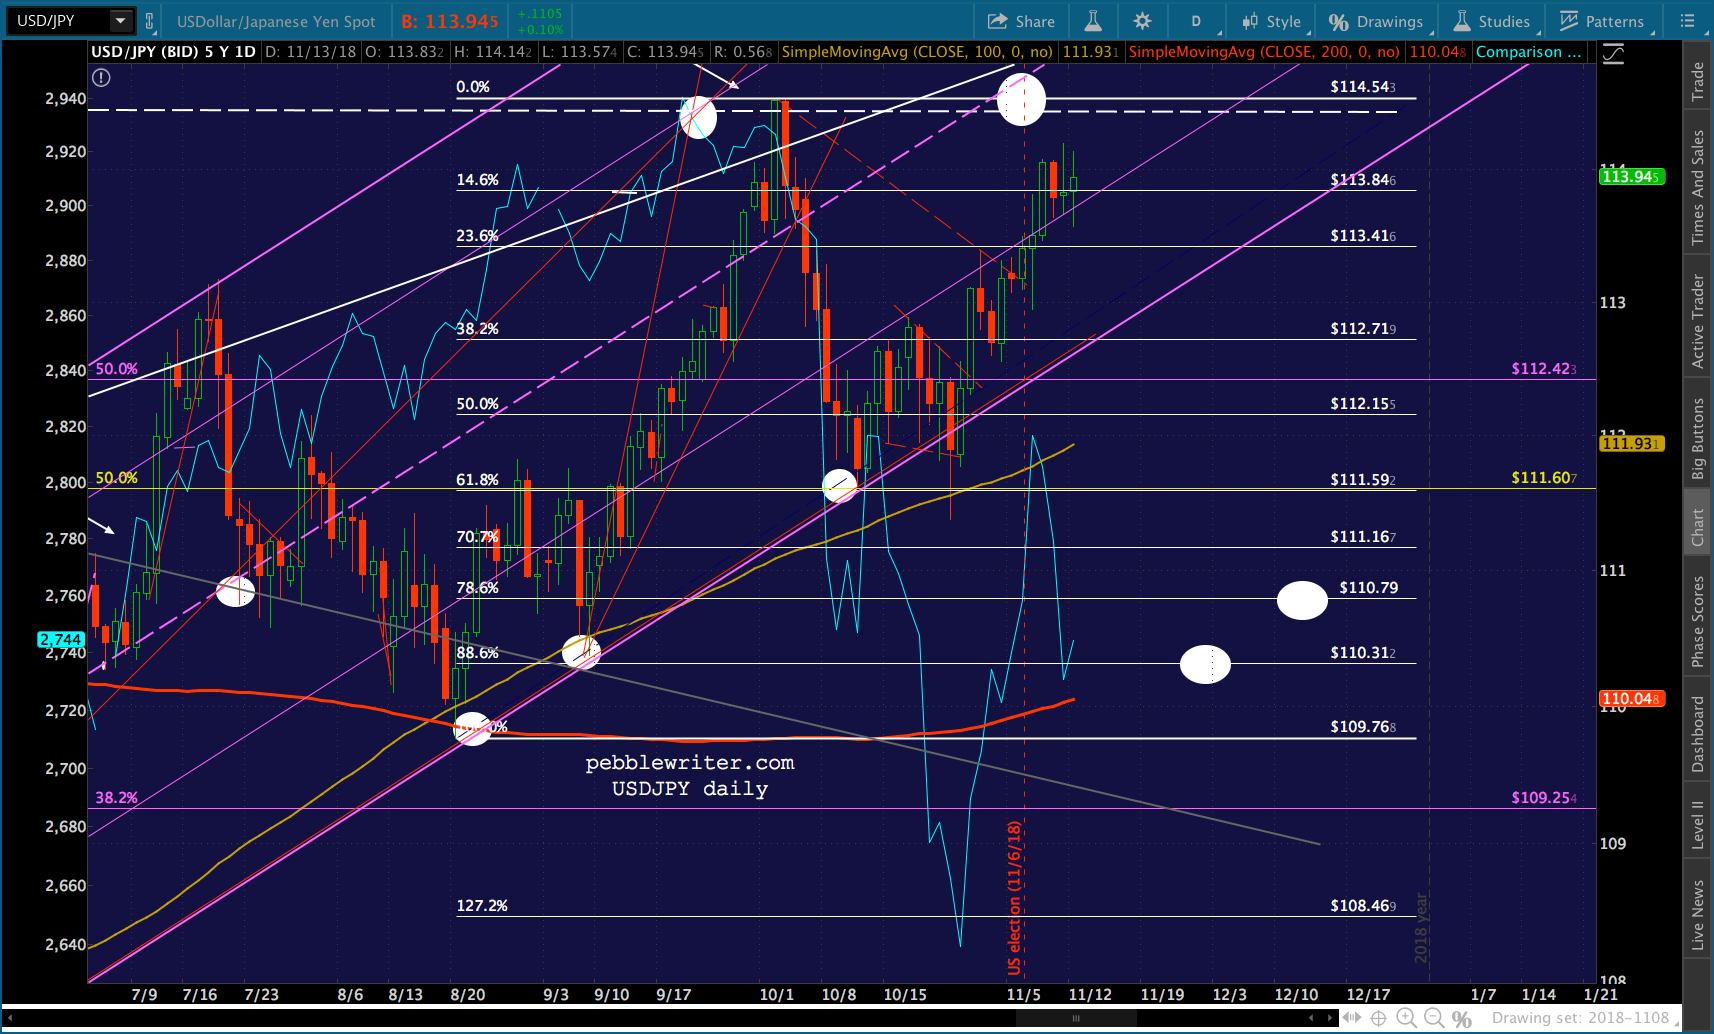
We know that USDJPY has been threatening a breakout for a long time…but, failing to deliver. The last couple of times it failed, stocks took quite a beating. And, it’s still just backtested a failed, LT channel.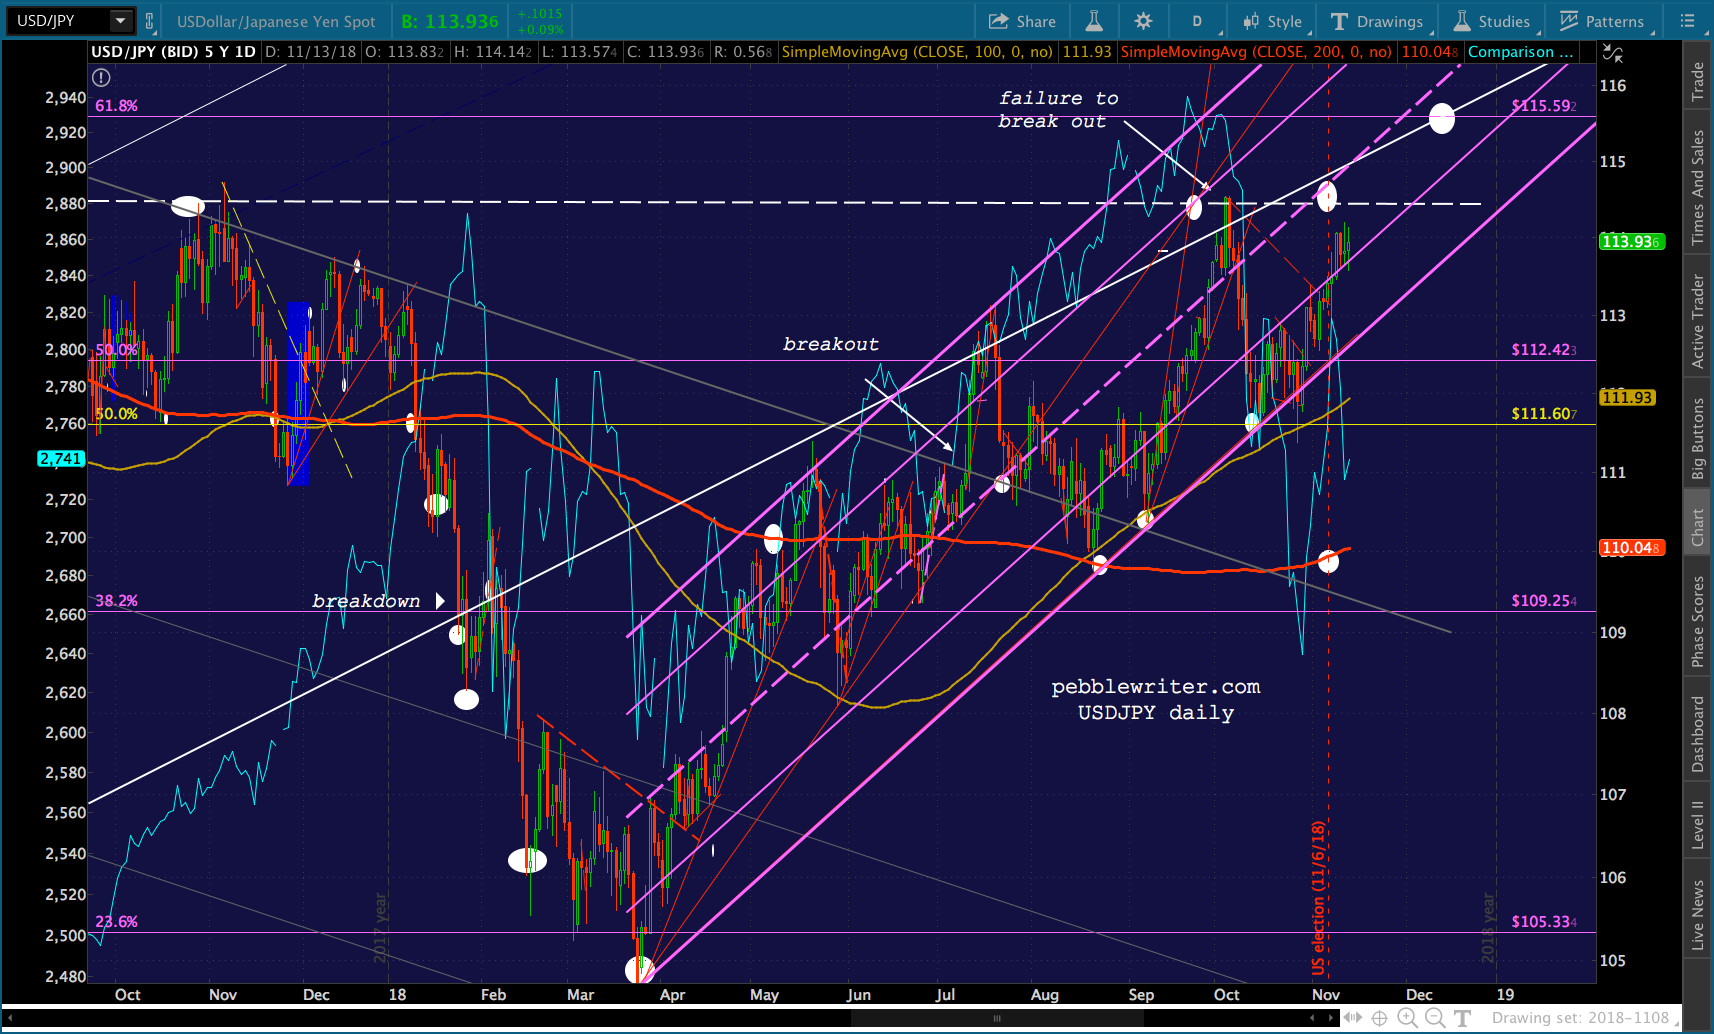
 Oil and gas are the other imponderable. While we detailed logical next stops above, how serious is Trump about driving CPI into the ground? October is already baked in, and should come in tomorrow at a moderate level, we’re heading for a CPI collapse in November.
If it comes in as weak as it currently looks – think low 2s – the FOMC will have a hard time justifying the rate hike they’ve all but promised in December. At the very least, it would be fun to watch the verbal contortions involved in explaining a rate hike with 2%ish CPI.
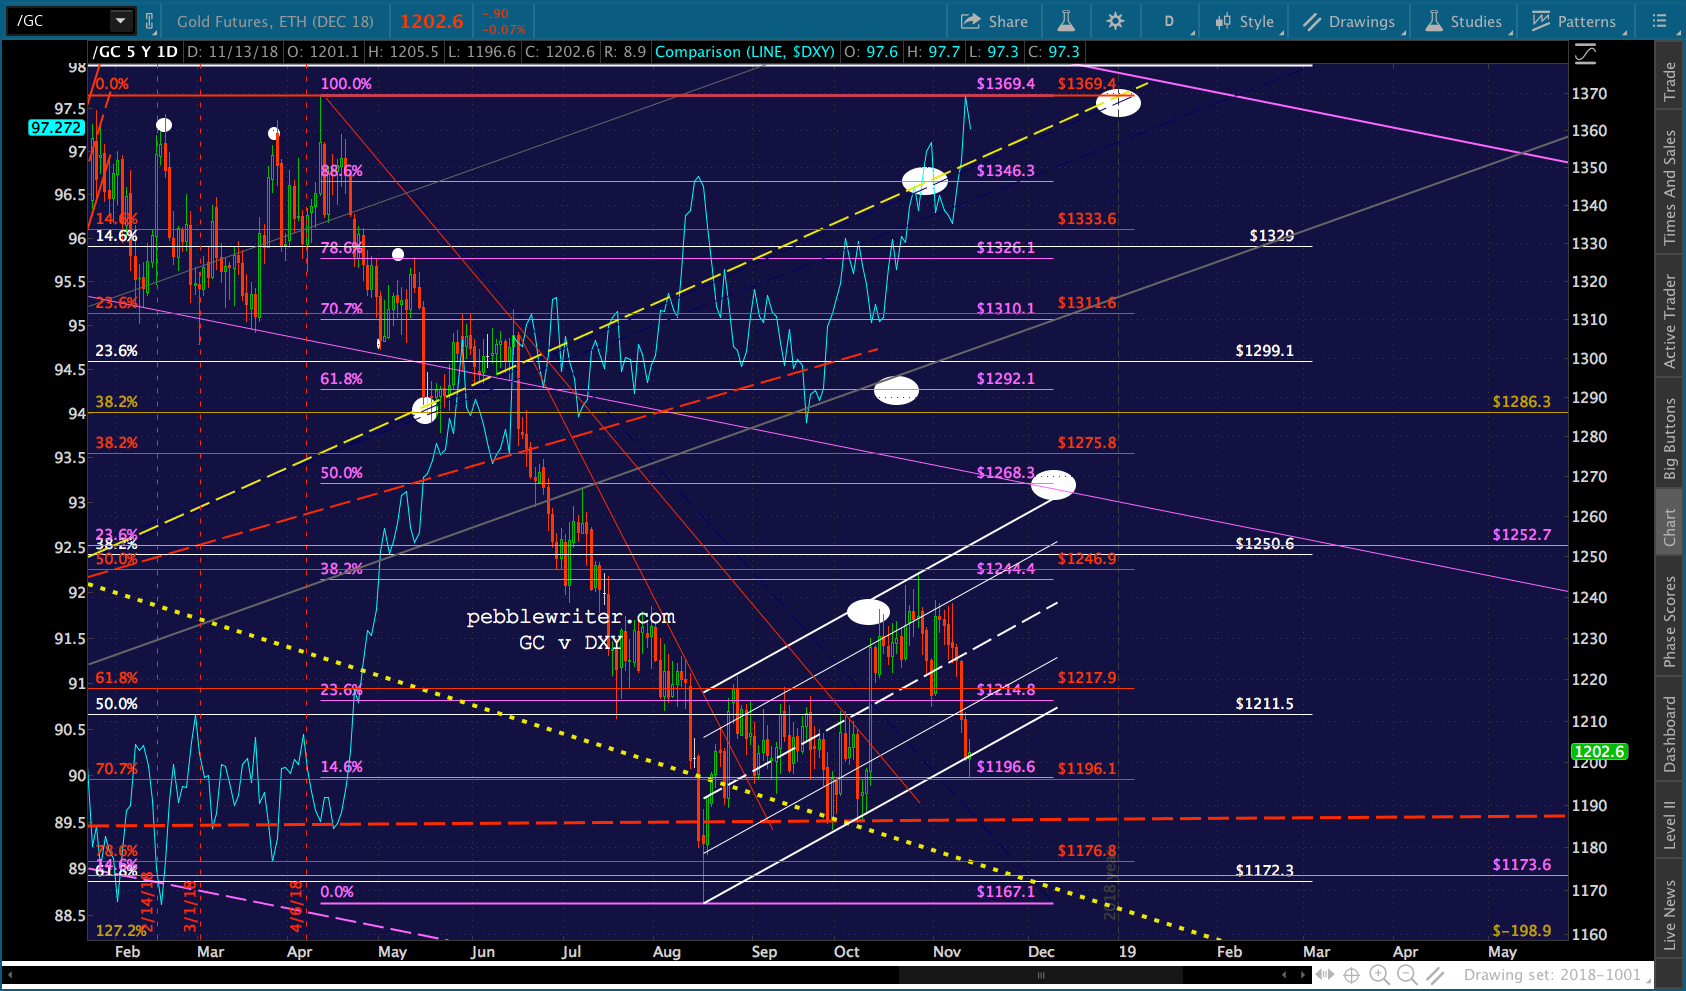
Remember, a lower DXY equals higher inflation. If the FOMC is determined to raise rates in December, letting the air out of the USD would be one way to pursue it.
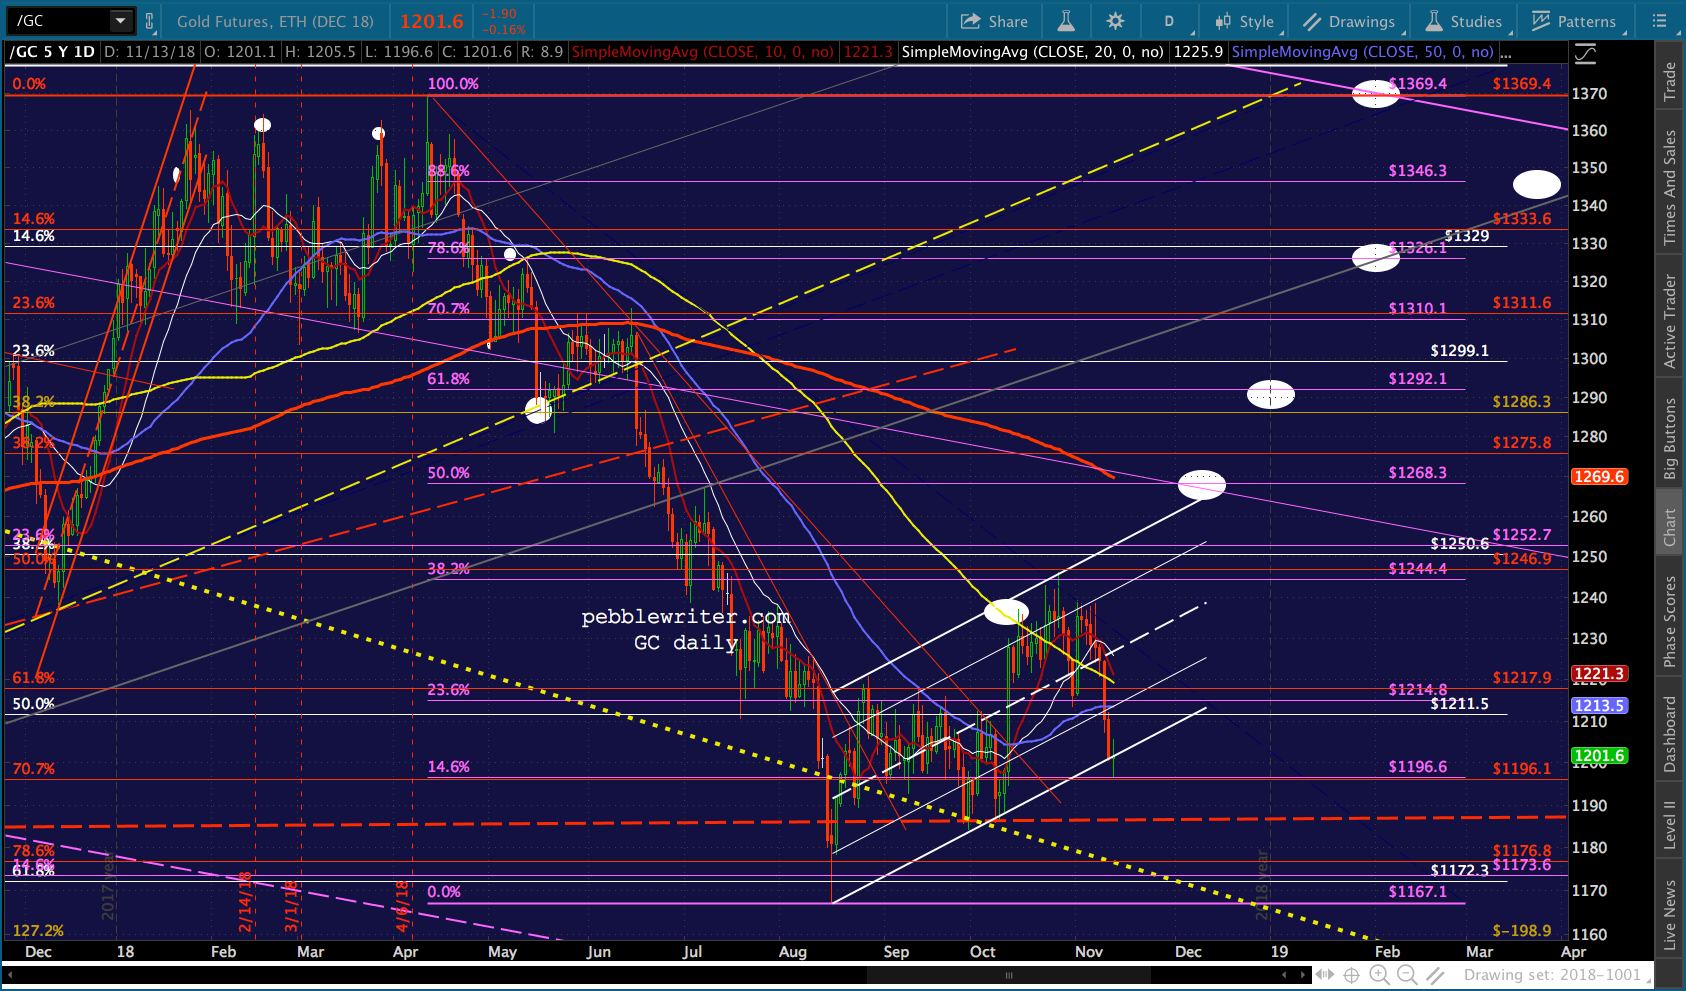
If this plays out, we should see the USD start leaking lower as soon as today or tomorrow.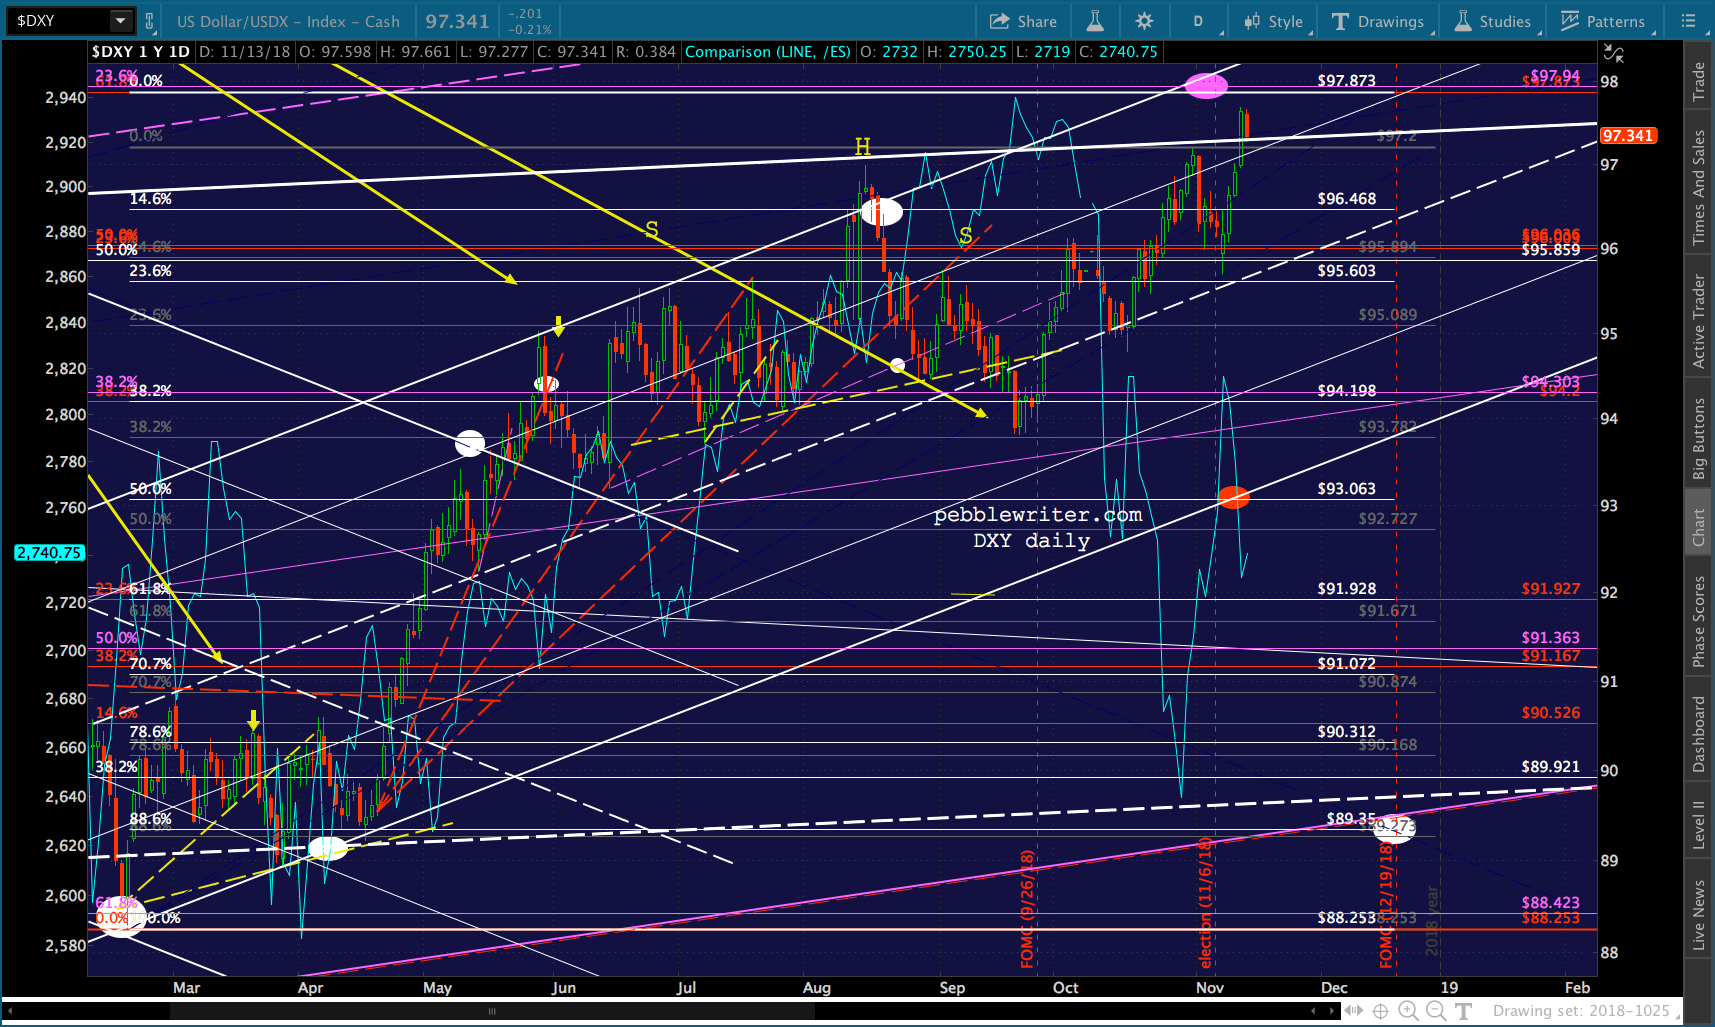 GC’s charts certainly indicate this is a possibility.
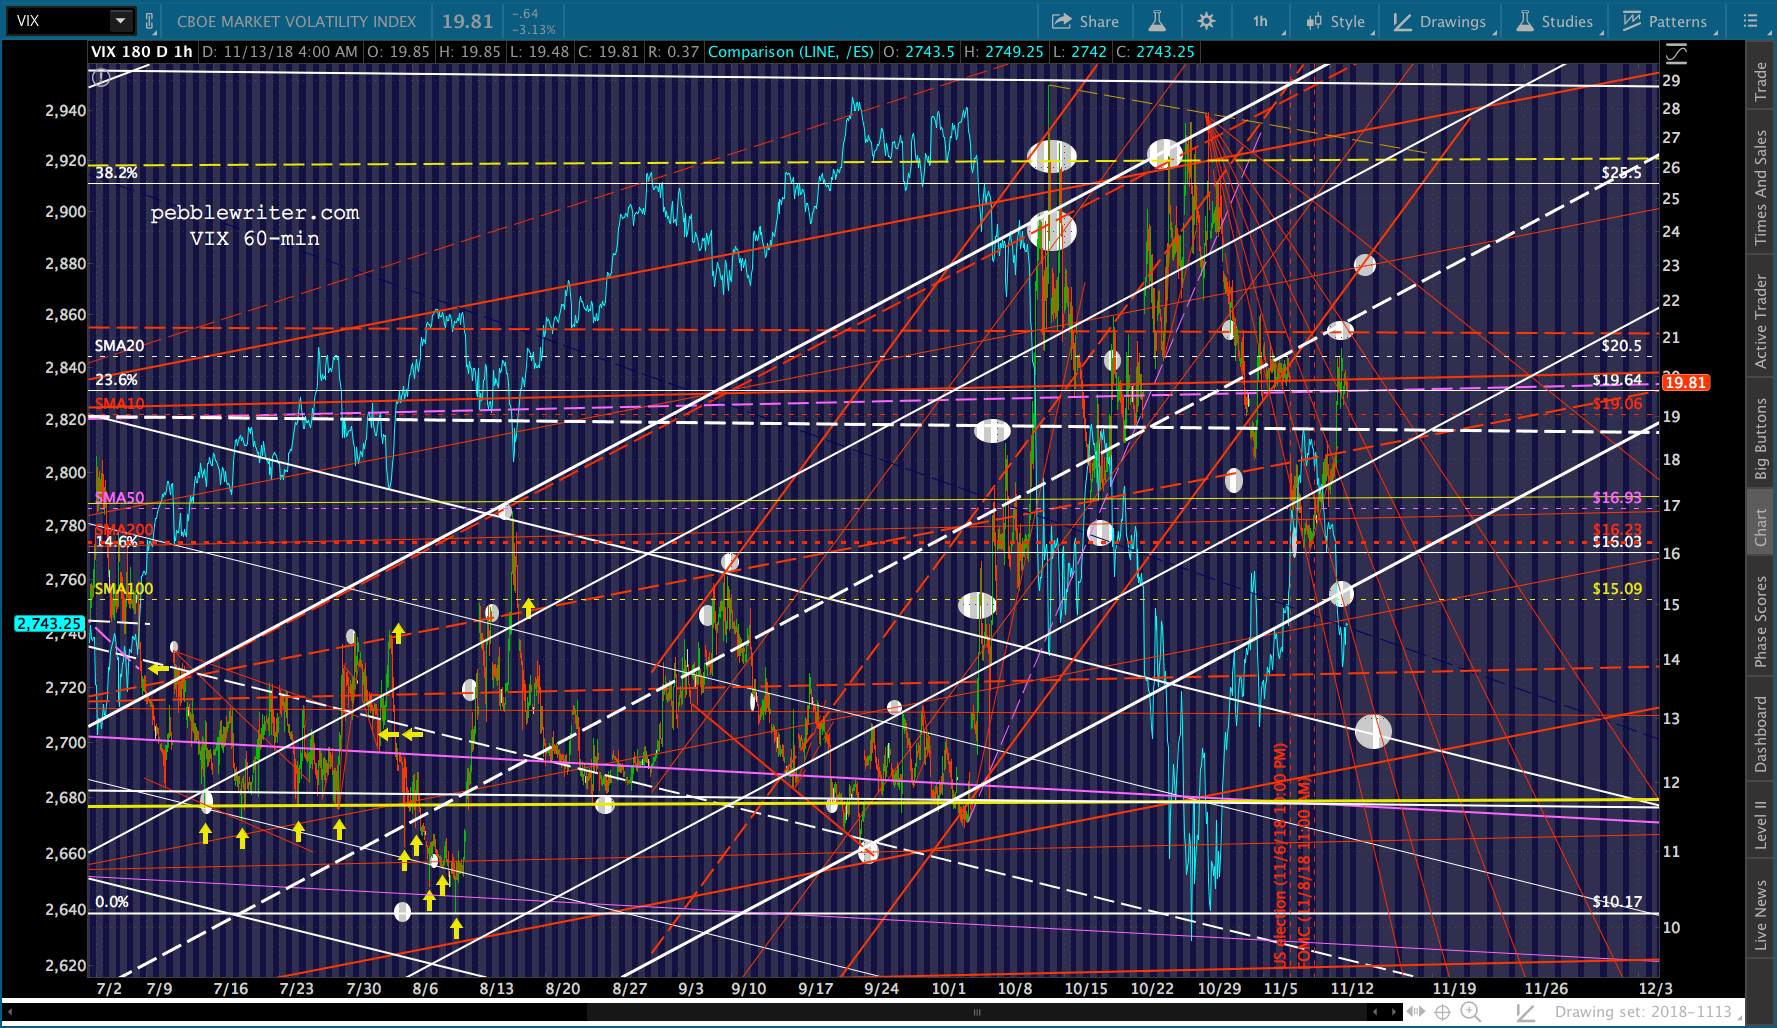
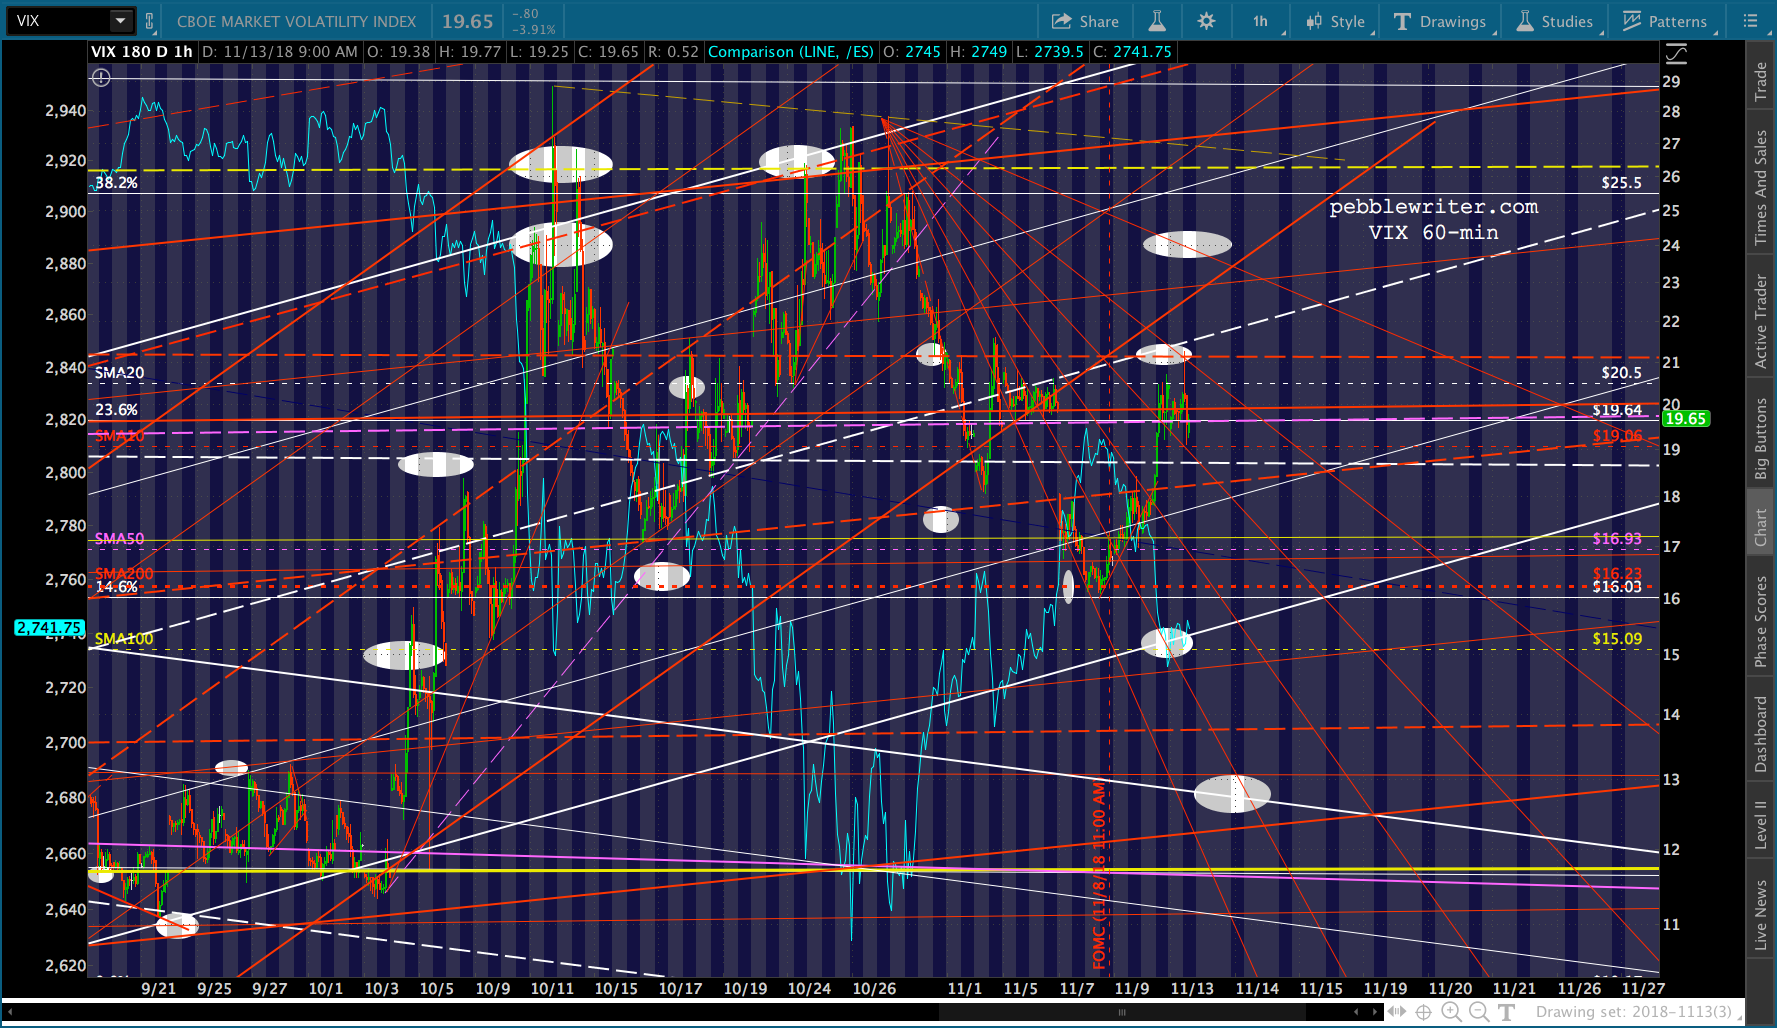
 As always, keep an eye on VIX which is still bouncing off its SMA200 (Nov 7.) A push above the top MA at 20.5 would open the door to 26 and above.
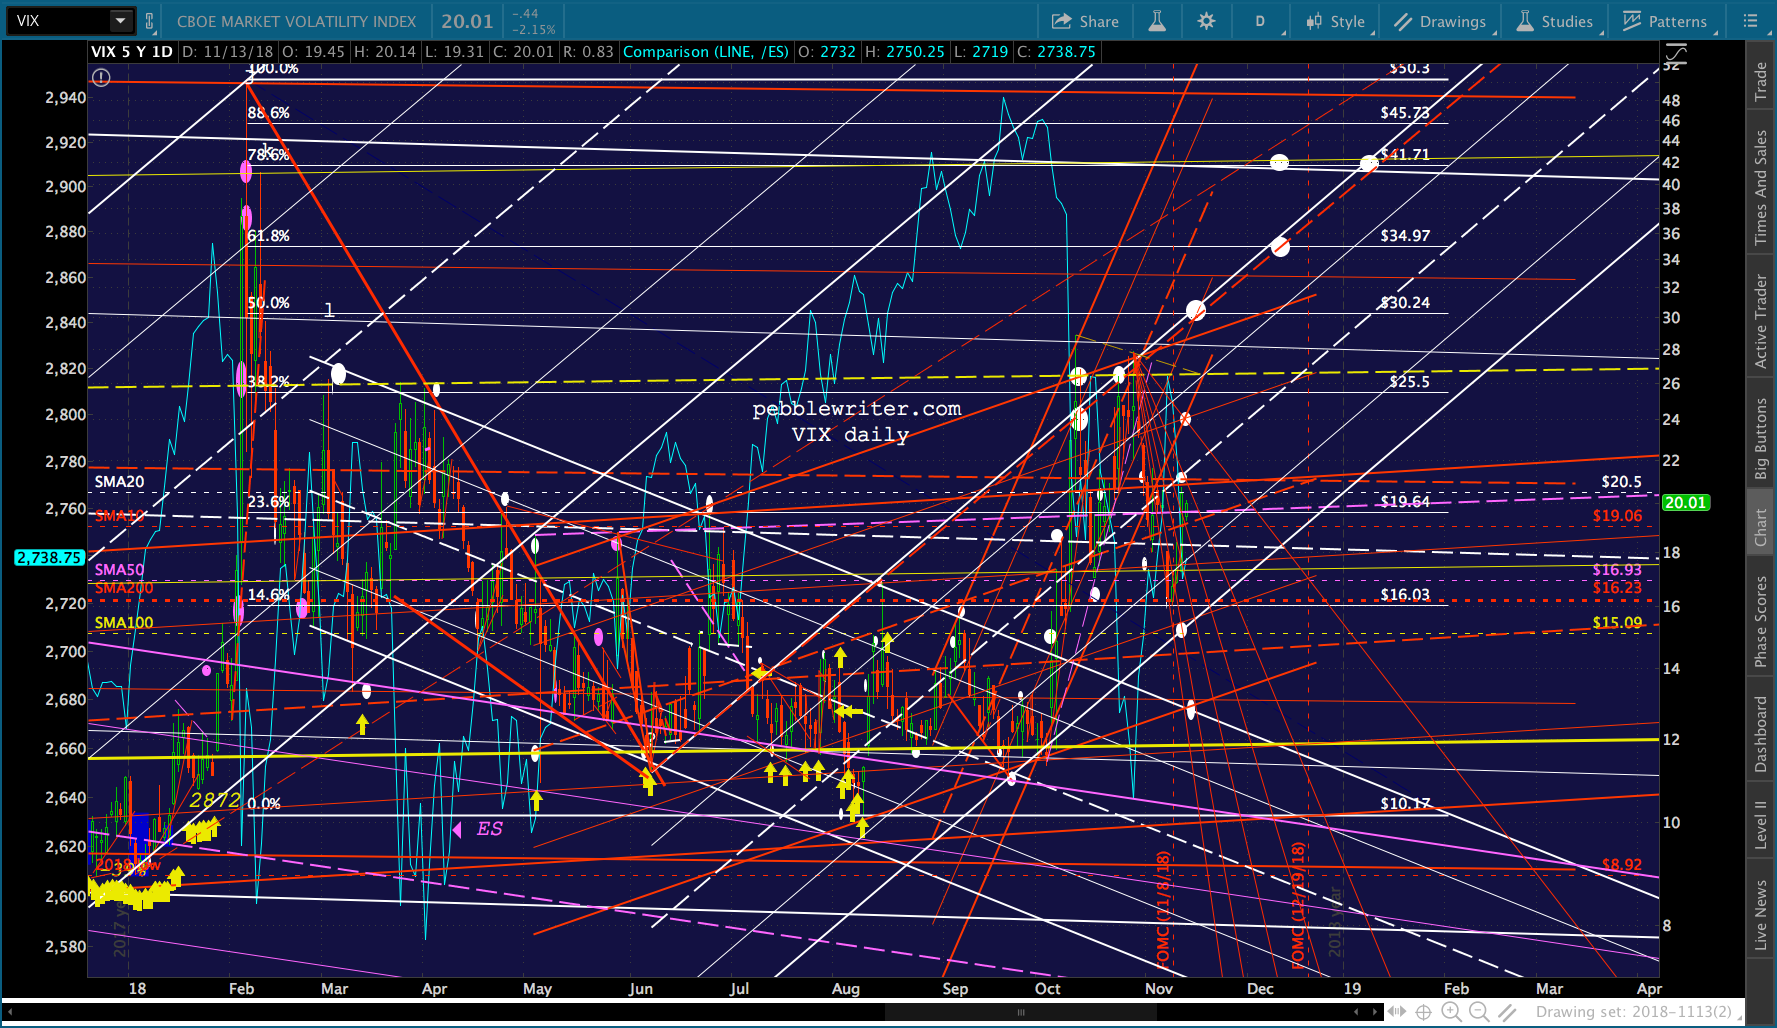
 UPDATE: 12:15 PM
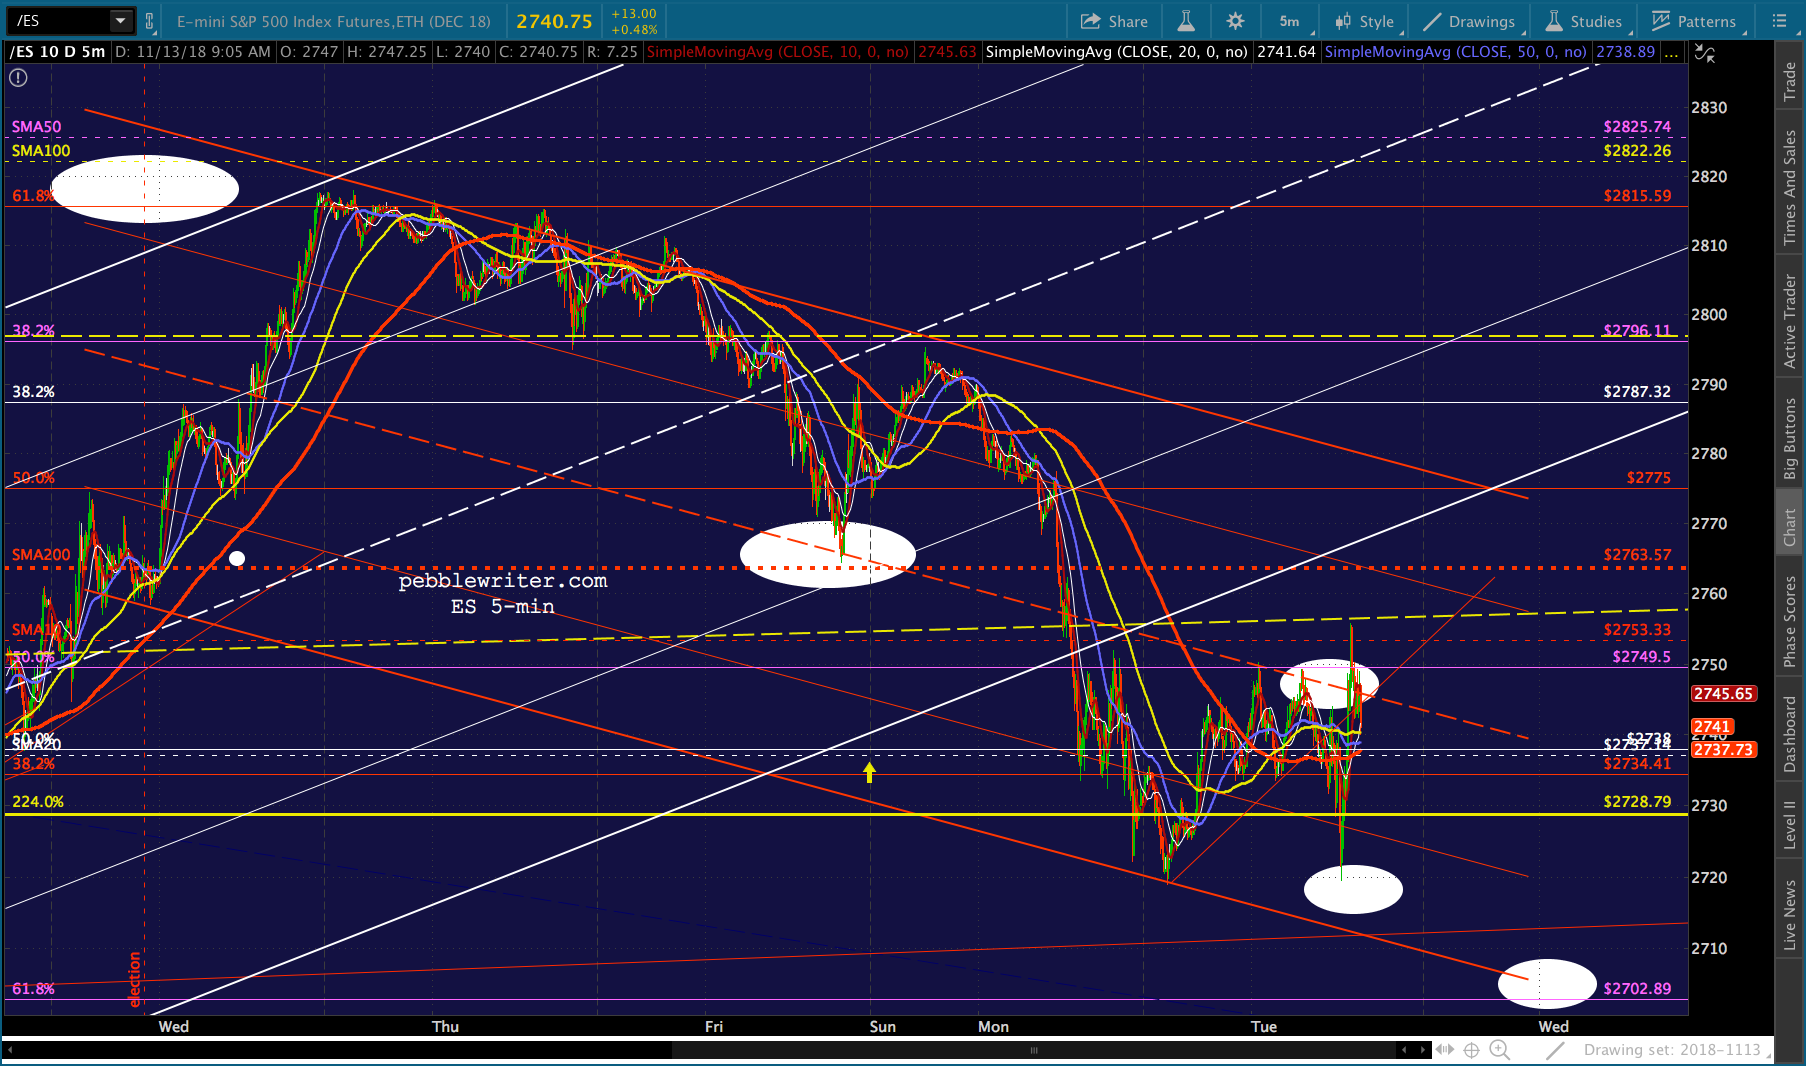
A bit of a wild ride, today, as ES reached our initial target and then bounced 35 points. It is now perched above the red TL while SPX is hanging out just below its SMA10. This feels more like a delay than a reversal with legs. But, keep an eye on USDJPY and VIX for confirmation.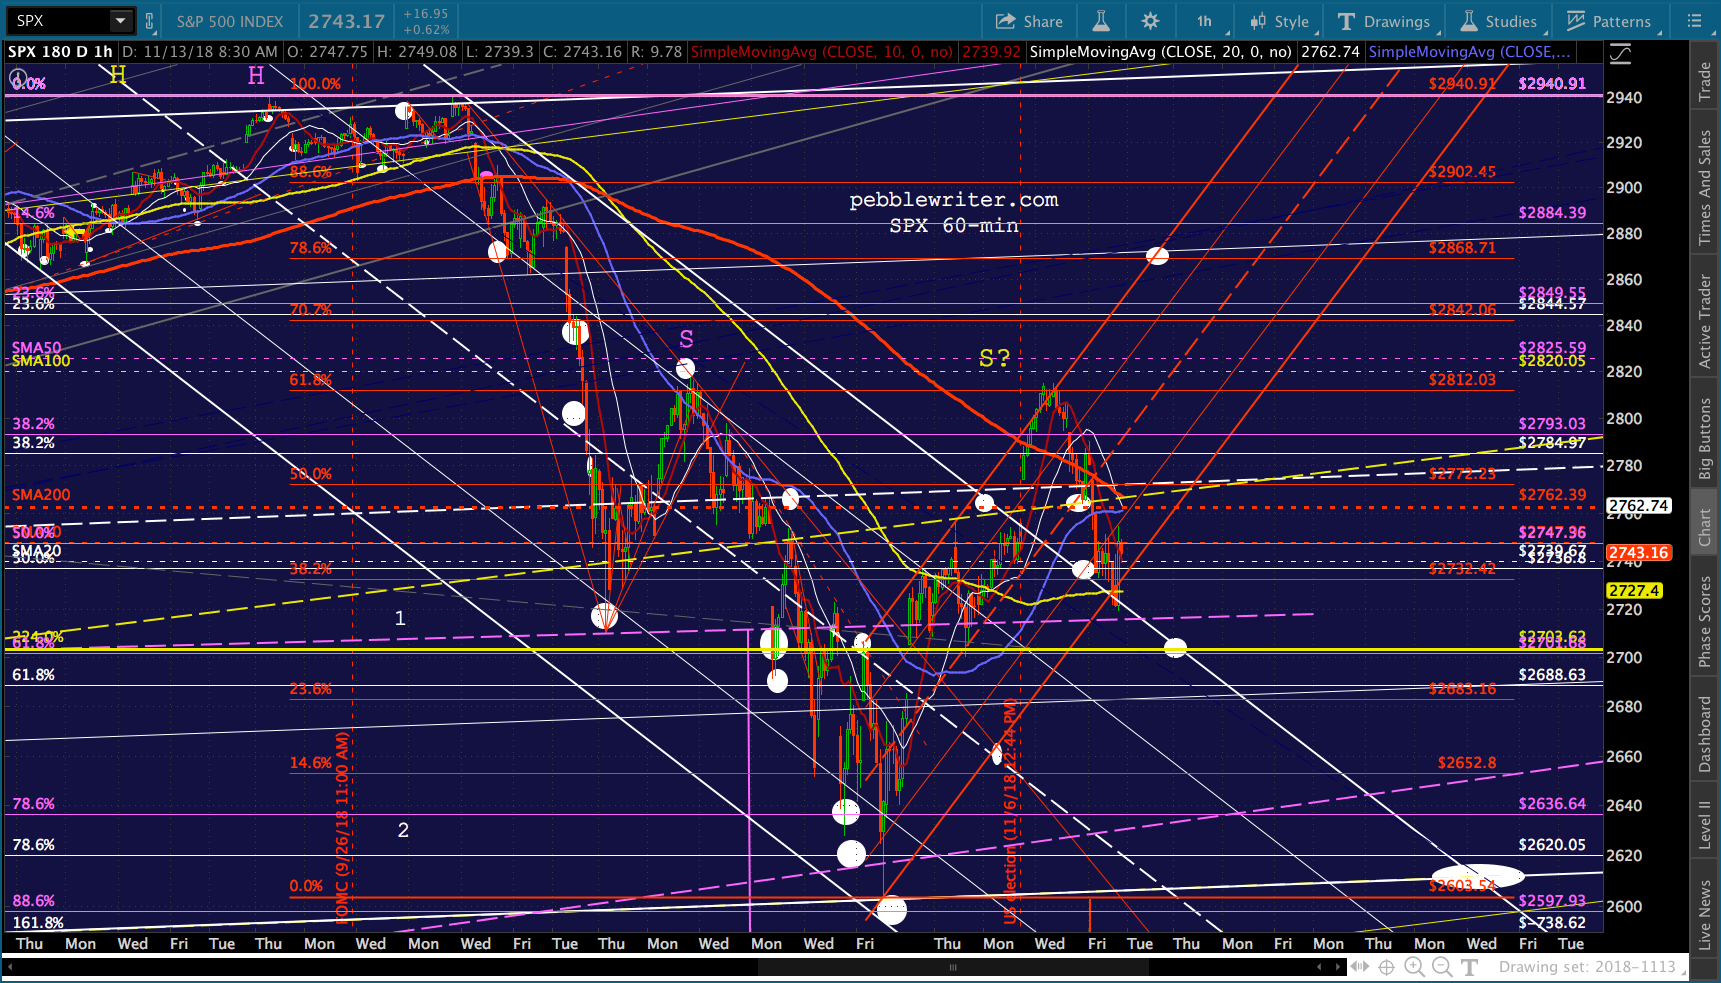

 UPDATE: 3:30 PM
CL and RB keep ticking off our downside targets one by one. Note that AAPL is back below its SMA200… 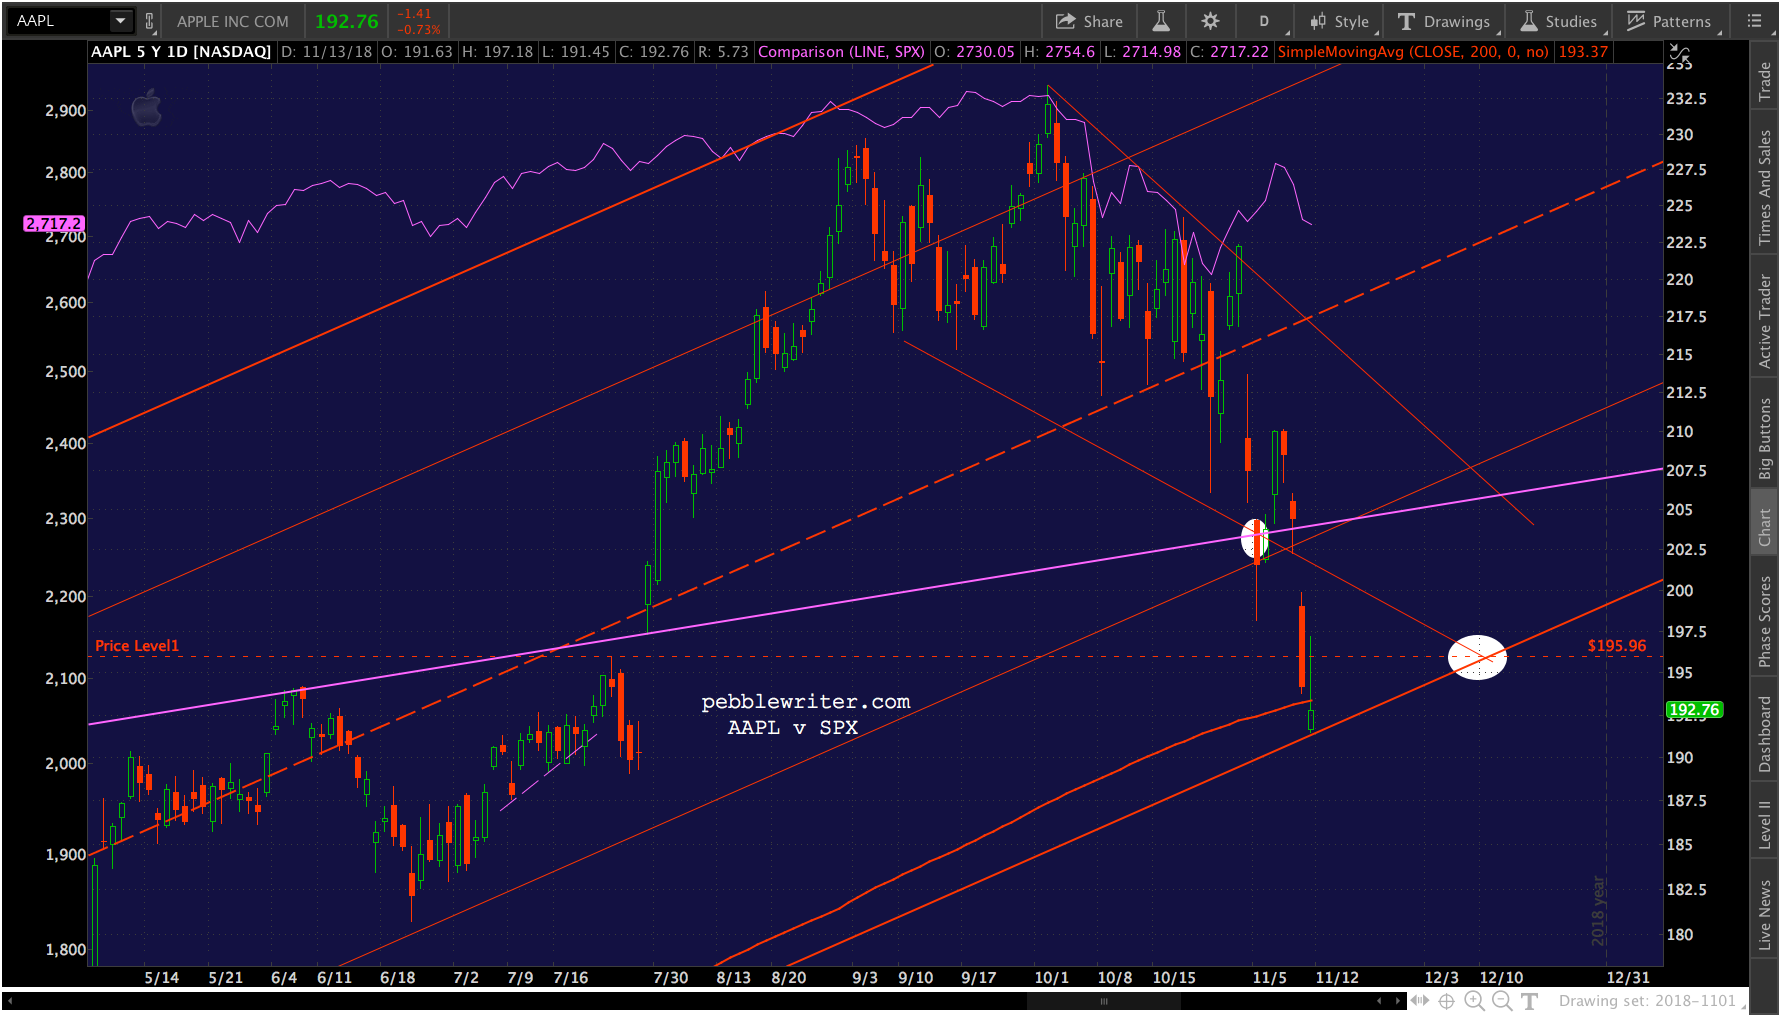 …COMP has made a lower low…
 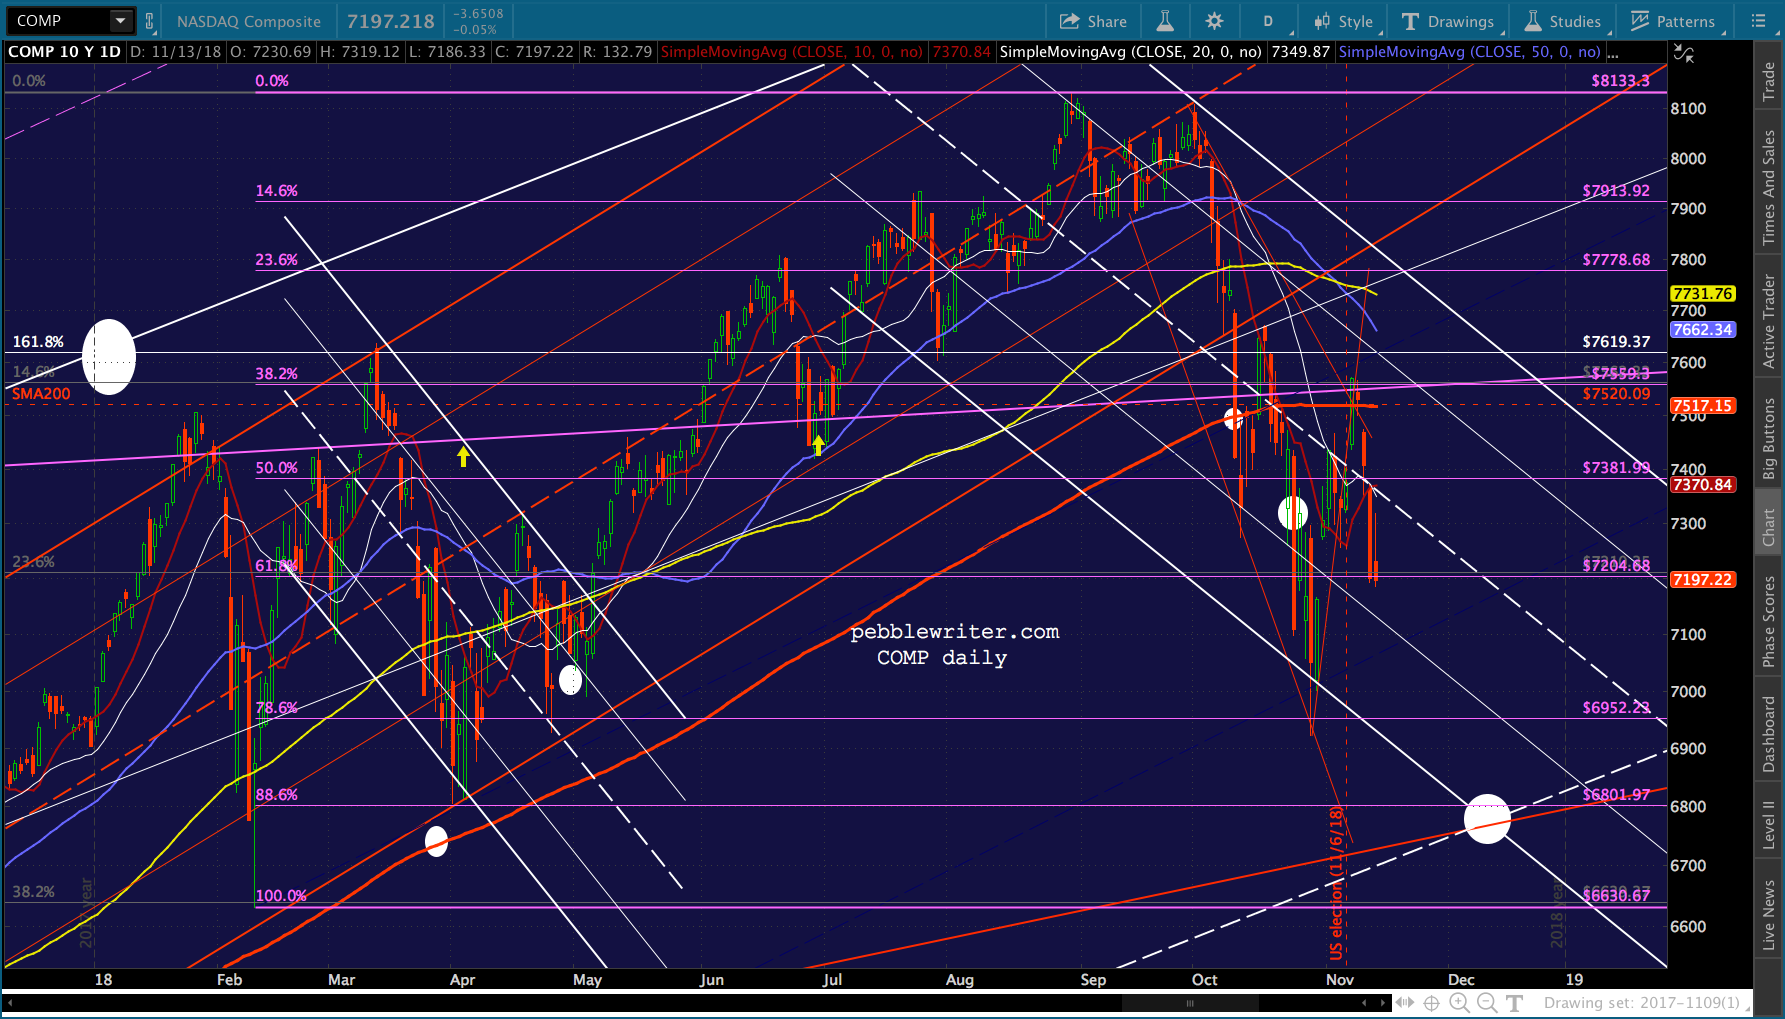 …and, SPX is closing in on its 2.24. Some important moments of truth coming up.
 It looks like CL is likely to reach 1.4796 now, and potentially bounce for a while until the white channel catches up to it. This would preserve the Fib structure and offer decent support all around.
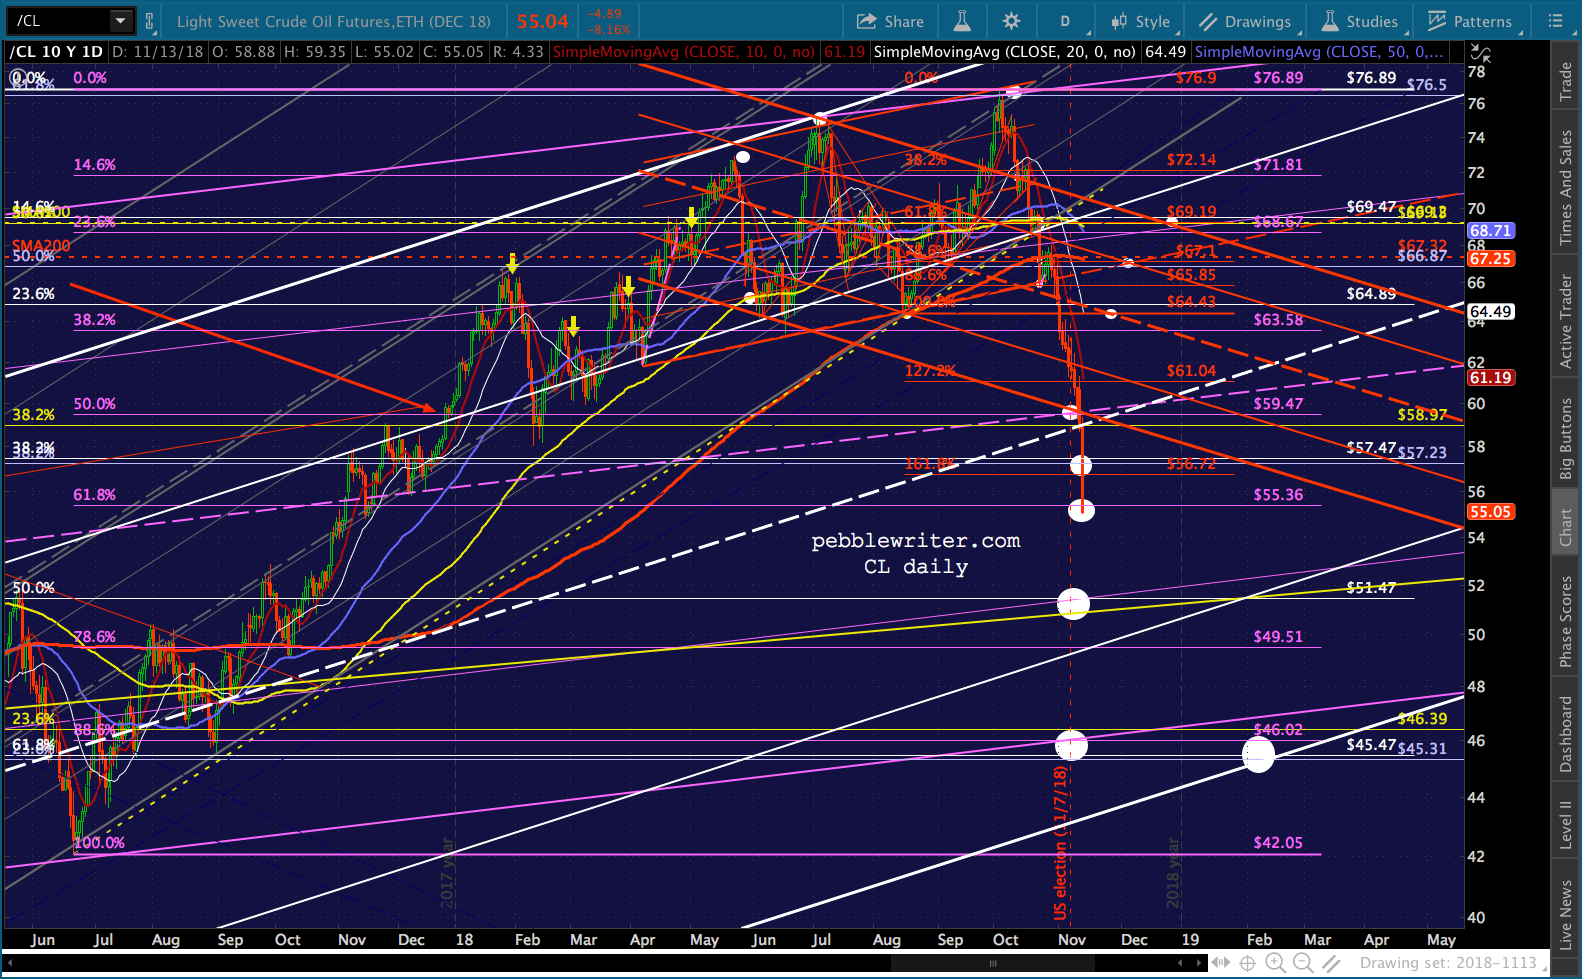 RB is threatening to test its yellow channel bottom, but the purple .886 could provide an interim bounce.
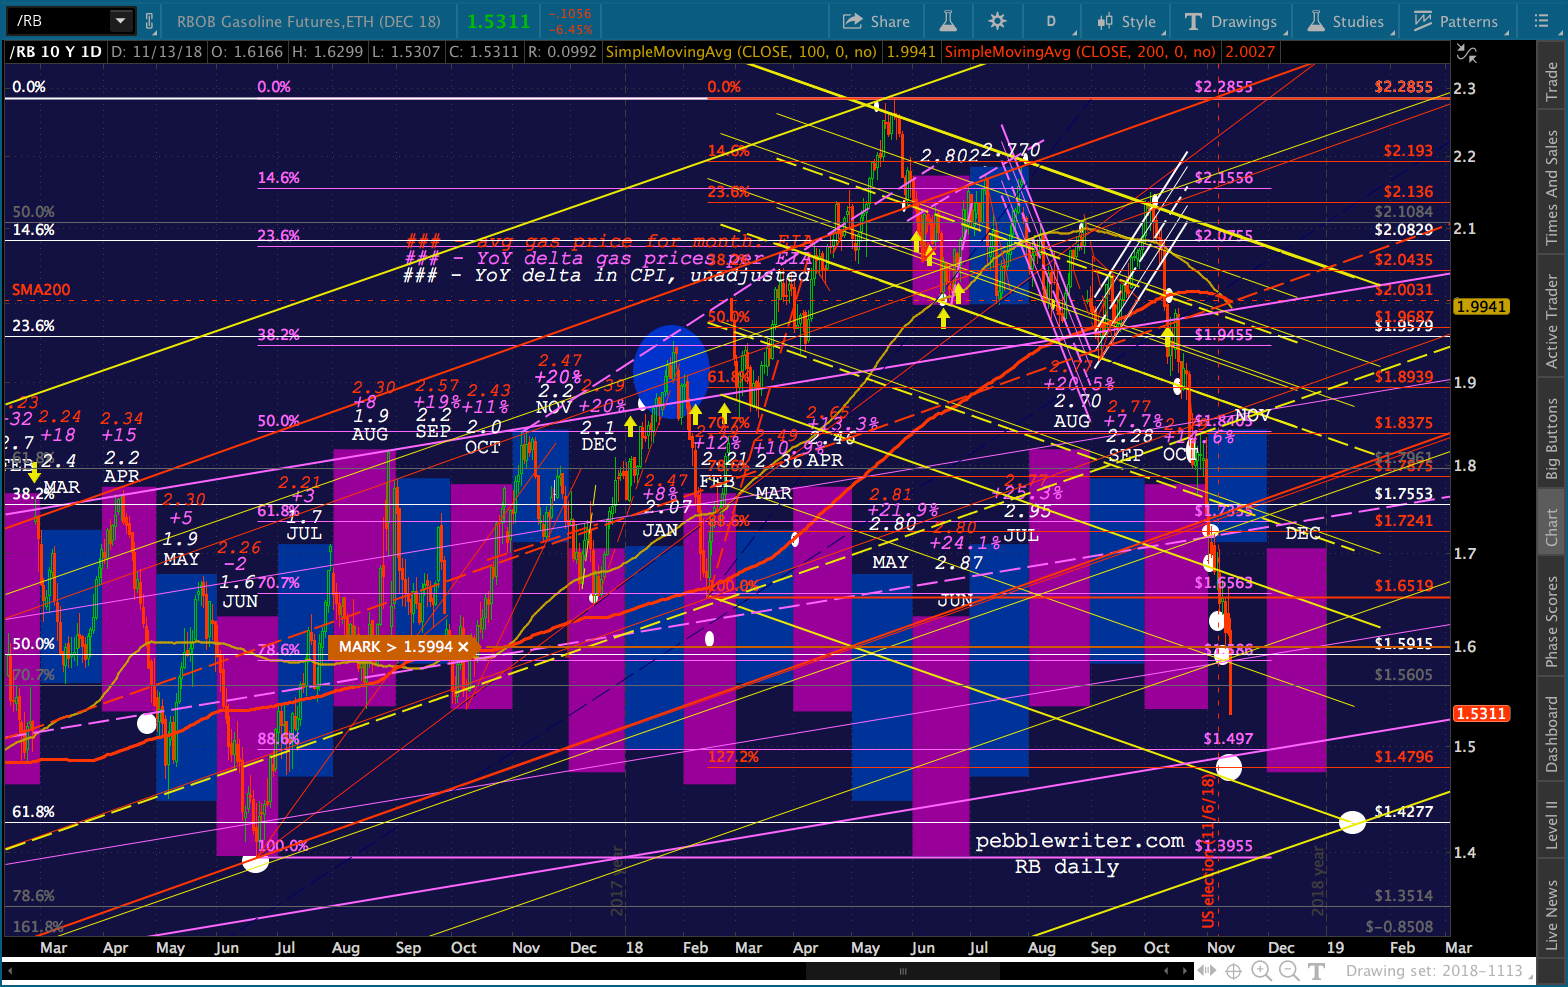
more later…