

CL just reached our next downside target of 59.47…
 …and, RB has reached our target range of 1.58-1.62. This is important support for both which, if broken, would portend much more downside.
 This completes a nearly 23% gain for CL and a 25% gain for RB since our Oct 3 top call [see: VIX Takes the Plunge] and brings our YTD gains to 155% for CL and 158% for RB.
As we detailed yesterday, this move was as much about politics and chart patterns as it was about supply and demand [see Trump: Falling oil prices…that was me.”] Now that the election and the Fed’s latest meeting are over, we can focus on November CPI. Ultimately, oil and gas’ path forward will decide much about interest rates and broader markets.
continued for members…
59.47 is the intersection of the rising purple channel midline, the bottom of the falling red channel and the purple .500 Fib line. If it fails, there are much lower targets that would come into play: the gray .382 at 57.47, the purple .618 at 55.36, the gray .500 at 51.47 and the purple .886 / white .236 / gray .618 at 46.02. Note that CL also came quite close to the white .382 retracement of the drop from 112 to 26 — a typical retracement for a retreat from the .618 at 79.32.
 If it bounces from here, the leading candidates are the previous low and falling red channel midline at 64.43, the SMA200 and rising red channel backtest at 67.1 and the white .618 and red channel top at 69.19.
 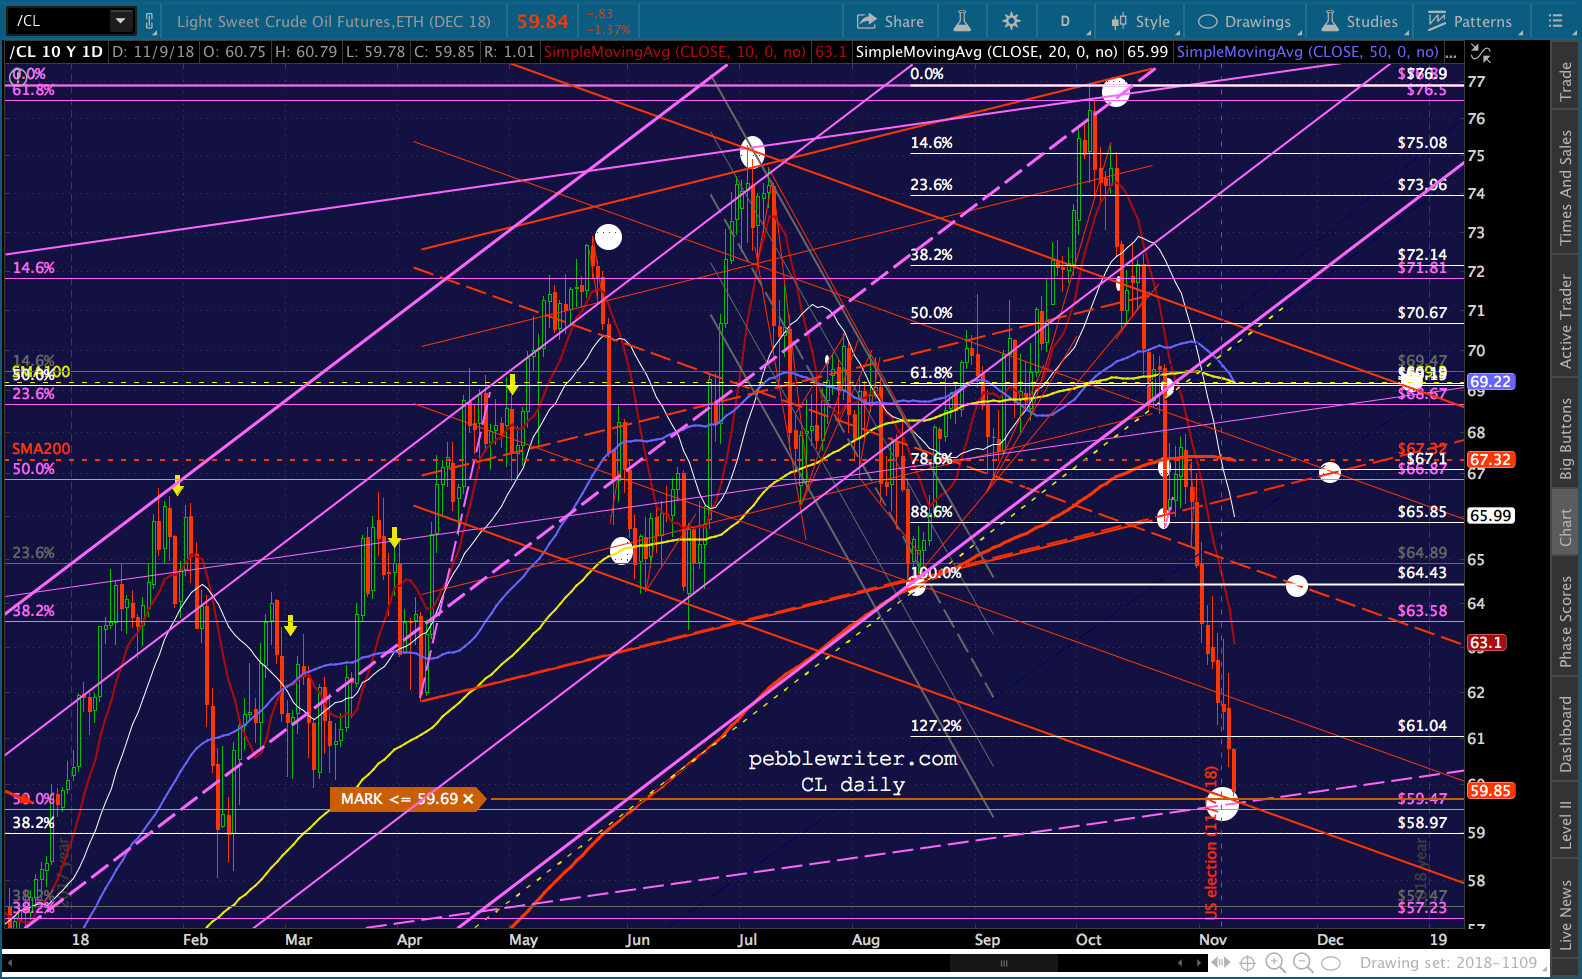 While 59.47 is potentially low enough to get CPI back under control, it should leak a little lower intraday to facilitate RB – which the charts show could really benefit from tagging 1.58ish. There, it would enjoy not only red .786 Fib support, but channel line support as well.
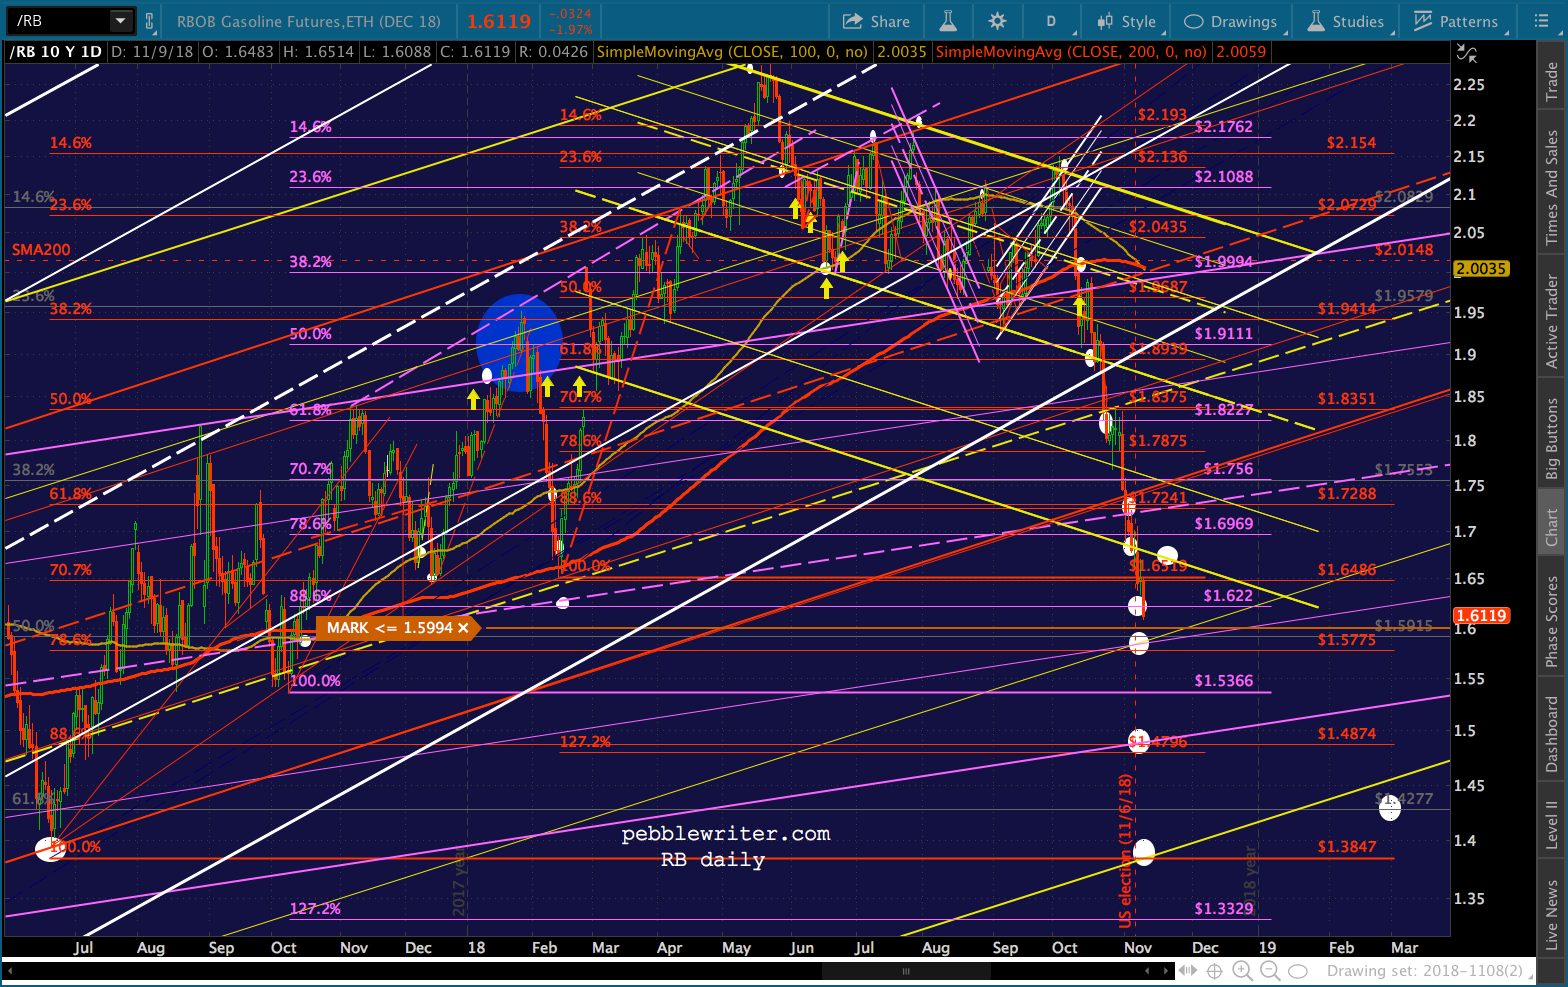 If that support doesn’t hold, there isn’t much help until the purple channel bottom at 1.48, followed by the previous low and yellow channel bottom at 1.3847.
  If RB catches a bid here, we can look for it to backtest the broken yellow channel at 1.67ish, the broken red channel at 1.75ish, and the yellow midline at 1.84ish.
 Futures are off about 18 points this morning, dropping slightly below the horizontal support at 2800.
 The drop is being facilitated by oil and gas’ drop, VIX’s manicured rise and USDJPY’s pullback. So, I continue to expect at least a backtest of the SMA200 (2764.67 and dropping slowly) as the SMA10 rises to meet it over the next day or two.
  Many of our factors, however, argue for a much larger drop.
The 2s10s has clearly broken down.
 And, VIX has bounced nicely off its SMA200.
  While the red channel breakdown has aided in the latest equity bounce, previous moves above the SMA200 have produced very sizeable drops in SPX. The trick for bears would be in getting VIX up past 27ish.
 And, USDJPY faces yet another important test of overhead resistance. A failure to punch through (remember, this is a backtest of the broken white channel) would be quite bearish for stocks.
 For SPX, this translates into at least a backtest of its SMA200, currently at 2763.49. If they stretch it out till later next week, they can flesh out the rising red channel and backtest the yellow midline at the same time.
 If I massage ES’s rising channel a bit, next Tuesday looks like a very good possibility.
 As we’ve seen in many past meltups, backtest opportunities are sometimes ignored in pursuit of “higher at any cost.” But, by the same token, the past 9 months have seen a few backtests break down and open the door to big plunges.
Don’t be in a hurry to go long on RB, as it probably has further to go. CL might get a playable bounce, but stops are a very good idea. We don’t know the exact level at which CPI can be brought down to a level acceptable to the pols or, more importantly, the Fed.
VIX has more upside as long as it holds the little red TL – parallel to the purple one which served us well last month. This remains a time to be cautious. Only stay short over thefb weekend if you can handle the gap risk. Our yield curve model says we could be in for considerable downside. Remember, SPX doesn’t like breakdowns of the rising or horizontal support or breakouts above falling TL resistance.
 And, right now, we’re seeing the latest rising yellow TL break down.
 If COMP doesn’t hold its SMA200…
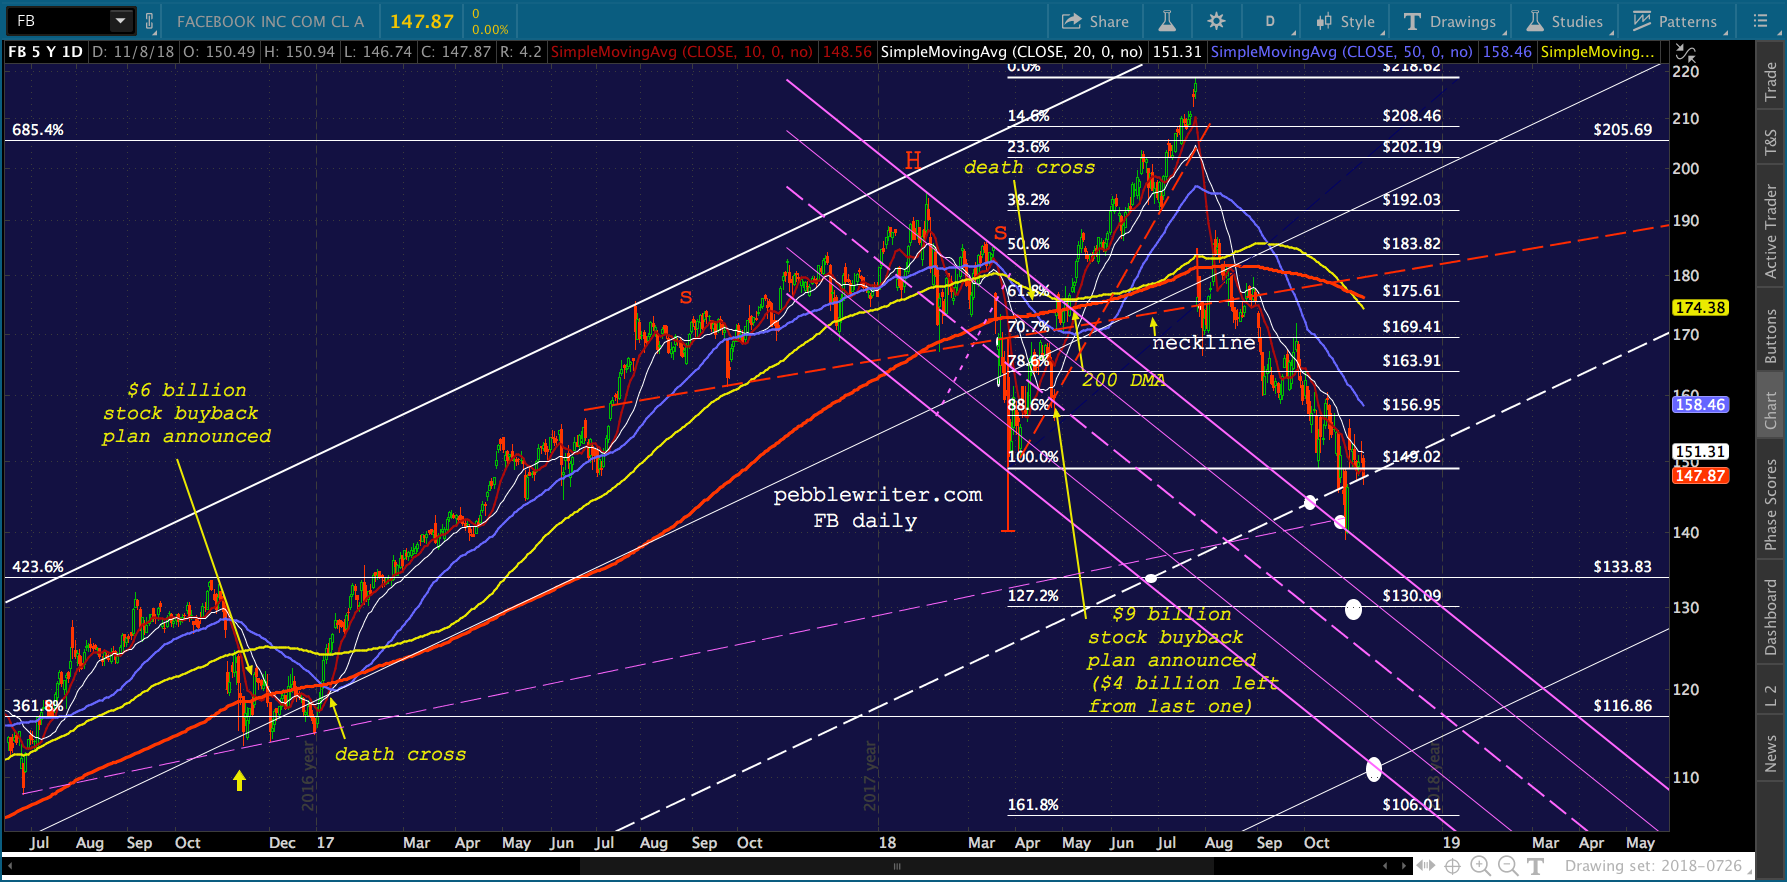
 …then, AAPL and FB could easily pace it to a 10% loss.
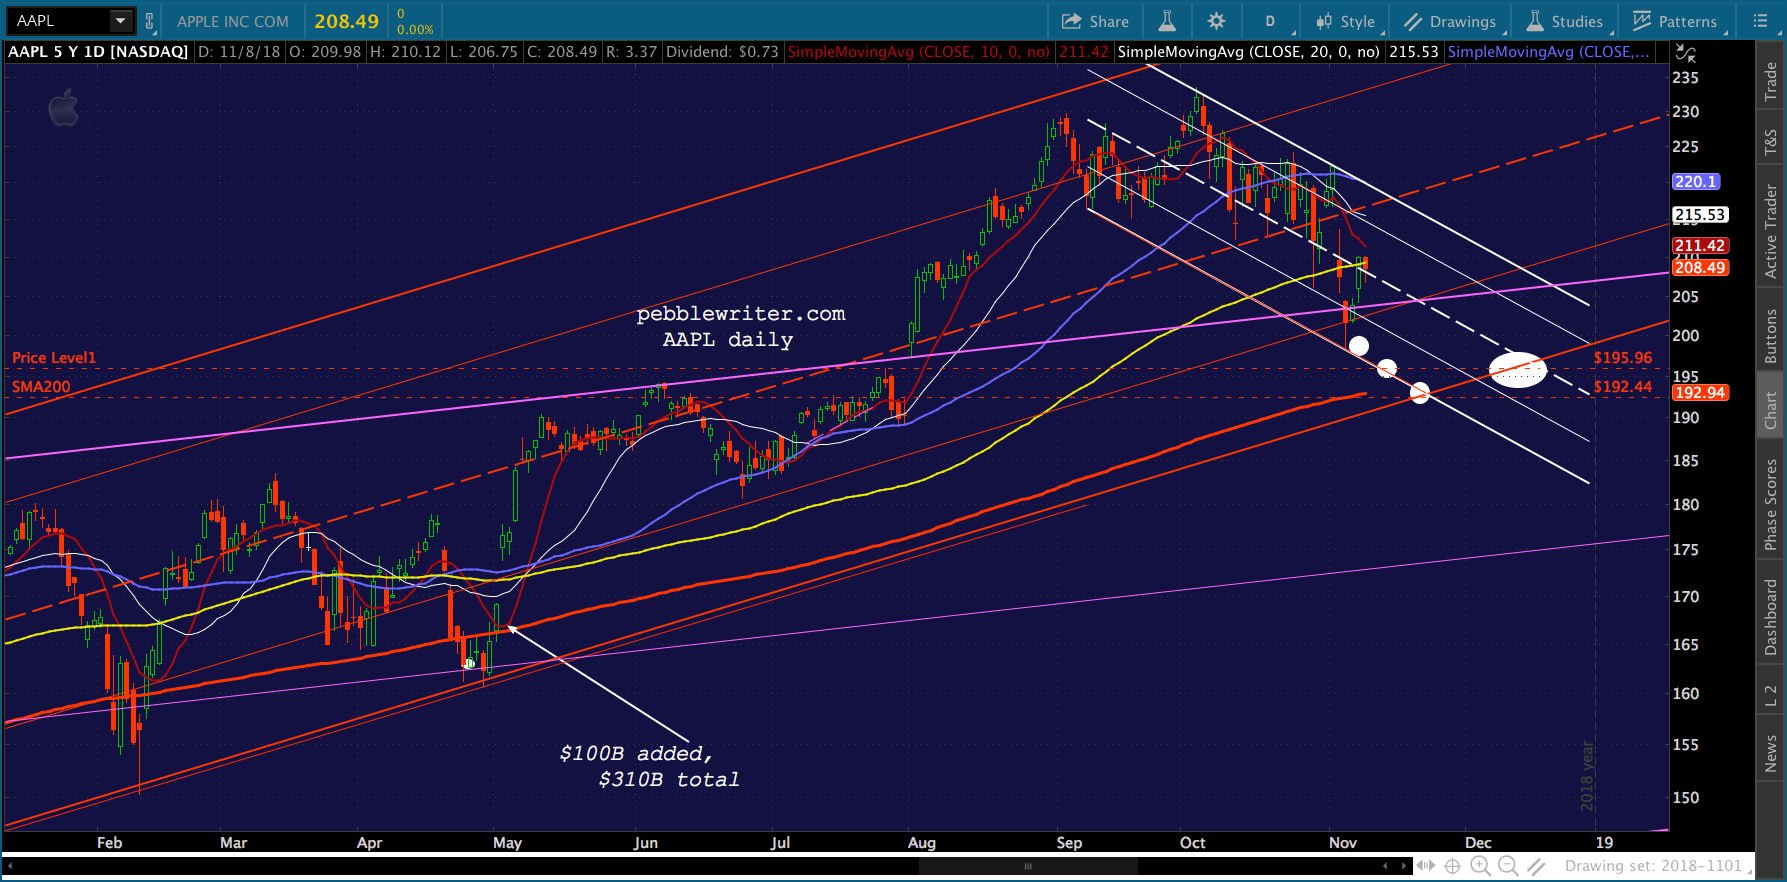
 If that should happen, it’s highly unlikely SPX would hold its SMA200!
I’ve been working some pretty crazy hours lately, so I’m going to get an early start on my weekend. I plan on taking Monday off, but we’ll see how things go.
GLTA.