

One glance at the Philadelphia Fed Index this morning, and you could find yourself wondering whether Powell was really talking about the “rest” of the world. Yet, the Fed supposedly remains hawkish. Never mind that the 10Y and the yield curve are telling us the rate hikes are drawing to a close.

 continued for members…
The IH&S is looking less likely today than it did yesterday.


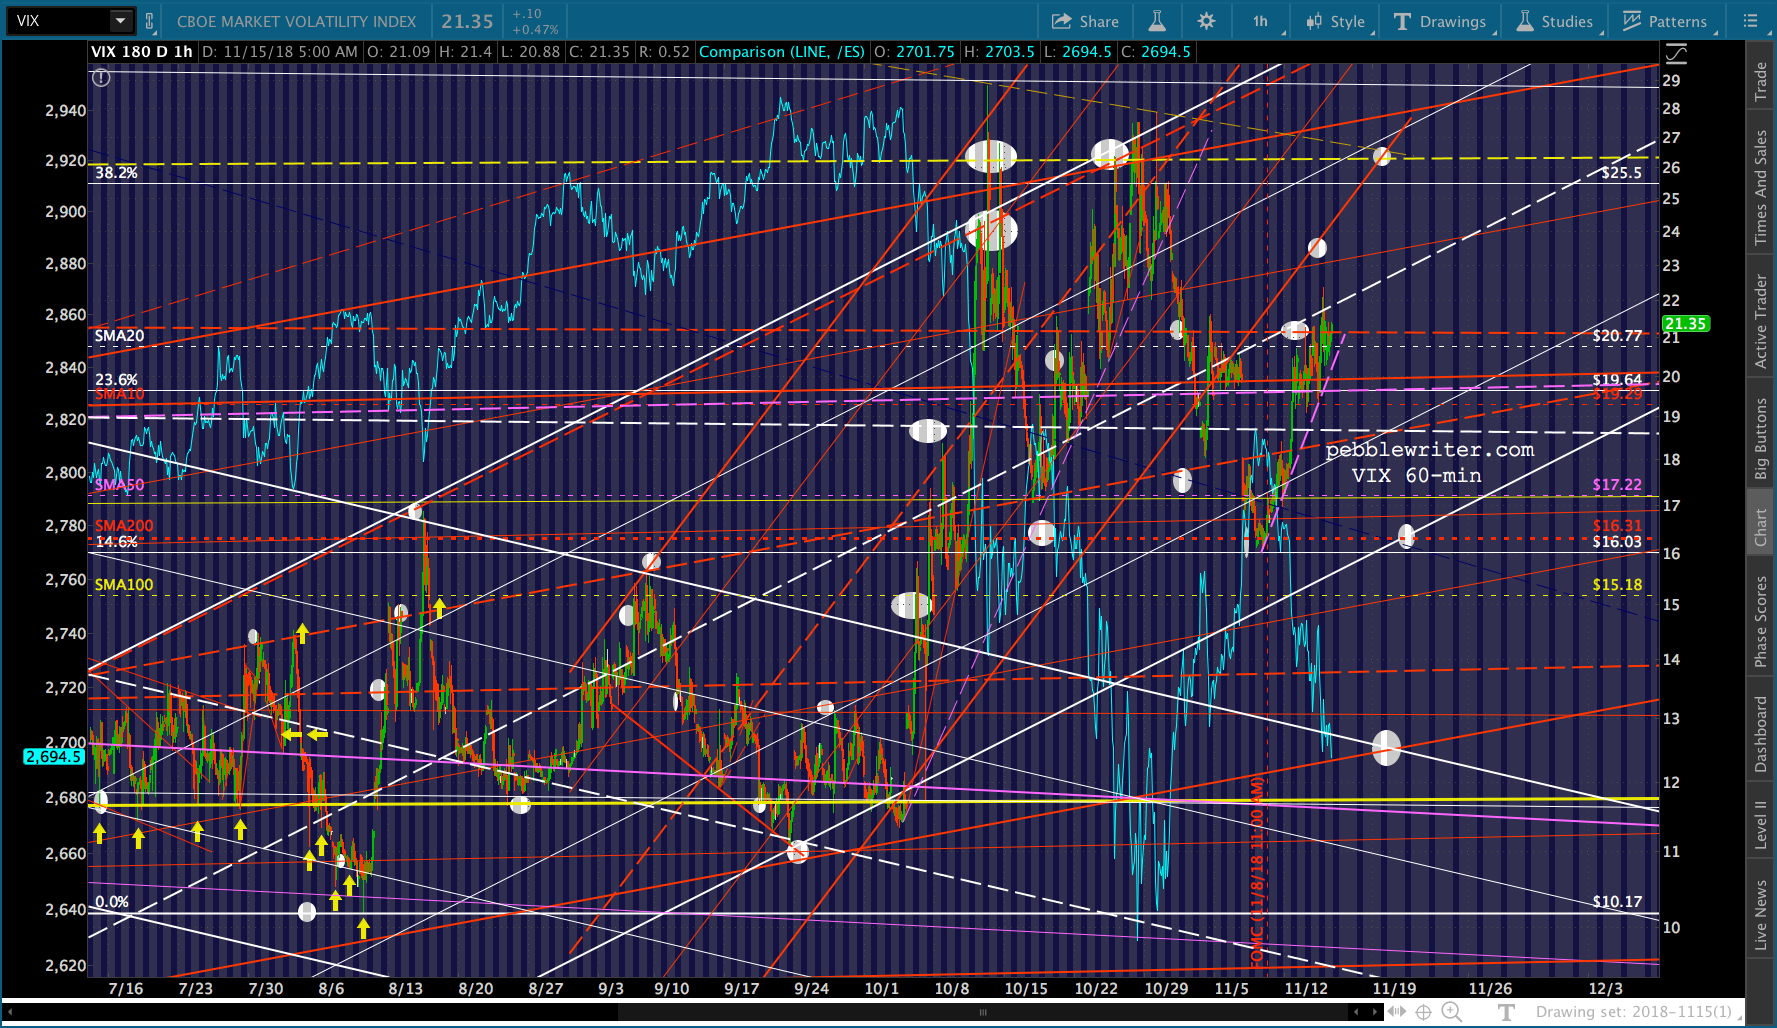 SPX is more likely to follow COMP on down, with a completion of its H&S at 2605ish seeming very likely.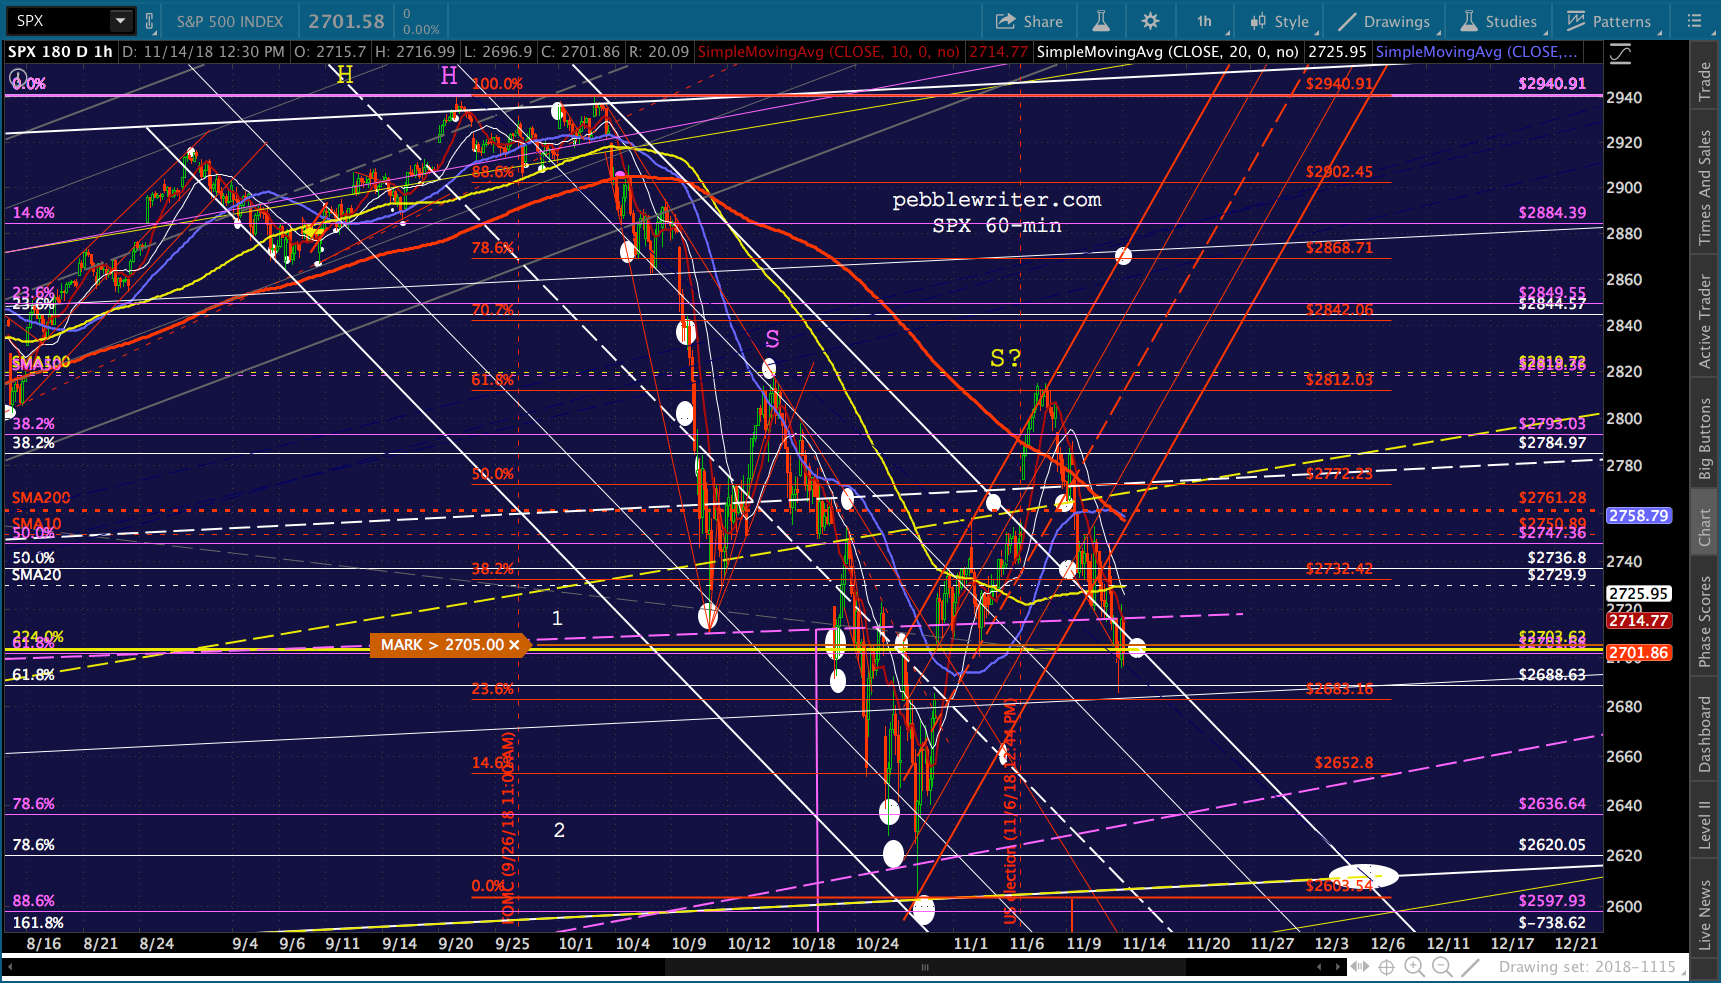
 USDJPY could be helping, but it’s not.

 Though the dollar has refused to top, gold is making steady upward progress.
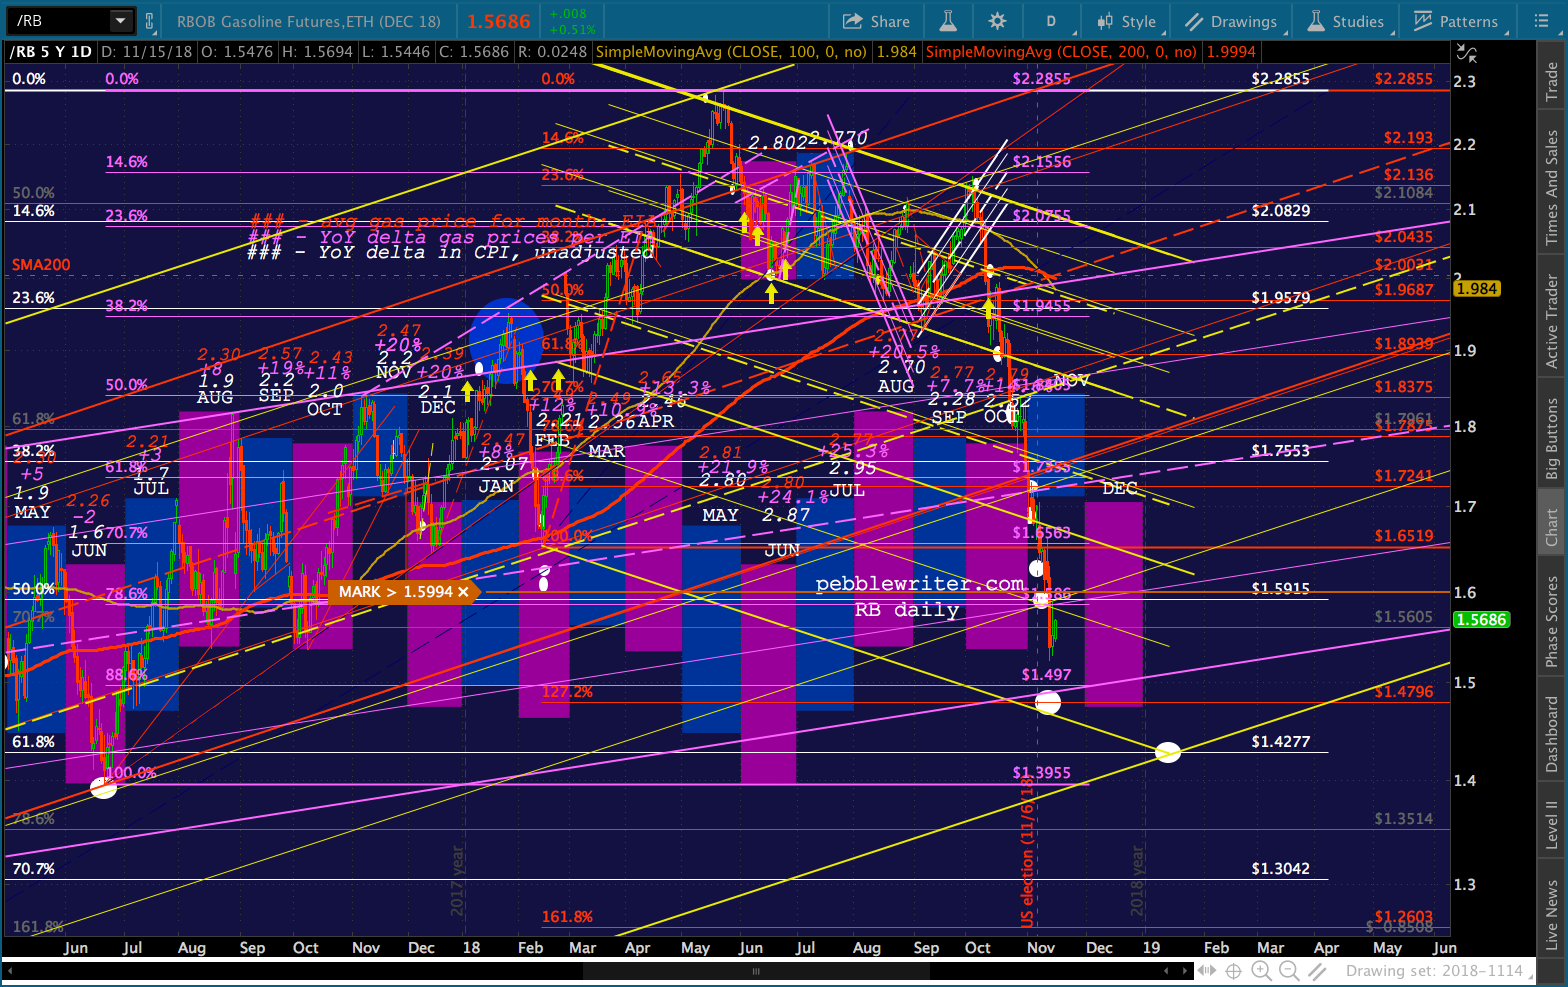
 And, though they haven’t made new lows yet, RB and CL are making a minimal effort to prop up stocks.
 UPDATE: 12:45 PM
I received a question from Michael N. earlier that others might be interested in. The question was whether the yellow channel line in CL was important. While channel lines are broken all the time, this one could be important.
Besides intersecting with the .500 Fib retracement at 51.47, this line is the .236 channel line of the large, yellow channel on the weekly chart. It’s easier to see here. It’s also easy to see that this channel has several flaws. The 2001 and 2009 lows don’t do a very good job of hitting the .236 line. The 2008 high is way short of the channel top. I chose to base it on the lows, reasoning that we’re unlikely to see CL drop below 26.05 — an important .886 retracement. We’ve had enough action around the .236 line since Mar 2015 that it seemed like a good guideline.
But, obviously, we saw several dips below it in Jun-Dec 2016 and May-Sep 2017. For a downside target, I “like” 45.47-46.02 much better. But, reaching it now would not tag the white channel bottom as well as if CL waits until Feb 2019.
Hence, I anticipate we’ll soon get a bounce around the end of November which delays the ultimate low until Feb 2019. I’m currently following a model which suggests that SPX will gap down on Monday or Tuesday to 2648ish, bounce for a few days, then down to 2608 around the 27th. This is a little earlier than the COMP chart suggests, so I’ve moved the COMP target to 6736 on Nov 27.
 Re DXY, this one is also difficult. The USD is being propped up, no doubt. But, there is .618 Fib resistance and the white channel top at 97.873.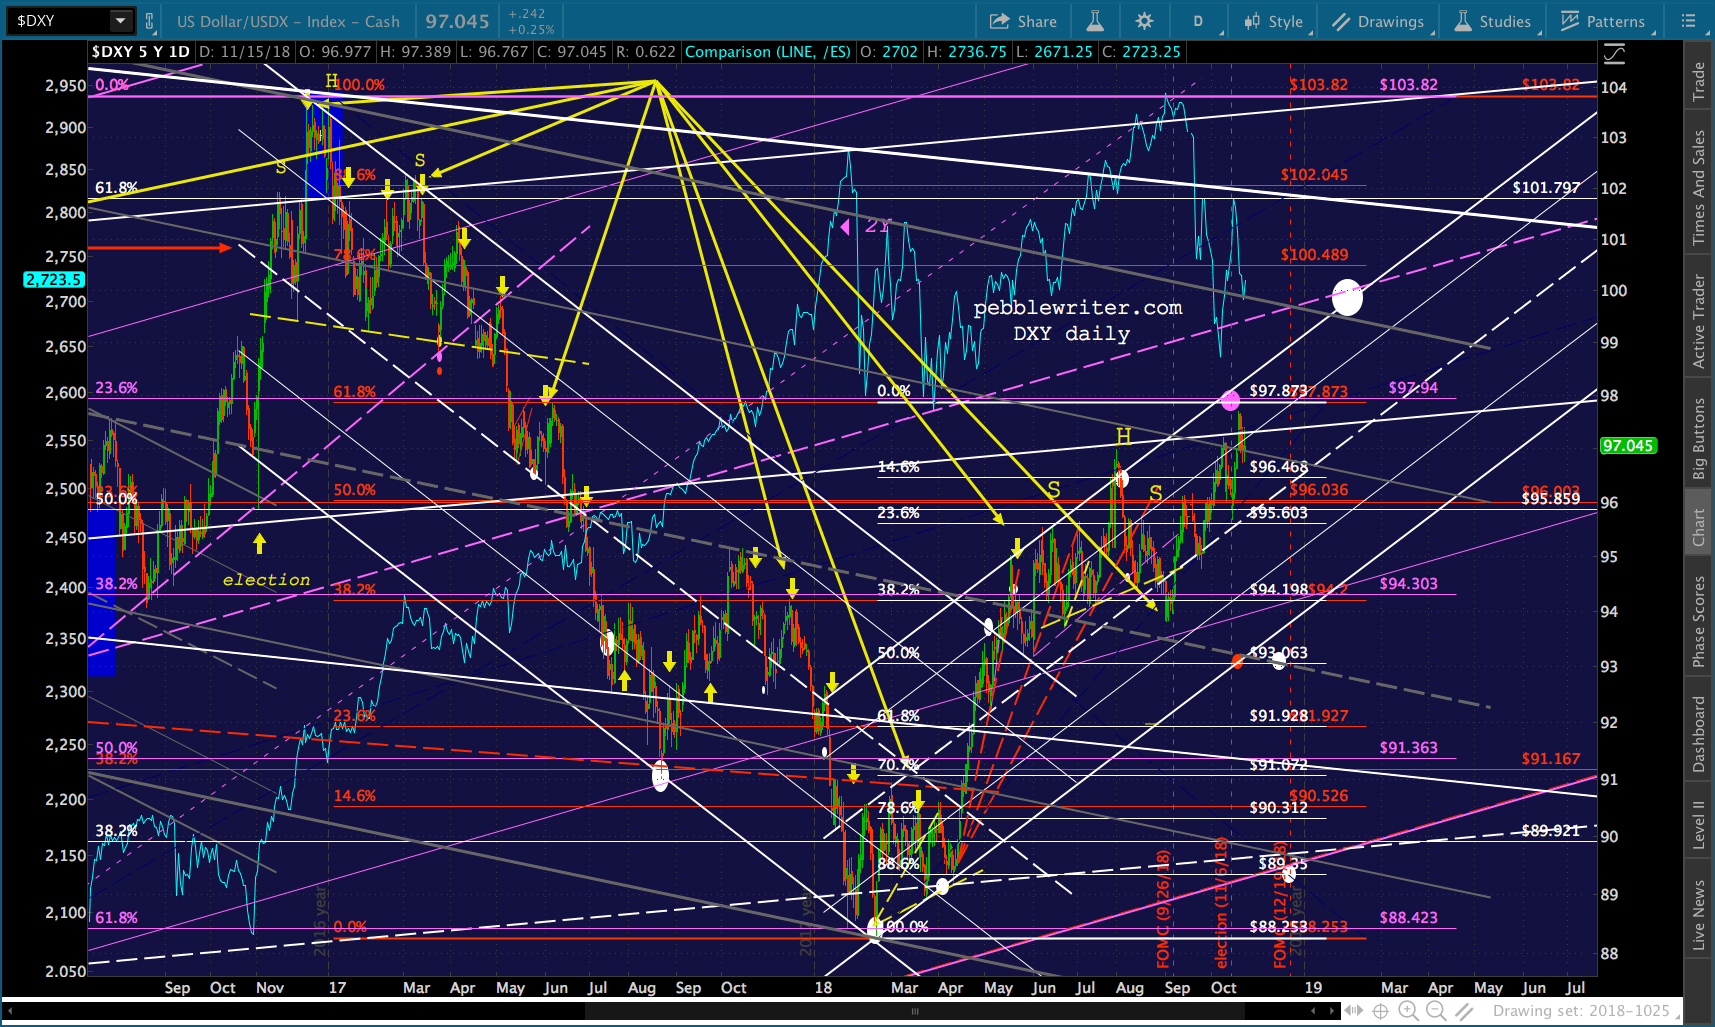
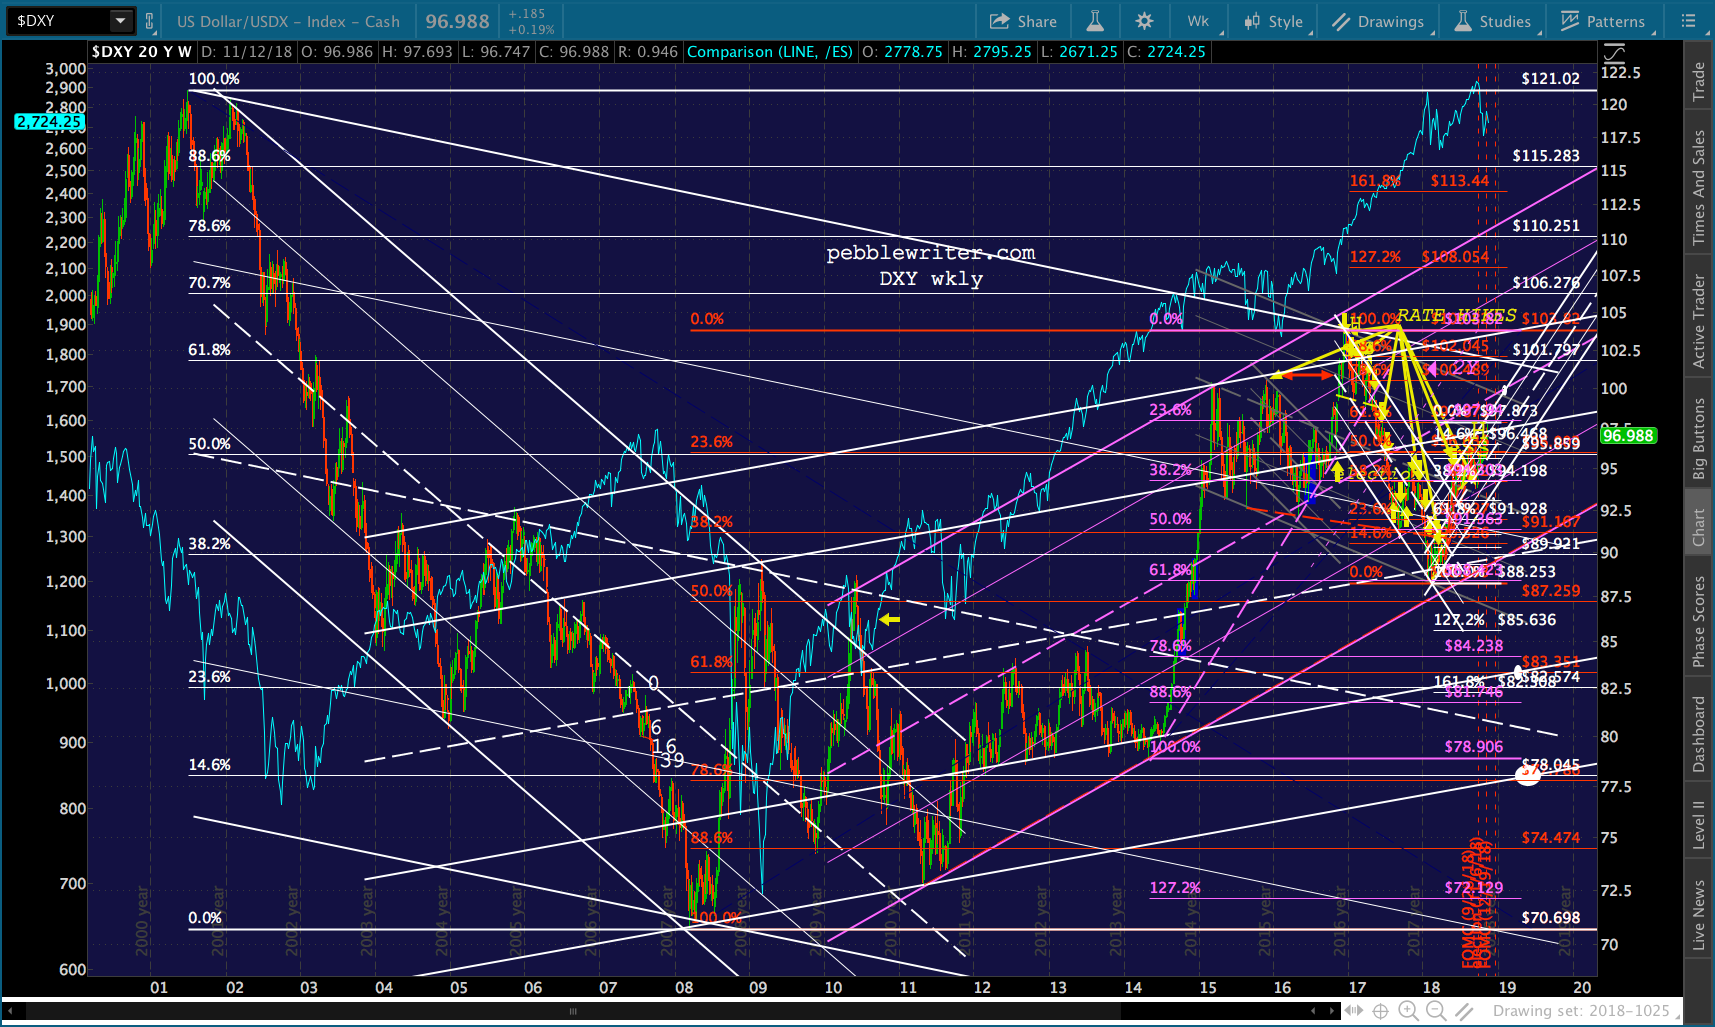
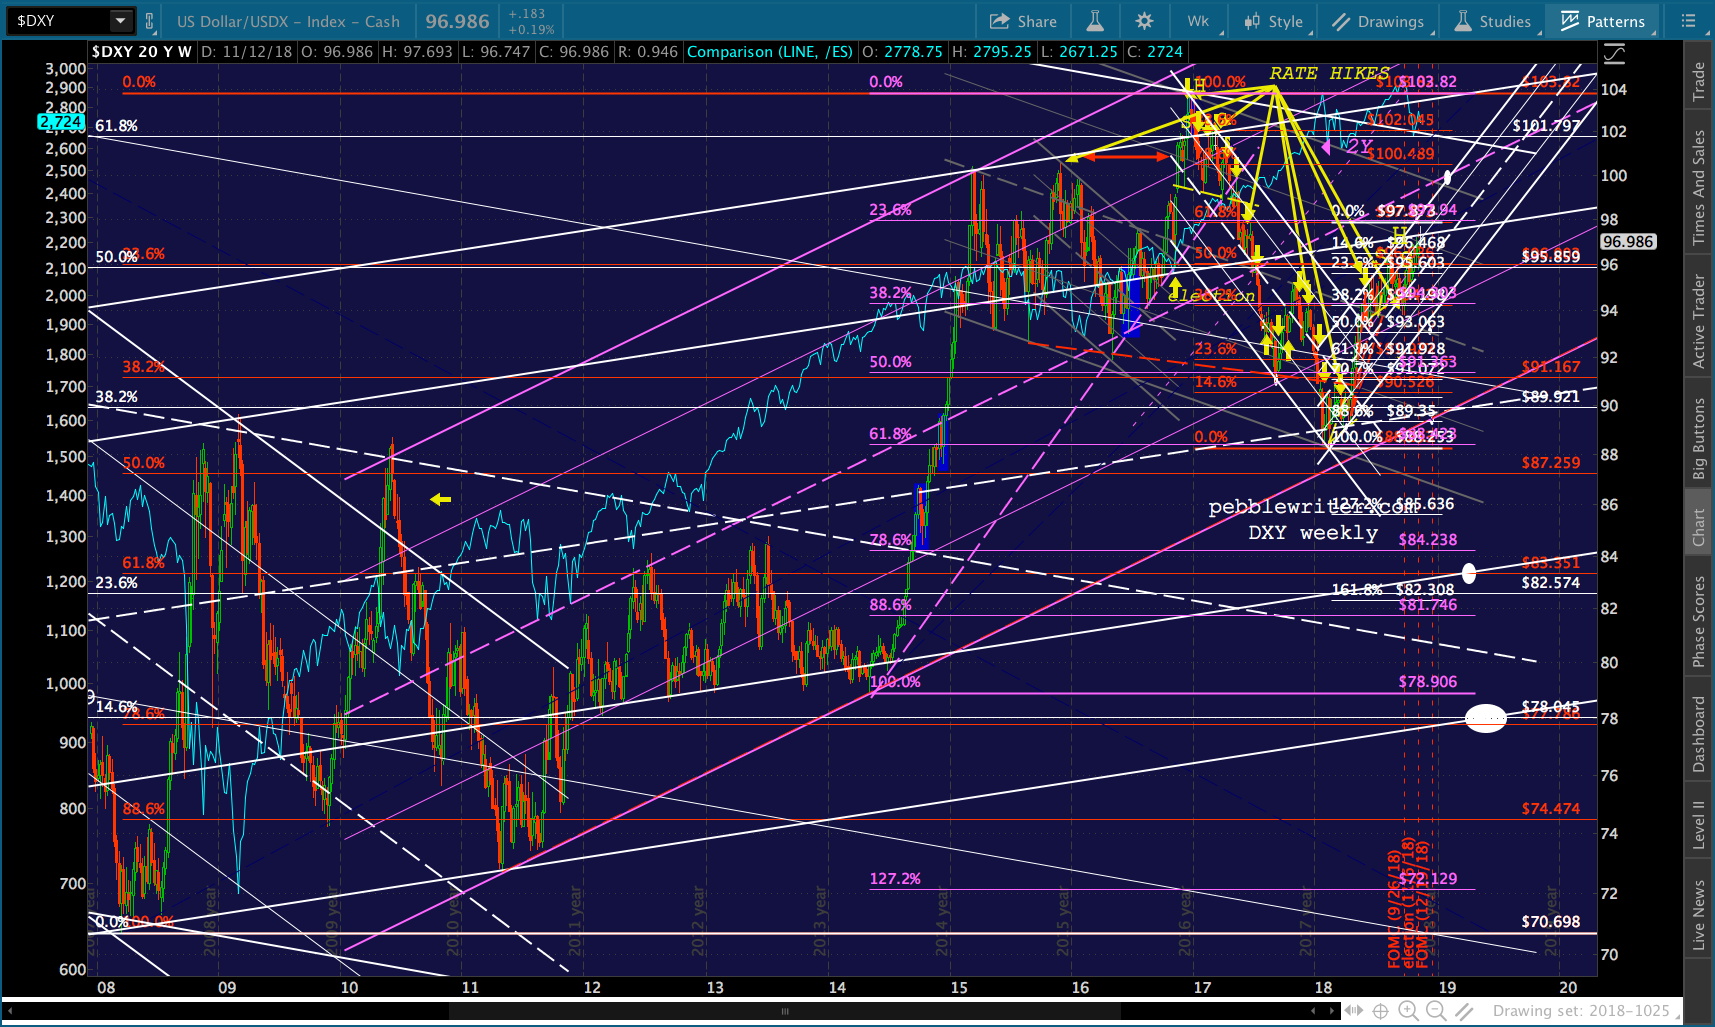 This is where I think we’re headed.
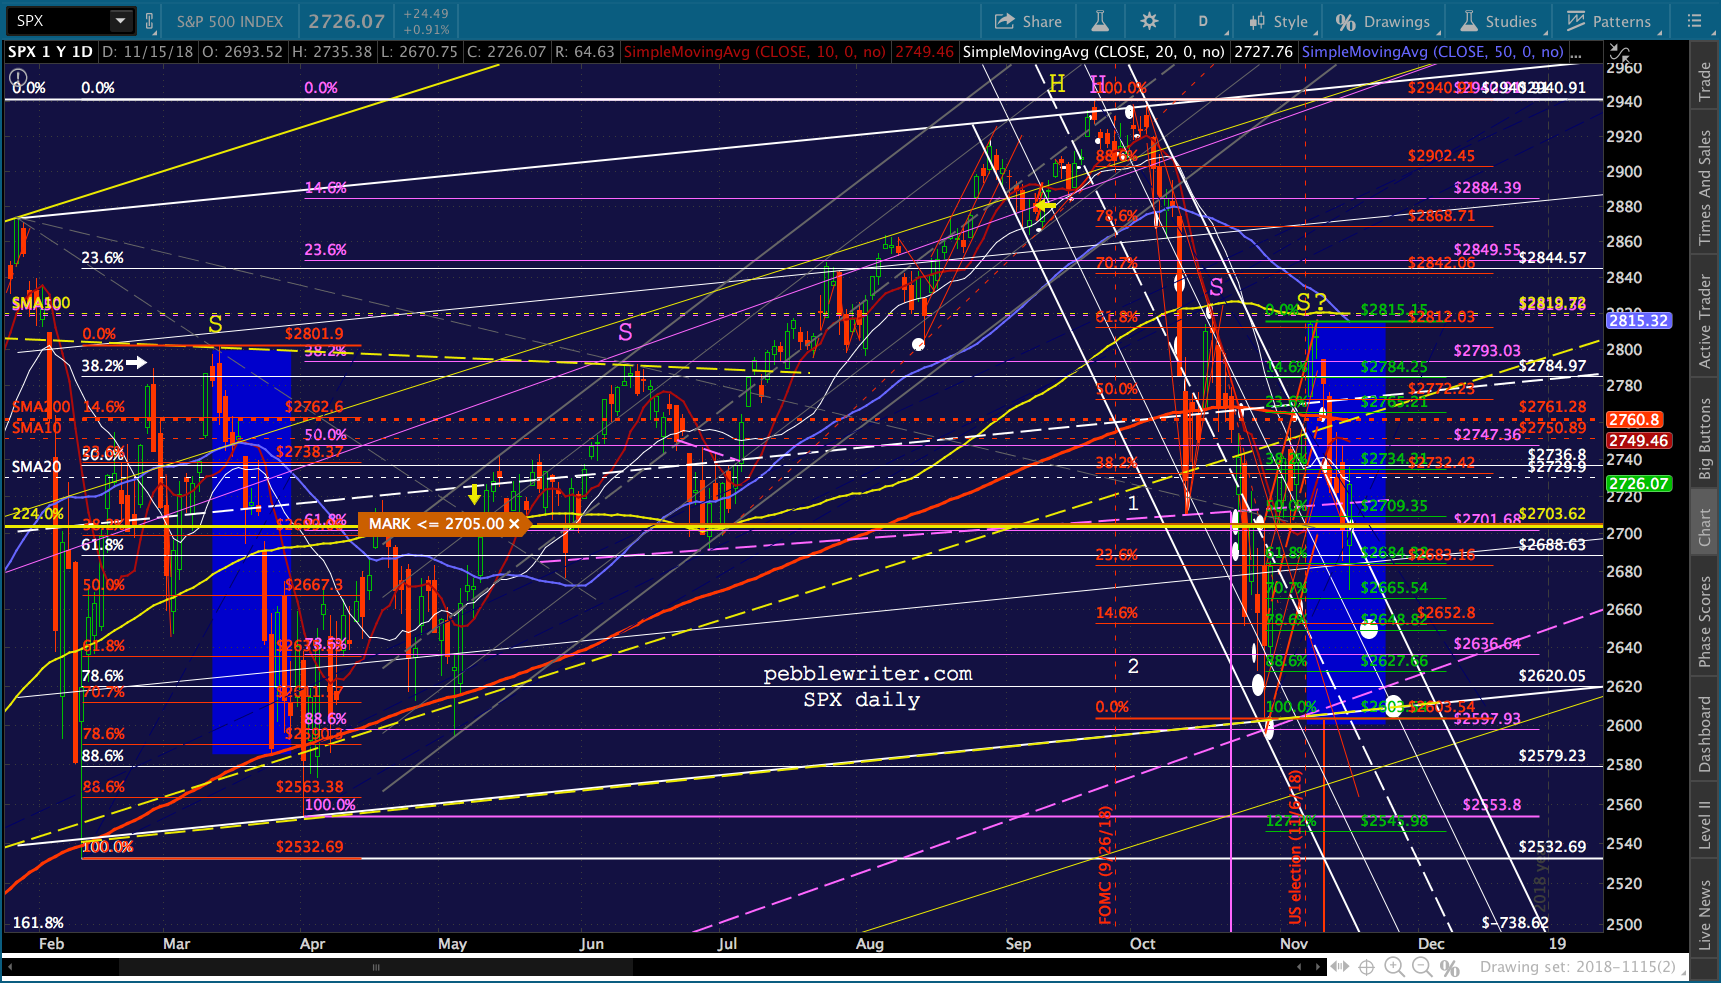 Interesting that ES has stopped short of its 2.24…
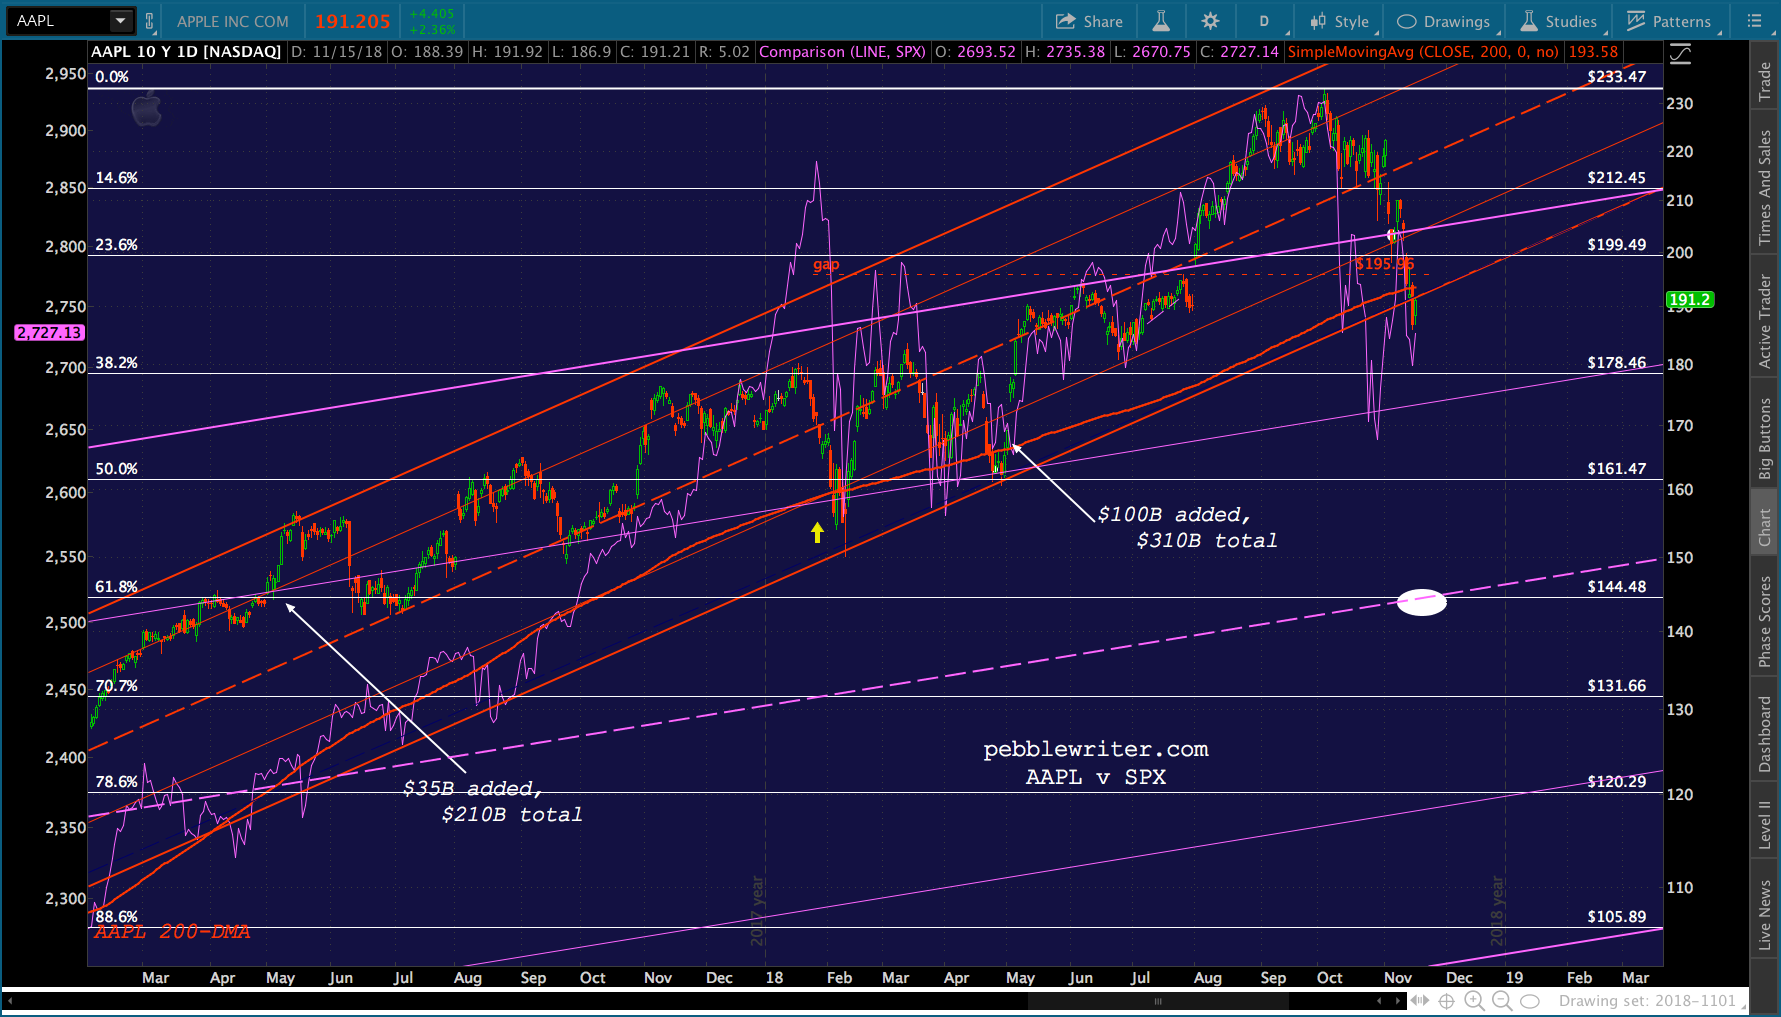
 …and AAPL has stopped short of retaking its broken channel.
 Just read that Trump is considering turning Fethullah Gulen over to Turkey’s Erdogan, who accuses Gulen of instigating the 2016 “coup.” Let me see if I got this straight…
Erdogan gets Gulen in exchange for letting up the pressure on Saudi Arabia and MBS — something he doesn’t really care about anyway. MBS gets away with murder in exchange for helping crash oil and gas prices in time for the election and Dec FOMC meeting. Trump gives up a guy (Gulen) who means nothing to him and looks the other way on Khashoggi in exchange for lower oil and gas prices and the accommodation for MBS. Everybody wins except for Gulen, Khashoggi, and MBS’ underlings – who might just lose their heads. Seems like the kind of deal the CIA might have cooked up.
Comments
4 responses to “Powell: Slowing Global Growth”
The yellow line on Crude? Is that a strong magnet?
The DXY purple target 97.83, is that a strong magnet?
I addressed the crude question in the 12:45 update, as I think many might be wondering the same thing. Will add the DXY chart in a moment.
Thanks for the focus.
Heading into Dec18-19FOMC, if oil is low ~ slowed inflation
AND dollar is strong > 95 and the FED raises rates as planned, this seems like recipe for “Policy Mistake” label. Could the market dip and then rip up high enough to help justify the rate hike, seems unlikely? Your last paragraph on geopolitics is a good point, might make more sense in hindsight by February?
Yep, I think it’s either a policy mistake, or….it’s possible they’ll bail on the Dec rate hike if CPI is low enough as a result of the oil/gas crash.