

As expected, the BoJ took the path most beneficial to stocks — leaving rate targets where they’ve been (negative short-term rates, the 10Y at 0%) and mumbling something about being more flexible the future as they continue to strive for 2% inflation.
The actual goal, of course, is to prop up stocks while they try to find a way out the equity trap into which they’ve put themselves. This means further deflating the yen, which sent the USDJPY higher, which propped up stocks overnight. This is in line with our outlook on the yen, and facilitates the euro outlook as well. We’re completing our tenth week of currencies consolidating around a tightening range. It’s also known as coiling…as in that thing a snake does before striking.
Were the FAANGs not flaking, stocks could continue to rally in such an environment. But, the FAANGs are indeed in trouble, with several of them in real danger of breaking down. When we last took a look in April [see: Is the Market About to be De-FAANGed?], things were looking dicey. Now, they look downright scary.
We’ll take a look at them individually and see whether they have further to go.
continued for members…
ES is rallying with the rise in USDJPY, but I continue to expect a headwind in the form of RB and CL prices.
 Despite the yen weakness, DXY continues going sideways.
  …as does EURUSD — maybe helping DB up and over its SMA100 (missed it by .02 yesterday.)
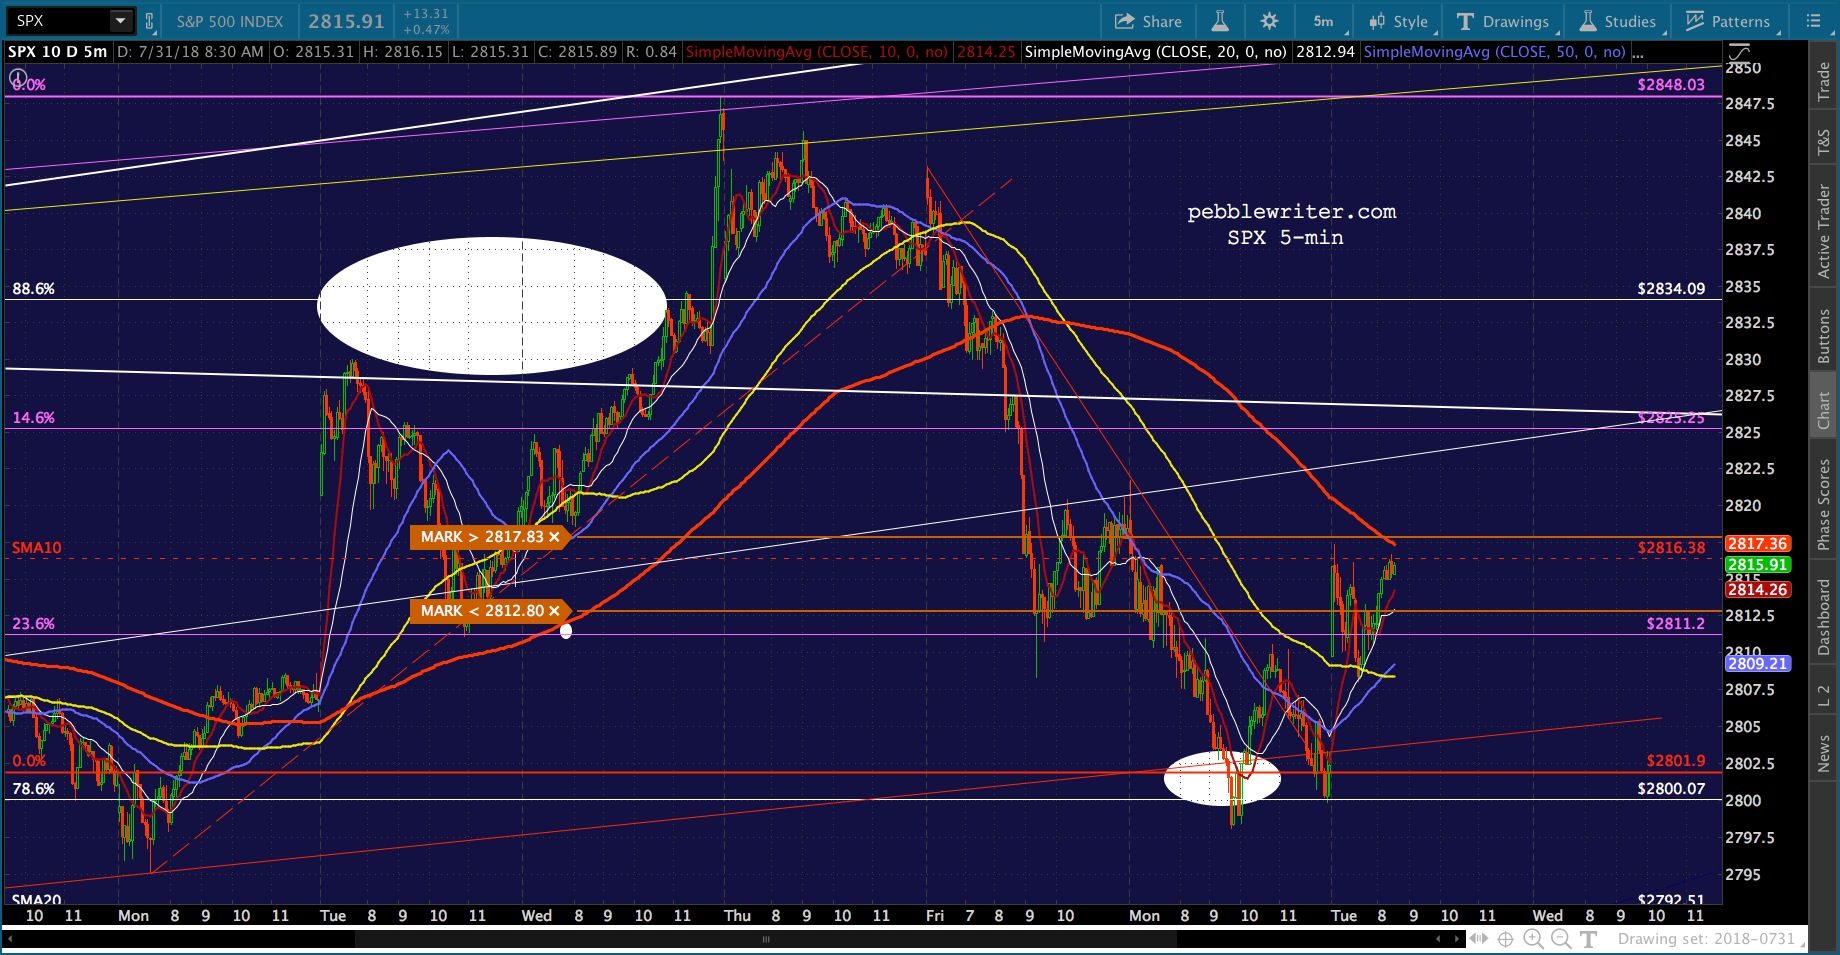
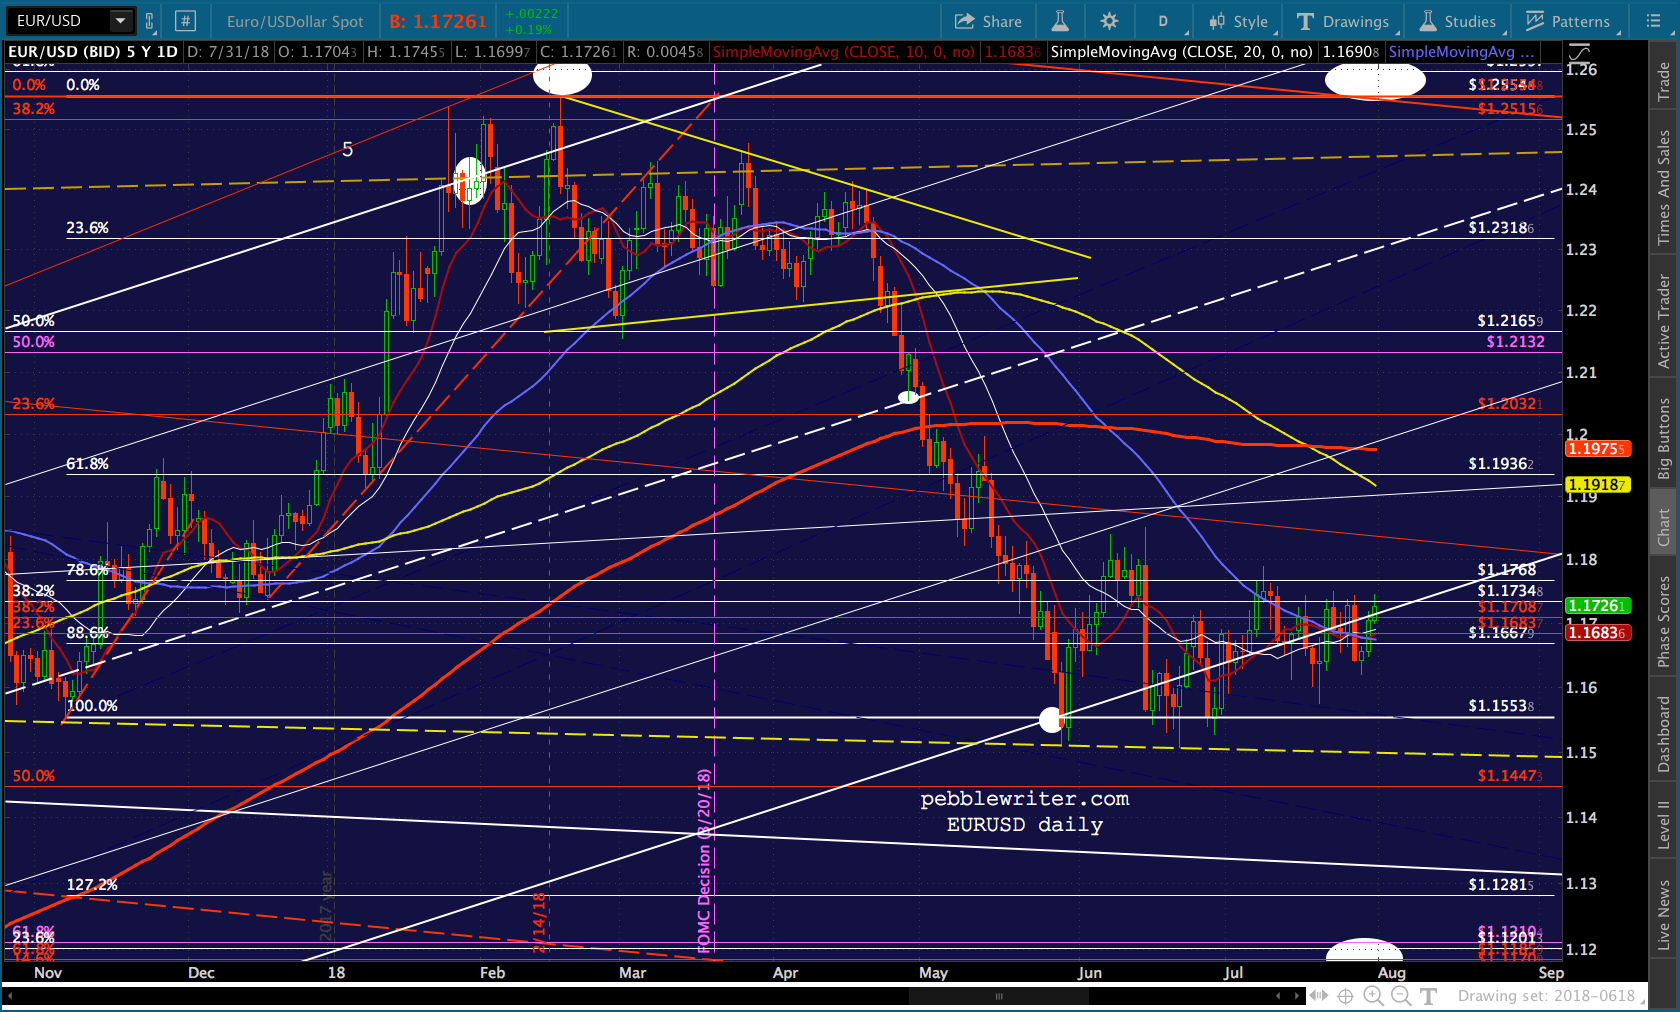 This leaves SPX facing potential continuing weakness…
 …which, considering RB and CL have further to drop…
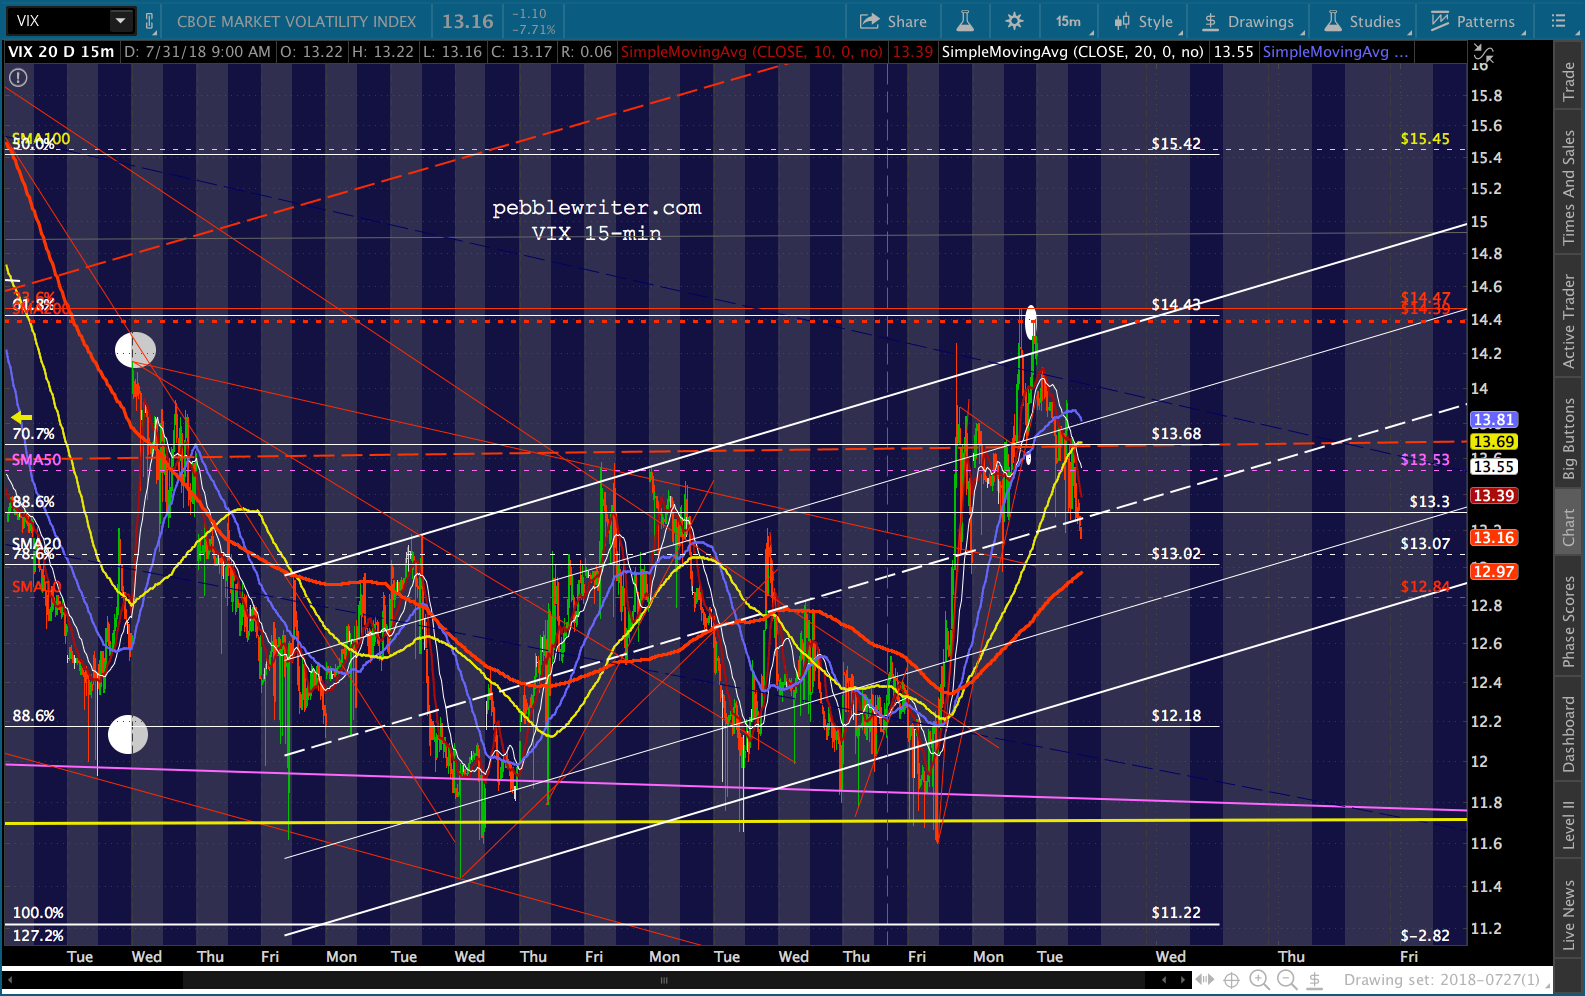
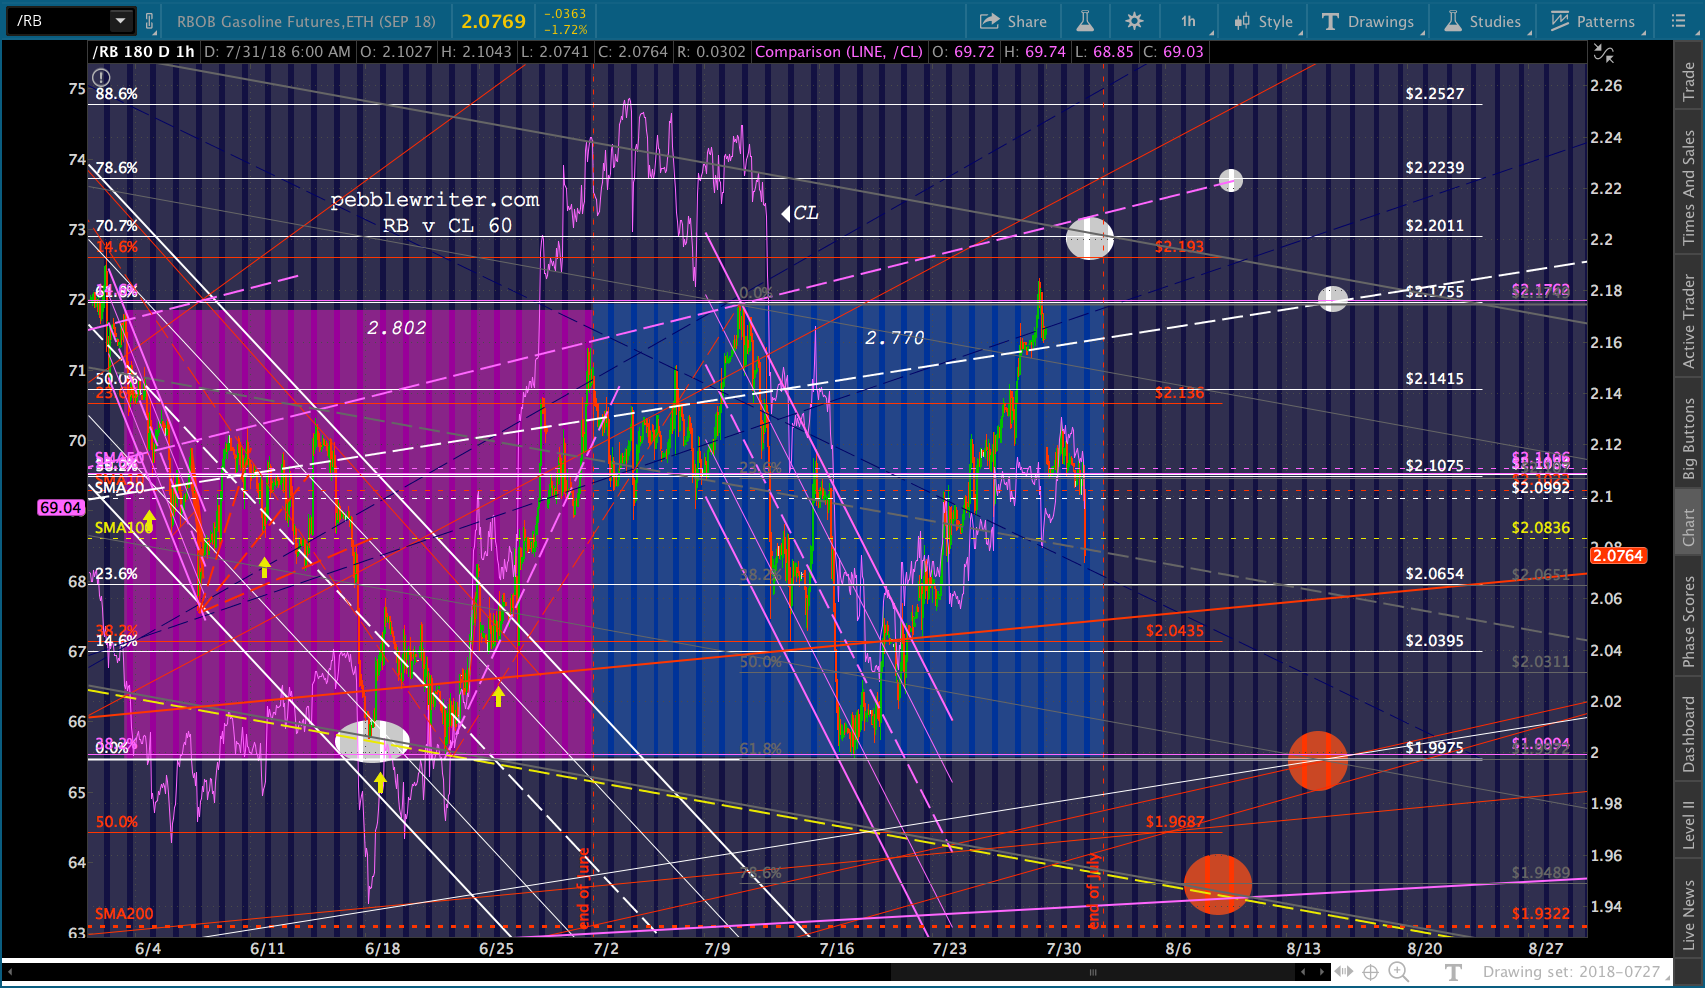 … leaves only further rises in USDJPY and crashes in VIX to keep it afloat.
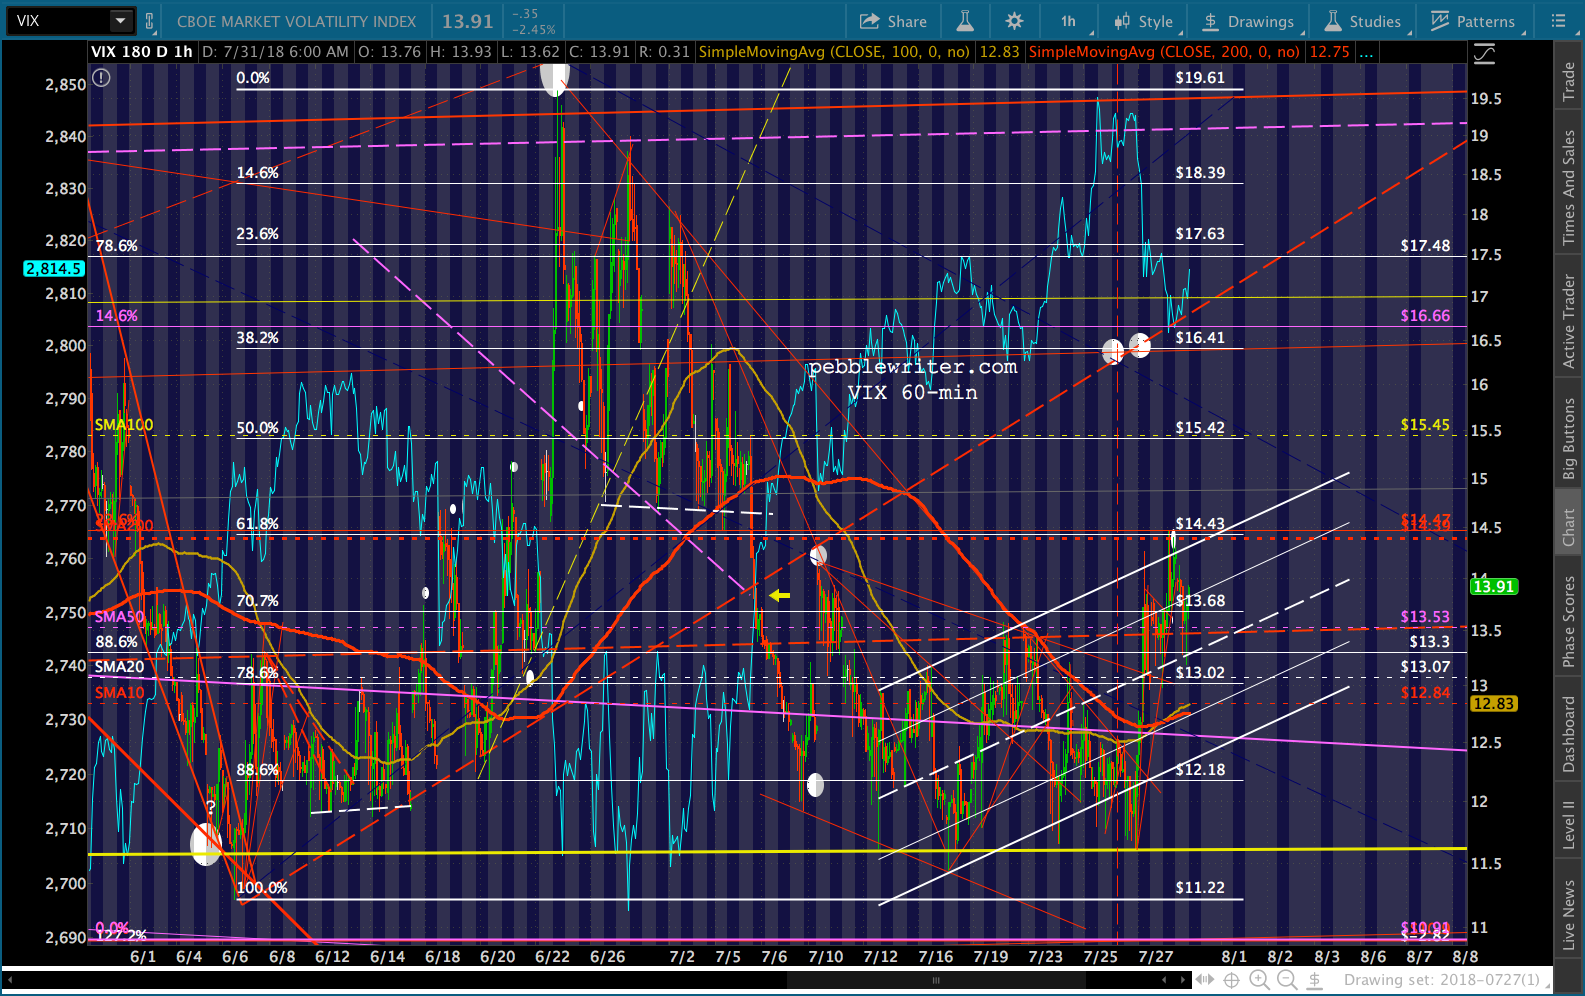
 We’ll start with AAPL, which recently broke trend again but is still levitating above its 2.24 – an important line in the sand that it first reached over two months ago.
 Zooming out, we can see that AAPL has a more serious problem than just the 2.24: the top of the rising purple channel which touched off the last major decline.
 If it drops below the 2.24, the next serious support isn’t until the bottom of the rising white channel it’s been in since Mar 2016. Note that the SMA200 is right there on the channel bottom, currently at 176.22 — a 7.4% drop from current levels and 10% from its recent highs.
  Last, note that it has suffered over a year of negative divergence on the weekly chart…
  …but, is trying to turn the tide on the daily RSI chart.
 AAPL reports earnings after the bell today. I imagine they’ll pull another gimmicky rabbit out of their hats to break out of the purple channel. But, I’d maintain very tight stops in the event it breaks down.
UPDATE: 11:31 AM
Quick update on SPX, which just tested its SMA10 and SMA5 200. If TPTB are going to engineer a breakout, this is the time/place. Note that VIX is positioned over an air pocket — could bounce or plunge.
UPDATE: 12:10 PM
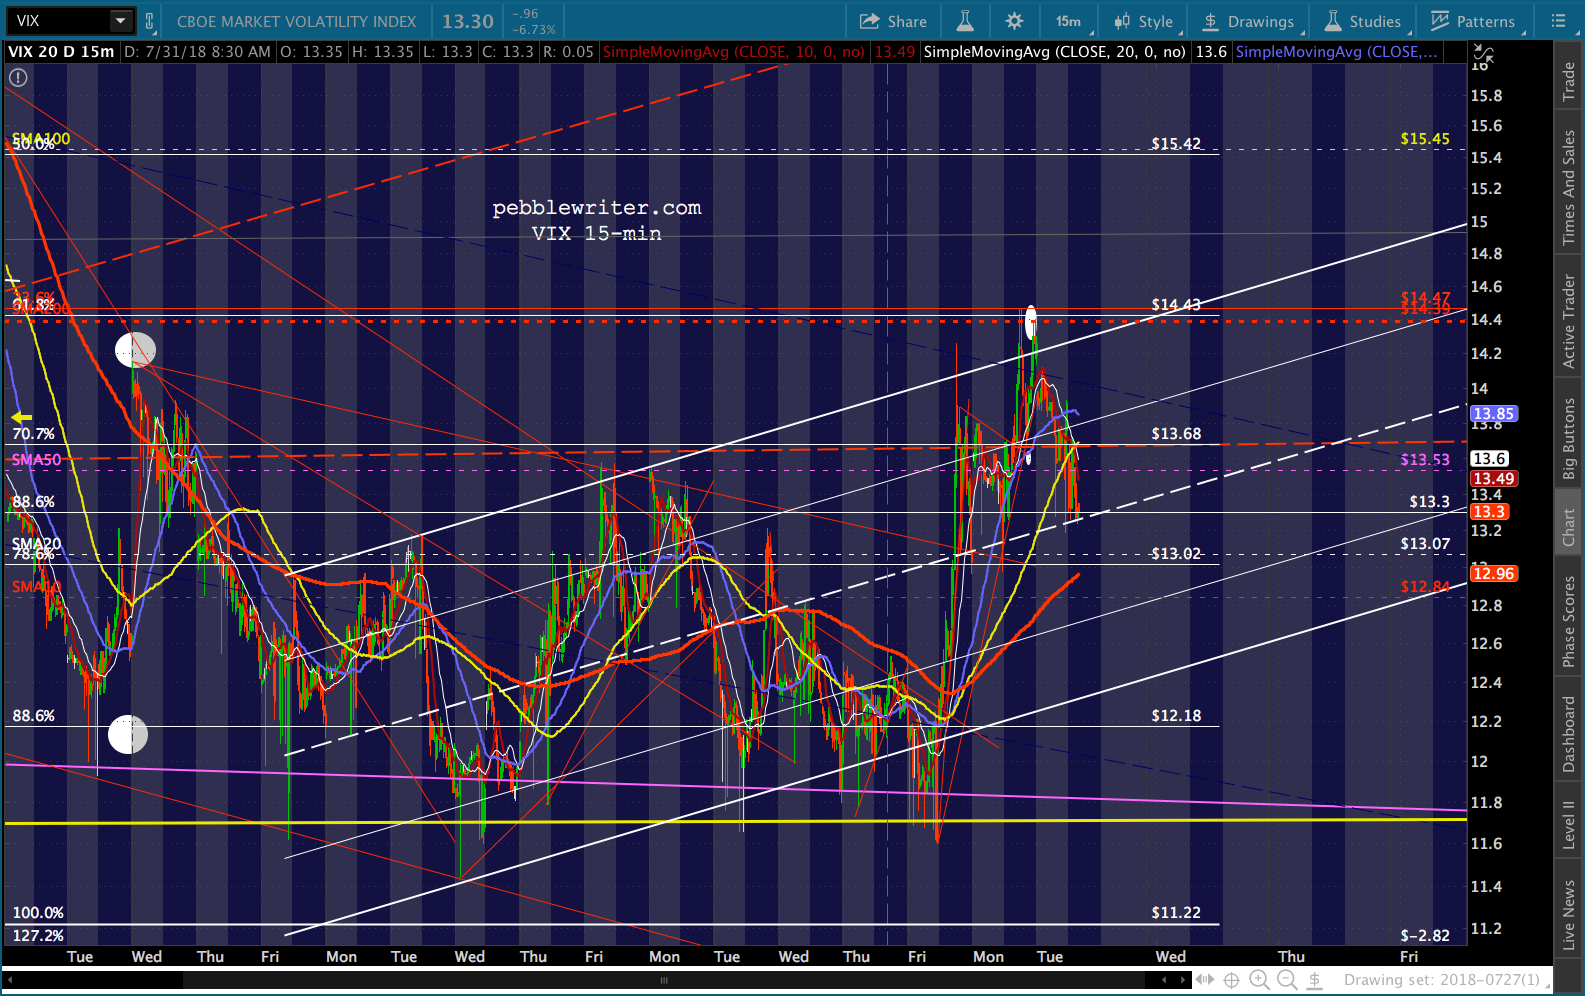
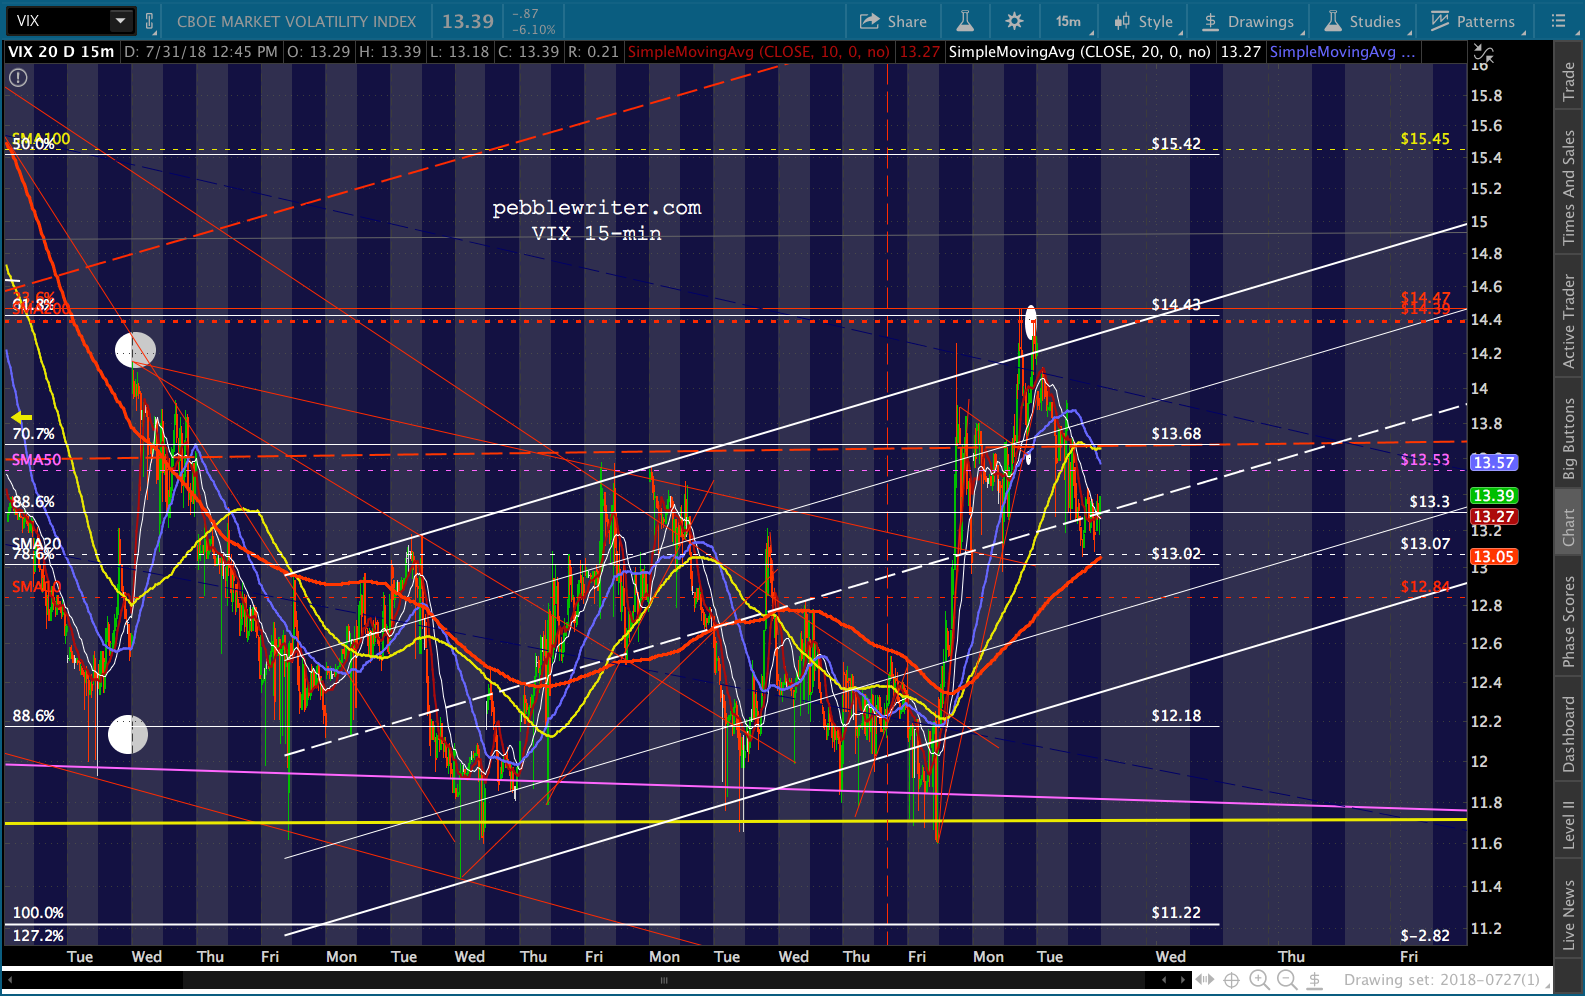
Easy peasy….they could have rammed it through the SMA10 on the open, but this way they get to hop above the SMA5 200 as well — extra support and brings out a bunch more buying by the algos.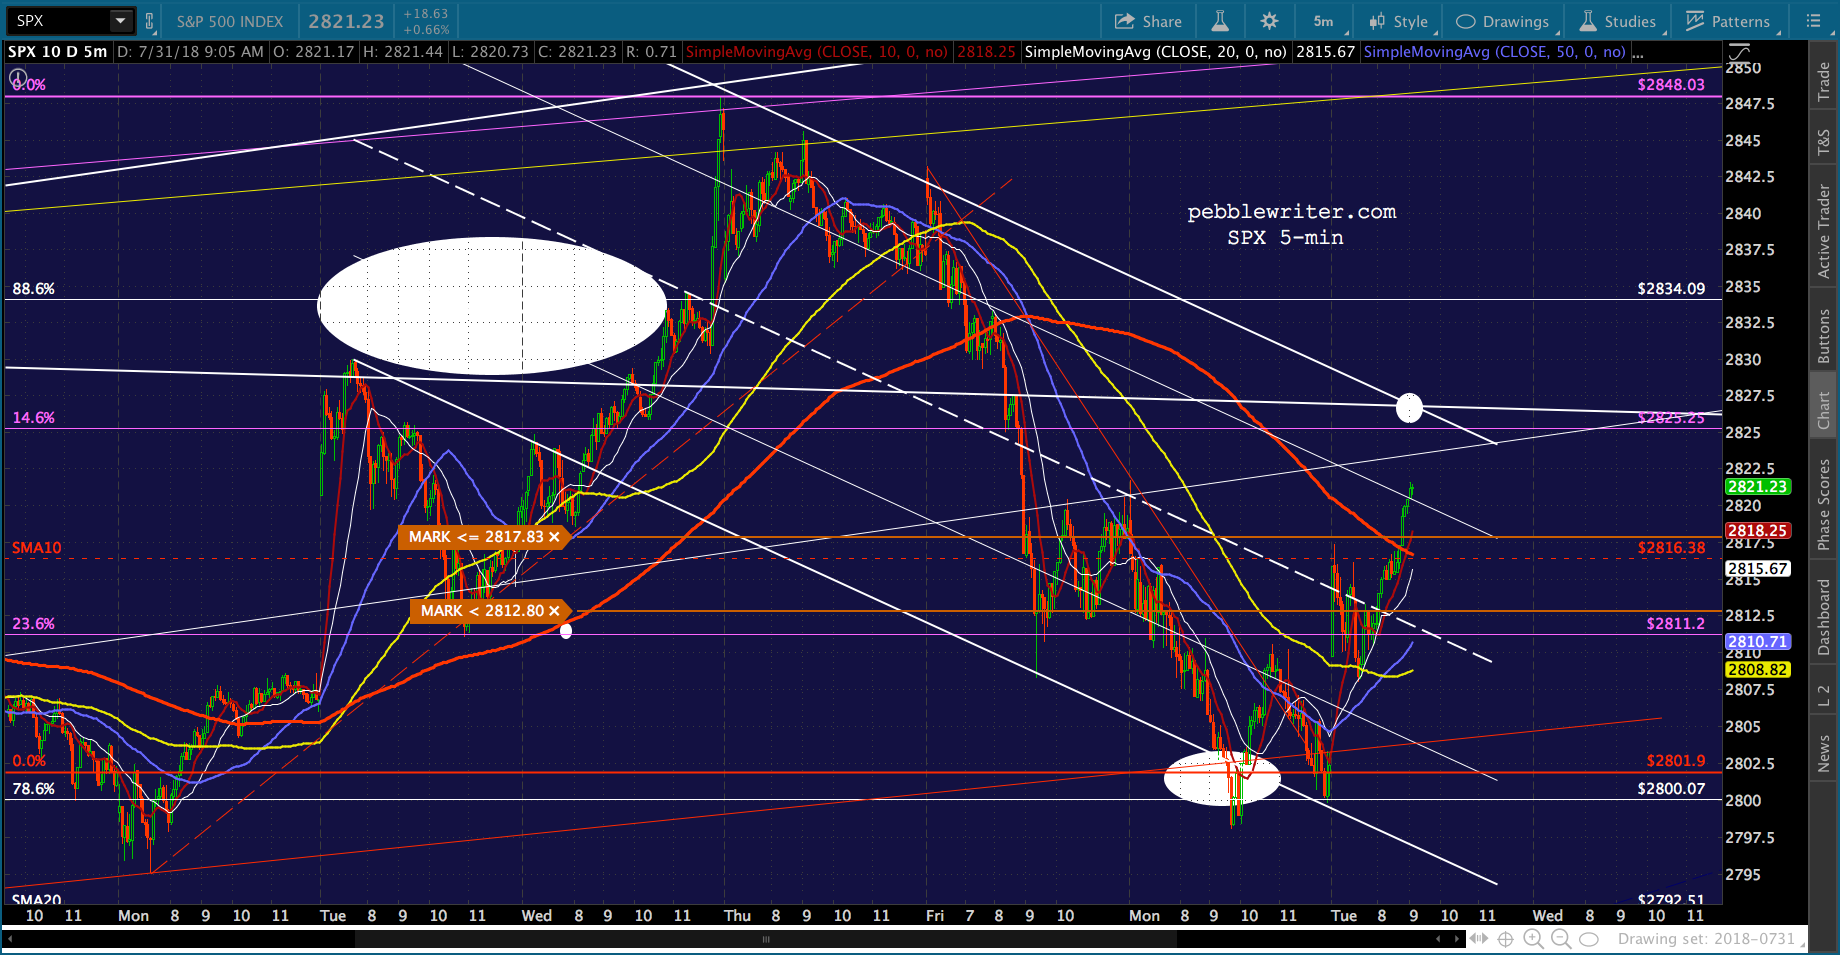 VIX has plenty of room if it needs it…channel bottom is down around 12.34.
 Back to FAANGs…
FB has surprised me somewhat in that its initial recovery back above the neckline has failed. Note the triangle. Yes, it represents overhead resistance. But, it also sets up an easy opportunity for a breakout. A $1 pop puts it back above the triangle top and neckline. From there, it has a decent shot at retaking the SMA200.  If it fails, though, there’s plenty of room for a drop to, say, the .886 at 157 — about 10% lower from here and almost 29% from recent highs.
 The RSI doesn’t offer much help other than to suggest an oversold condition.
 GOOGL has enjoyed a clean path forward since breaking out on May 9, coming within 7 points of our upside target at the 1.618 extension.
  It has negative divergence on the daily chart, but is making a bid for another retest of the ceiling.
 If it stumbles further here, it has decent support at the previous high and red channel bottom at 1178.16 around Aug 6 — 4.8% below current levels and 8.8% from its recent highs. If 1178 doesn’t hold, the next support is rising SMA200 (currently 1093 but rising fast), followed by the white TL where it intersects with the .618 at 1103.99.
AMZN is an interesting case. It made an aggressive breakout move from Jan – Feb, backtested that line twice, then broke out again on Apr 27.  Since then, it has broken a trend line — at least intraday.
  We’ll see where it ends up at the close.
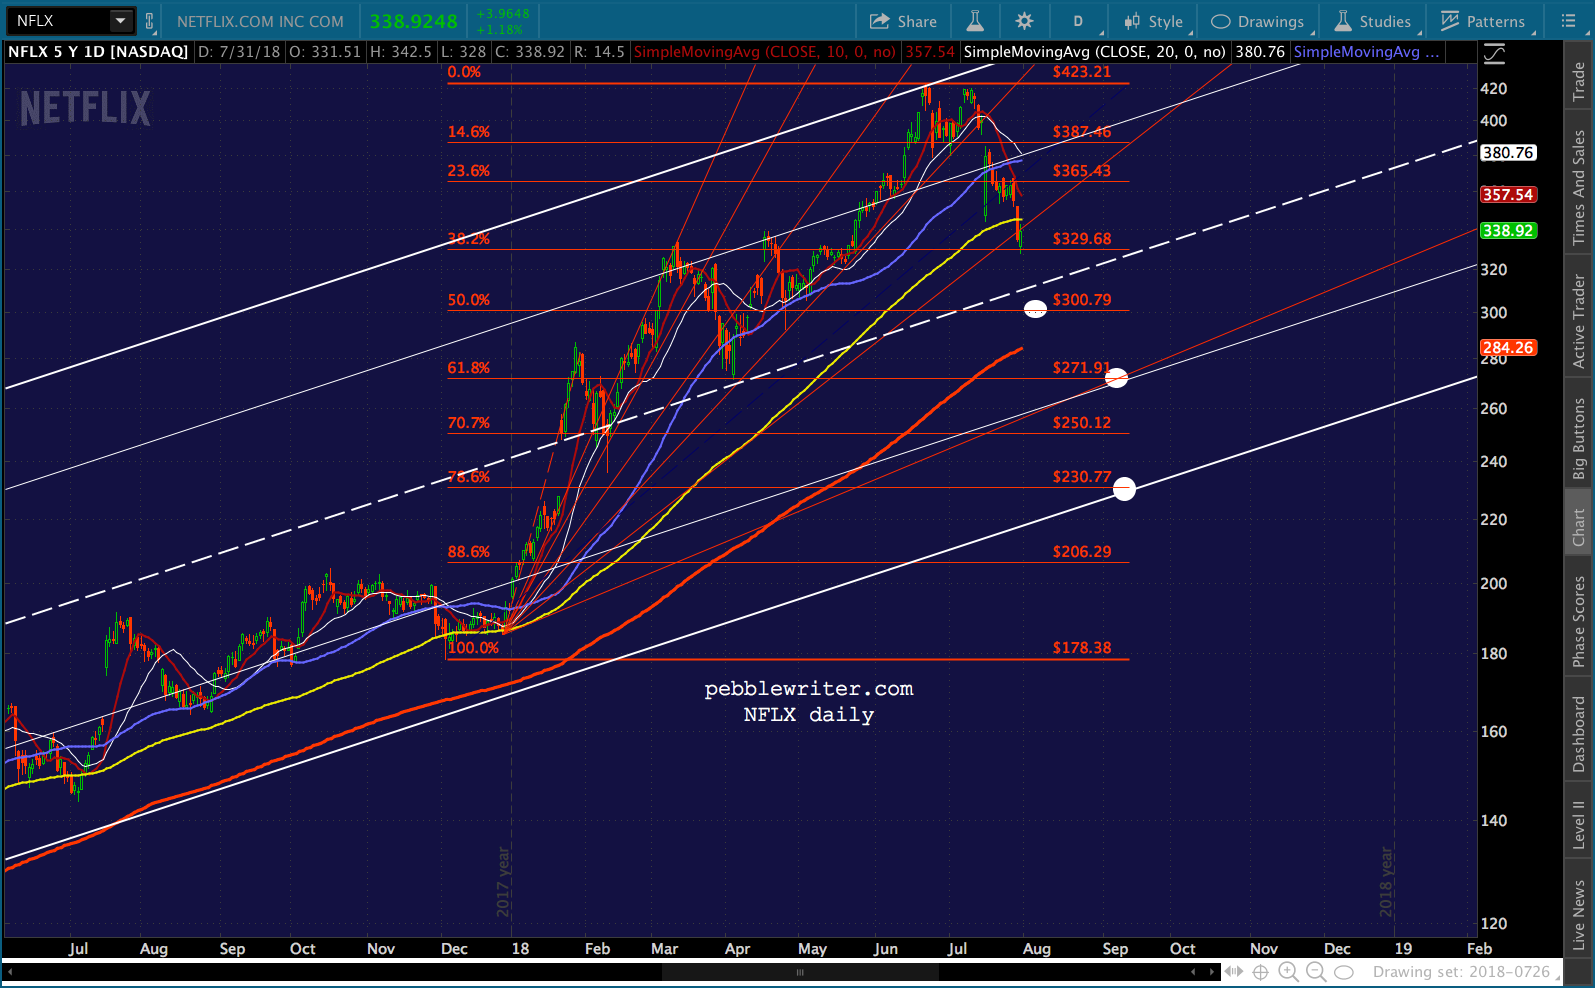
In the meantime, there is plenty of negative divergence and a very clear falling RSI channel. In addition, the last two days have seen RSI drop through the TL from April’s lows — not bullish.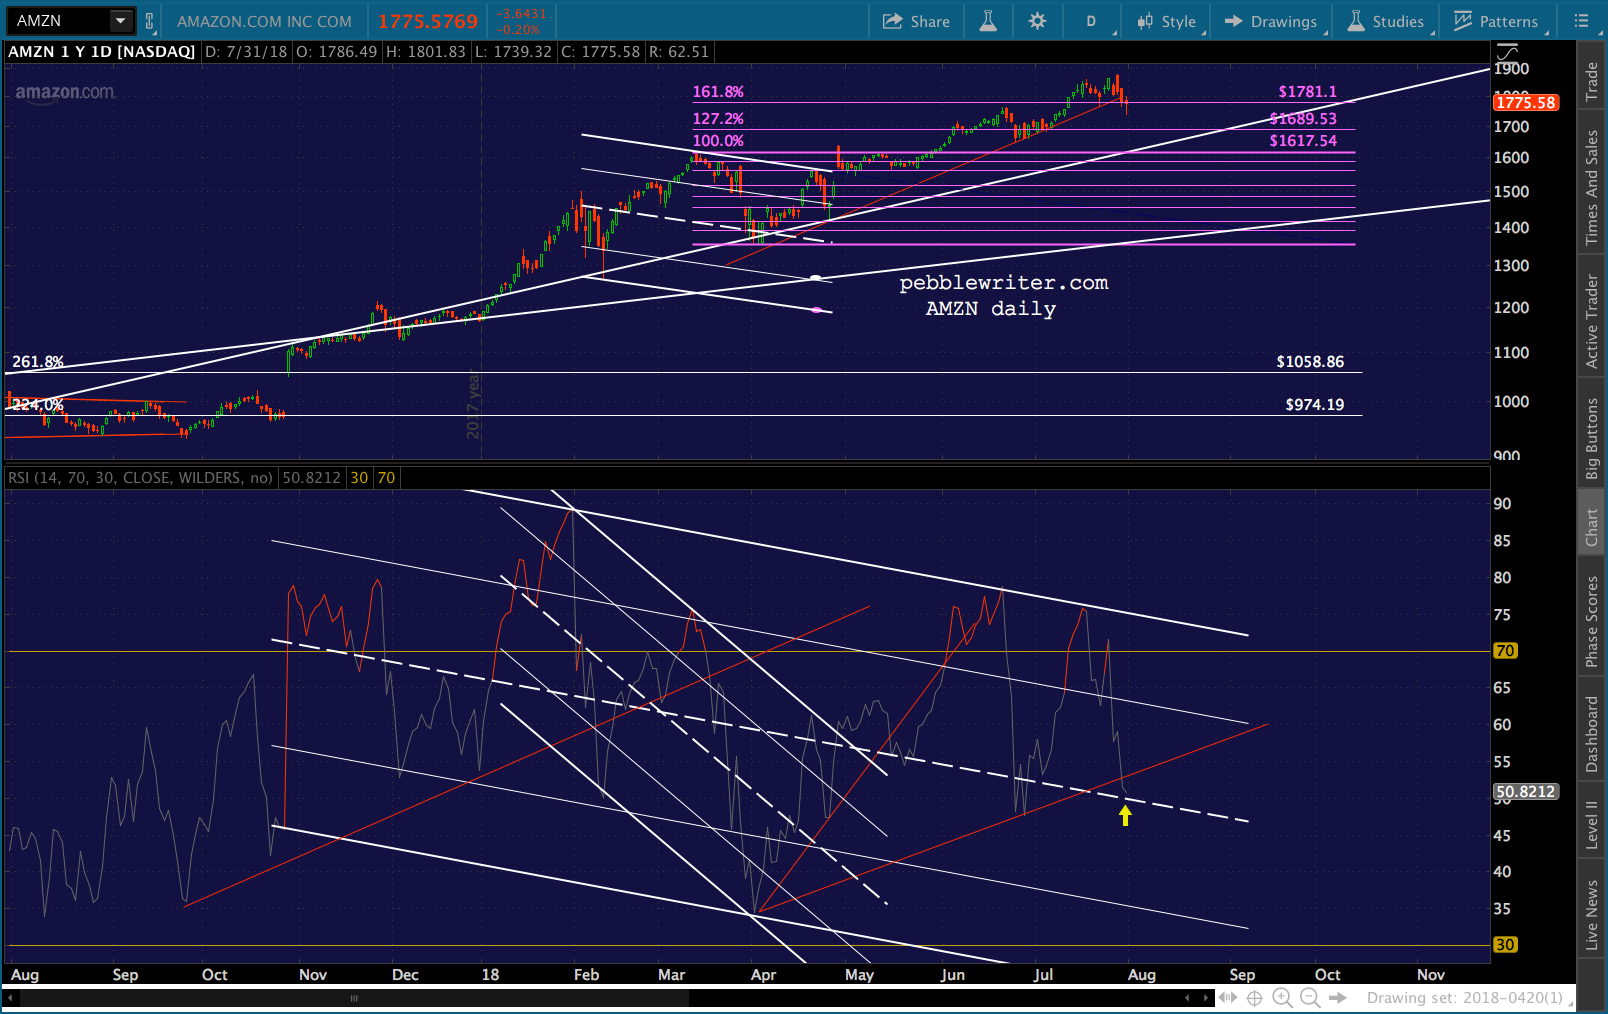 NFLX is also showing plenty of negative divergence and hasn’t much support nearby. The white channel midline and .500 Fib at 300.79 should help. But, note that the SMA200 is well below that at 284.26 – a 16% drop from here and 33% from recent highs.
 As we come into the home stretch, it’s obvious there’s plenty of downside potential for FAANGs. None of them appears to be in an untenable situation just yet, but that could change relatively easily.
As to SPX, it backtested the white channel line and is tumbling at the moment, testing the SMA5 200 as VIX gets a very slight bounce off the white channel midline.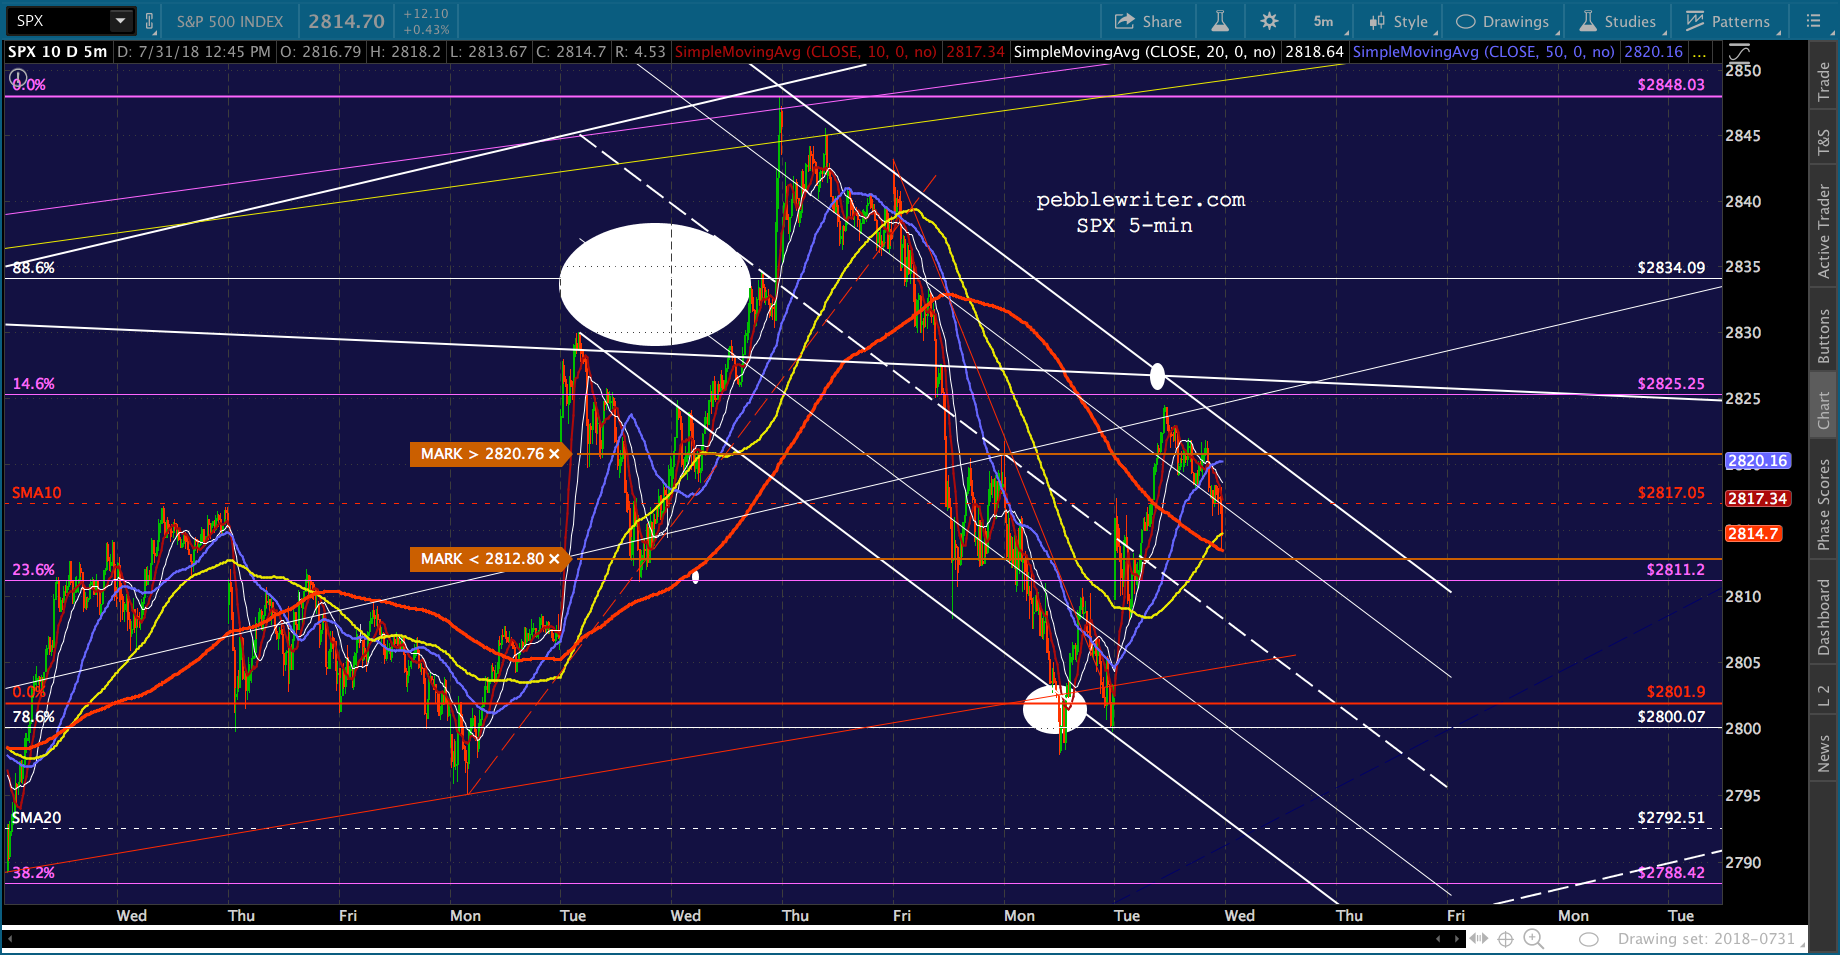 Until VIX makes a definitive move, there’s plenty of uncertainty to go around — whether or not SPX closes below its SMA10.
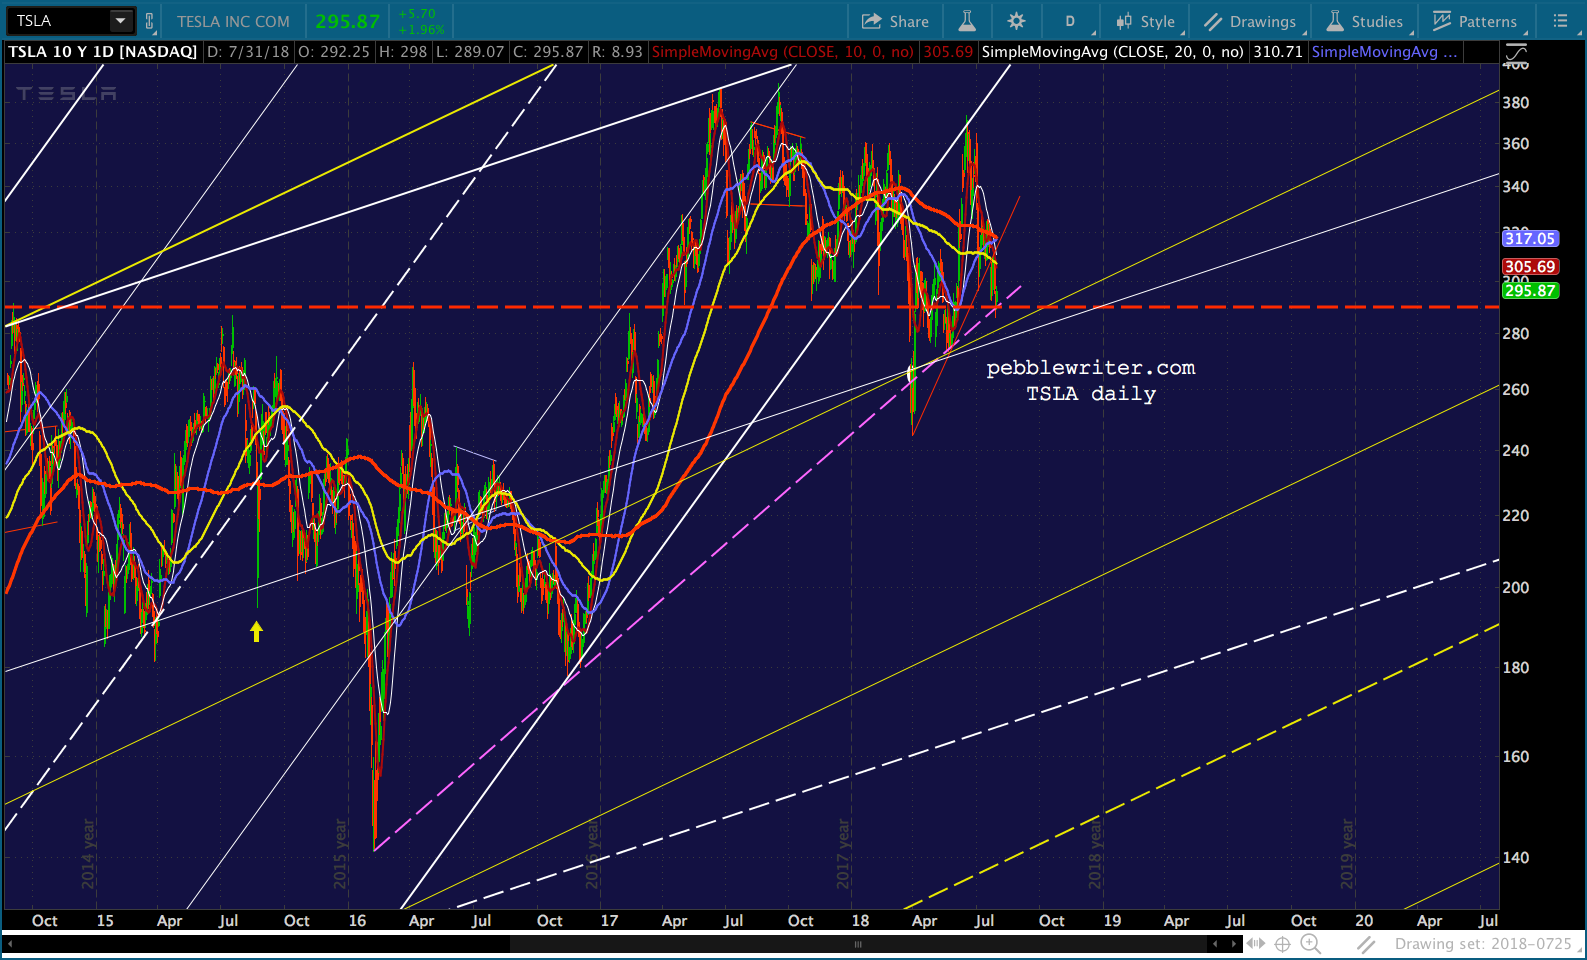
 Perhaps TSLA is the most telling chart. It should be tumbling into oblivion, but is being propped up at exactly the right level to leave bears exposed. That’s what happens when markets aren’t really markets any more.
 AAPL earnings are coming up. As of a moment ago, the bulls weren’t entirely convinced things will go their way.
 GLTA.
GLTA.