Year: 2018

  • Update on COMP: Dec 7, 2018

    Don’t look now, but COMP is approaching our 6760 target.  As we discussed on Oct 10 [see: Plan B] COMP faced significant downside if its 200-DMA didn’t hold.

    Bottom line, it didn’t.  It was off as much as 13.3% last month before beginning a bounce that was destined to fail.  Next week, it will get another chance at tagging some meaningful support around 6760-6800 – depending on whether it happens Monday or later in the week.

    Members will recall we had two near misses on the 200-DMA in Feb and April, followed by a breakout that defied logic.  Now, two months after it broke down through the important moving average, COMP has been laid low.

    Can it hold here, or will AAPL’s continuing meltdown drag it even lower?

    My 144.48 target for AAPL remains unchanged since Nov 14, the day it broke below its SMA200 [see: When Push Comes to Shove.]  Then……and, now.

    Stay tuned.

  • New Fed, Same Old Mandate

    Look no further than the Fed for the confusion reigning on Wall Street.  It was only a few weeks ago that they were preparing us for multiple rate hikes, as we were far from the neutral rate.  Then, the story shifted, indicating we were just below the neutral rate.  Yesterday, they leaked a story to the Wall Street Journal that they were gravitating toward a wait-and-see approach.

    The problem isn’t that the Fed can’t make up its mind.  The problem is that the current Fed, just like its predecessors, is data dependent.  And, the data they depend on is the stock market.

    There’s no mystery regarding the timing of the leak.  The S&P 500 had fallen 179 points in two sessions.  It was about to undergo a death cross, as the futures did this morning. Even worse, it was within a few points of completing the Head & Shoulders pattern we’ve been watching develop over the past month.In the end, ES and SPX came within 10 points of our next downside targets before promptly reversing course.  SPX came within a point of closing its gap from earlier in the morning.  The question, now, is whether the coast is clear.

    As usual, we’ll watch the algo inputs closely.  VIX reversed at our next upside target rather than breaking out.And, USDJPY enjoyed a timely bounce at our next downside target.   Even CL and RB are surging sharply.  Will it be enough to keep the rally going after the gap is closed?  Don’t be so sure.

    continued for members(more…)

  • The Yield Curve’s Warning

    NOTE:  The Dec 6 post is combined with this one from yesterday.  All targets remain unchanged from last week.

     *  *  *

    Technical analysis encompasses a wide array of indicators — sentiment, flow, volume, open interest, moving averages, momentum, chart patterns and Fibonacci patterns.  Many fundamental analysts disparage the practice, but begrudgingly dabble when a signal is compelling enough.

    Much has been written about the yield curve’s ability to forecast recessions — which sometimes helps one forecast markets. Many pundits seem to regard an inversion of the 2s10s as a sign of an impending correction — pointing to the current spread of 15bps with some alarm.

    But, as we’ve discussed many times, it’s the rapid spike in the 2s10s following an inversion that is highly correlated with the biggest equity collapses of the past 20 years.It’s a good model, but not a perfect one.

    In 2000, the yield curve low of -0.52 came on April 7, two weeks after SPX topped out.  By the time it reached 0.0 in January 2001, SPX had fallen 19%.  SPX bounced 8% over the next month or so.  But, as the 2s10s topped its 1999 highs, SPX’s troubles began anew.  It plunged 45% by October 2002, two months after 2s10s reached its 2002 high of 2.37.

    Again, good but not perfect.  If spiking 2s10s produced corrections, why did stocks top out well before the 2s10s bottomed out and well before it spiked higher?  And, why did stocks bottom out in October even as the 2s10s continued higher until July 2003?

    The 2007-2009 crash presented similar problems with the model. 2s10s inverted in January 2006, but bounced around between -0.19 and +0.21 until July 2007.  SPX didn’t top out until October 2007, at which point the 2s10s had already risen to 0.66.

    SPX’s subsequent 58% collapse was nicely correlated with 2s10s.  But, again, the fit was far from perfect and there were numerous head fakes.

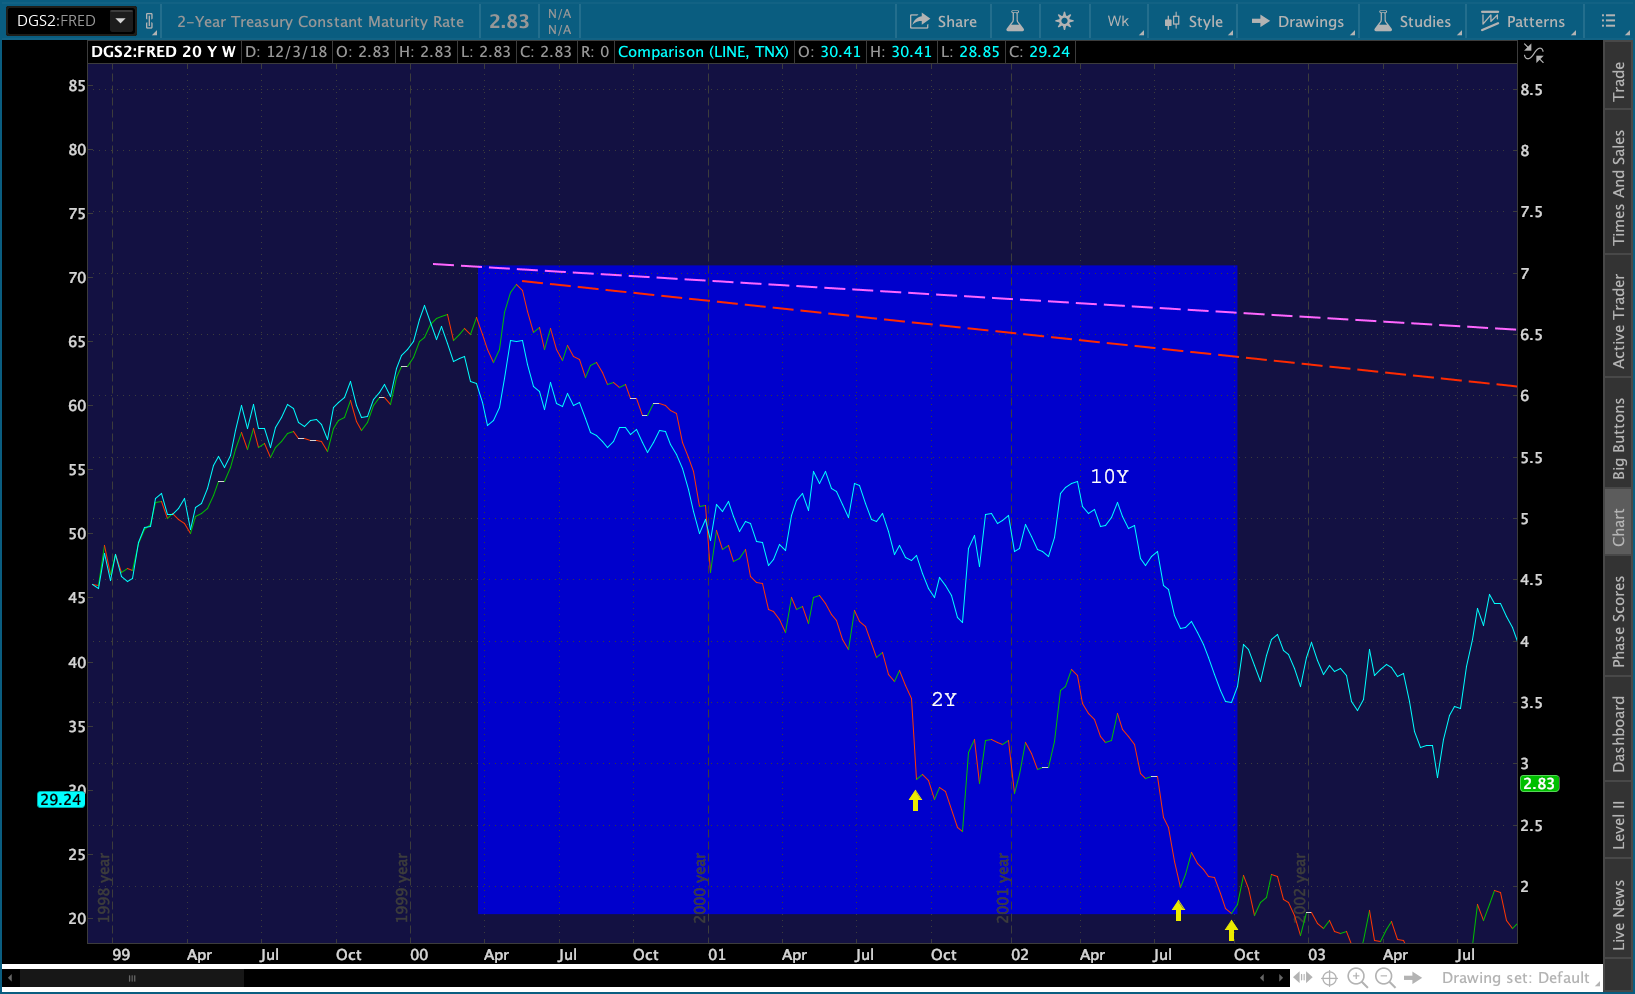
    An examination of the 2Y and 10Y side by side in 2000-2002 shows that the sharp spike in 2s10s was primarily due to the relatively faster drop off in 2Y yields.  And, the sharpest drops in 2Y yields (the yellow arrows) matched up nicely with some of the sharpest drops in SPX.The same thing happened during the 2007-2009 crash.

    The model thus becomes more robust: be wary of sharp rises in the 2s10s accompanied by sharp declines in the 2Y. But, it still doesn’t offer as much certainty as to timing as I’d like. And, as we discussed in our first post on the yield curve last year [see: Should You Fear the Yield Curve?] there have been other significant equity declines which were accompanied by sharp drops in the 2s10s.

    Several additional posts over the past year have further developed the model, revealing several very interesting nuances that address both issues.  It has helped me pinpoint numerous interim turning points, including the recent 184-pt drop [see: Nov 9 Update.]

    The basic rules can be observed on the chart below.  The colors refer to the arrows.(1) Bounces off trend lines (TLs) of support (purple, yellow) are generally bullish.
    (2) Breakouts above TL of resistance (red) are bearish.
    (3) Breakdowns below TLs (yellow and red) and horiz. support (white) are bearish.
    (4) Reversals at TLs of resistance (green) are bullish.

    Following these rules would have yielded the following long/short decisions between December 2017 and April 2018.

    a. Dec 5, Dec 15 and Jan 3 – long
    b. Jan 29, Feb 1 – short
    c. Feb 9 – long
    d. Mar 12, Mar 28 – short
    e. Mar 29, Apr 17 – long
    f. Apr 19 – short

    Let’s overlay SPX and see how the model did.  The shaded areas are the periods during which the model signaled a long position.  The unshaded areas indicated shorts.

    A buy and hold strategy between Dec 5 (a) and Apr 19 (f) would have yielded a 64-pt or 2.4% gain.  While going long and short per the model (based on closing prices) would have yielded a 1,110-pt or 42% gain.

    There was one period when 2s10s bounced back above the white TL when signals were definitely mixed. But, since SPX was bouncing along atop its 200-DMA, it wasn’t tough to decipher the correct signal.

    This was also clearly a period of extraordinarily large moves higher and lower.  So, the value of the signals was much greater than might otherwise have been the case.  Let’s take a look at the more recent case — between July 13 and the present.

    A buy and hold strategy would have yielded a 101-pt or 3.6% loss.  The model, applying only the broad strokes, would have generated 740 points, or 26.4%.  And, since 2s10s just fell through horizontal support on Tuesday, there’s likely more downside ahead.

    The yield curve model is only one component of our overall analysis.  And, the above both oversimplifies its application and understates its value.  Combined with the other tools I use every day, it’s contributing to a banner year.


    continued for members(more…)

  • The Latest Tipping Point

    Yesterday’s targets are still intact with the exception of USDJPY, which broke down in order to accommodate SPX’s SMA200 backtest.If this is a garden variety backtest, the bears have nothing to get excited about other than a nice 50-pt short trade.  Note that the last time USDJPY broke down, however, it turned into a 190-pt drop.  So, watch closely as SPX approaches 2762 (ES 2764) — ideally around 10:30AM.  Yesterday’s gap is slightly lower at 2760.88 (ES 2764.75.)Most of the attention this morning is going to the 2s10s yield curve, which is approaching inversion……as TNX approaches our downside target. If the SMA200s don’t hold, things will get very interesting very quickly.

    continued for members(more…)

  • You Break It…You Buy It

    Suppose a neighborhood kid was seen deliberately throwing a brick through an expensive plate glass window in your home. Following a serious discussion with and full reimbursement from the kid’s parents, things might eventually get back to normal. If the parents are thinking straight, the little runt might even be responsible for working off the expense of the repair. But, you probably wouldn’t go around singing the kid’s praises.

    So it is with Trump’s trade war with China — except the window is still broken, the kid who broke it is blaming the brick for the damage, he’ll never have to pay for it, he’s going around bragging about how great it’s going to look when it is repaired, and the whole neighborhood is throwing him a big party because he promised not to throw any more bricks — at least for the next few months.

    Futures were up as much as 55 points earlier, and are still up 42 points (1.52%.)More importantly, important resistance will be broken on this morning’s gap higher. Is it time to celebrate?

    continued for members(more…)

  • Be Careful What You Wish For

    The market isn’t even open yet, and already the administration is starting with the algo-inspiring messaging.  A China deal is imminent!  Actually, quite likely.  Well, there’s a decent chance…

    Playing this outcome is no better than a roll of the dice — which is why the VIX gamesmanship has already begun.  Note that ES’ two threatened dips below the 2.24 extension at 2728… …were promptly met with VIX smackdowns.  As Blondie would say, “one way or another.”Speaking of which…I went in yesterday for a simple extraction of a tooth which had been bothering me for quite a while.  It was time to think about an implant.

    The procedure ended up taking four hours, involving three oral surgeons, three assistants, a tech, and 22 injections.  Damn tooth had three roots, two of which were hooked at the end and refused to let go.  So, they essentially drilled the tooth out.

    I learned two important lessons from the experience.  First…brush and floss. Duh.  Second…some conditions which seem simple and straightforward can become excruciatingly complex in a hurry.  So it is with QE.

    Ten  years ago, when central bankers first delved into the suppression of interest rates and accumulation of trillions in assets, it probably seemed like a fairly simple way to protect the stock market and economy from ruin.  Now, the market hangs on every Fed utterance to find out when the party might truly be over.

    But, like tooth # 19, easy money is proving to be darned near intractable.  Consider the complex relationship between rates and the US dollar.Since the April-May equity plunges, DXY and TNX have been rising in lock step.  A strong dollar kept inflation under control while oil and gas prices soared.  Rising 10Y rates helped prop up the dollar, and kept the yield curve from inverting while the Fed worked the short end higher.

    It’s hard to say, but I imagine they didn’t anticipate the aggressive manner with which Trump attacked high oil and gas prices and interest rates.  With November CPI due to tumble, the 10Y is finally tumbling — which means the Fed must stop hiking or face a yield curve inversion.

    This has been the basis for our inflation and interest rate forecasts since mid-April [see: Oil & Gas, Inflation and Interest Rates: A Delicate Balance or Goal Seeking.]  In it, we forecast a sharp decline in oil and gas prices and a lid on interest rates and inflation.

    We also forecast that stocks would follow suit unless USDJPY angled higher and VIX came under attack.  Not surprisingly, all of these things have come to pass.

    Oil has plunged 35% from its recent highs.  The 10Y briefly punched above 3%, but is about to drop below it as the 2s10s lingers in the low 20s.  USDJPY, which plunged to 104 in March, is about to test 114 again.  CPI, which reached 2.95% in July, could test its 2.07% 2018 lows for November.

    Unless oil and gas suddenly spike higher or Trump’s tariffs are expanded, the Fed can’t justify further rate hikes.  The “market” is just fine with that.  Central banks can still buy stocks, hammer VIX, toy with the yen carry trade, etc.  And, politicians can still cut taxes so corporations have more money with which to buy back shares.

    But, it remains to be seen whether USDJPY can hold its uptrend in the face of stable or declining interest rates.Remember what happened the past couple of times USDJPY threatened to break down.

    continued for members(more…)

  • Powell Joins the Club

    Unless he publicly walks back yesterday’s widely misquoted comments, Powell has officially joined the club of Fed chairmen with unquestioned allegiance to a rising market.  The actual quote:

    “Interest rates are still low by historical standards, and they remain just below the broad range of estimates of the level that would be neutral for the economy — that is, neither speeding up nor slowing down growth.”

    Note, this is not the same as “just below neutral” as most of this morning’s headlines state.  Nevertheless, it’s a huge divergence from comments in October that the rate was “a long way from neutral.”

    The 2Y dipped a bit.  But, the more interesting move IMO was the 10Y — which continues toward our long-held downside target. One might think this would mean DXY is finally breaking down.  But, USDJPY — which managed to nail both of our intraday targets — has clung stubbornly to channel support.  Until it breaks down, the downside case for equities is iffy.Even more interestingly, yesterday’s short squeeze occurred without VIX dropping through its SMA50, which we identified as an important line in the sand for bears.  So, things aren’t as clear cut as one might think after such a massive meltup.

    continued for members(more…)

  • Trump: “Who Hired This Guy, Anyway!?”

    My favorite Trumpism of the week:

    “I’m doing deals and I’m not being accommodated by the Fed,” Trump told the Post. “They’re making a mistake because I have a gut and my gut tells me more sometimes than anybody else’s brain can ever tell me.”

    If Trump could just shut his big yapper for a few days (very difficult, I know) he’d probably find that the Fed is fairly unsure about additional rate hikes.  But, by targeting Powell and the gang with incessant criticism, he paints them into a corner.

    Now, if they slow or stop the hikes to accommodate slowing growth and lower inflation, they risk the appearance of taking orders from Trump.  The repercussions would be devastating to the Fed’s reputation.  If they stick to their hiking schedule, they risk choking off whatever momentum the economy might be able to muster.

    Meanwhile, the quite overextended DXY continues marching higher…… despite the EURUSD’s unwillingness to penetrate the channel backtest.Combined with VIX’s deft dip below its most recent straw-man trend line (but, failure to drop through its SMA50)…… it’s enough to send futures through their SMA10 which had previously represented resistance.  Can it hold?  A great deal depends on what Mr Powell has to say today.

    continued for members(more…)

  • Another Moment of Truth

    Continuing yesterday’s theme of Mixed Messages, futures have been all over the map since yesterday’s close – sinking as low as 2626 on more tariff troubles and soaring up to 2684.50 (and, coincidentally, the SMA10) on tariff hopes.

    Virtually all of our targets remain the same, though clearly we face substantial headline risk for the next few days.  From Powell: Slowing Global Growth two weeks ago…

    I’m currently following a model which suggests that SPX will gap down on Monday or Tuesday to 2648ish, bounce for a few days, then down to 2608 around the 27th. This is a little earlier than the COMP chart suggests, so I’ve moved the COMP target to 6736 on Nov 27…This is where I think we’re headed.

    This morning’s setup offers a clear path to 2608.  But, as usual, it will depend on USDJPY’s “breakout” and VIX’s apparent indecision.

    continued for members(more…)

  • Mixed Messages

    A 30-pt bounce in futures over a long holiday weekend is nothing new.  But, when it happens in the midst of longer-term bearish patterns which have yet to fully play out, it delivers very mixed messages.

    Our yield curve model continues to point to lower stock prices, so we’ll regard this ramp as a likely pop and drop — at least for now.continued for members(more…)