

ES reached our next downside target on Friday, though SPX came up a few pennies short.  The more interesting story is oil and gas, which — after tagging our downside targets on Friday — are both up nicely on reports of an OPEC production cutback.
 Will it be enough or in time to prop up stocks?
continued for members…
Futures are off a few points at the moment, which suggests that SPX will get another shot at its SMA200, now at 2763.03.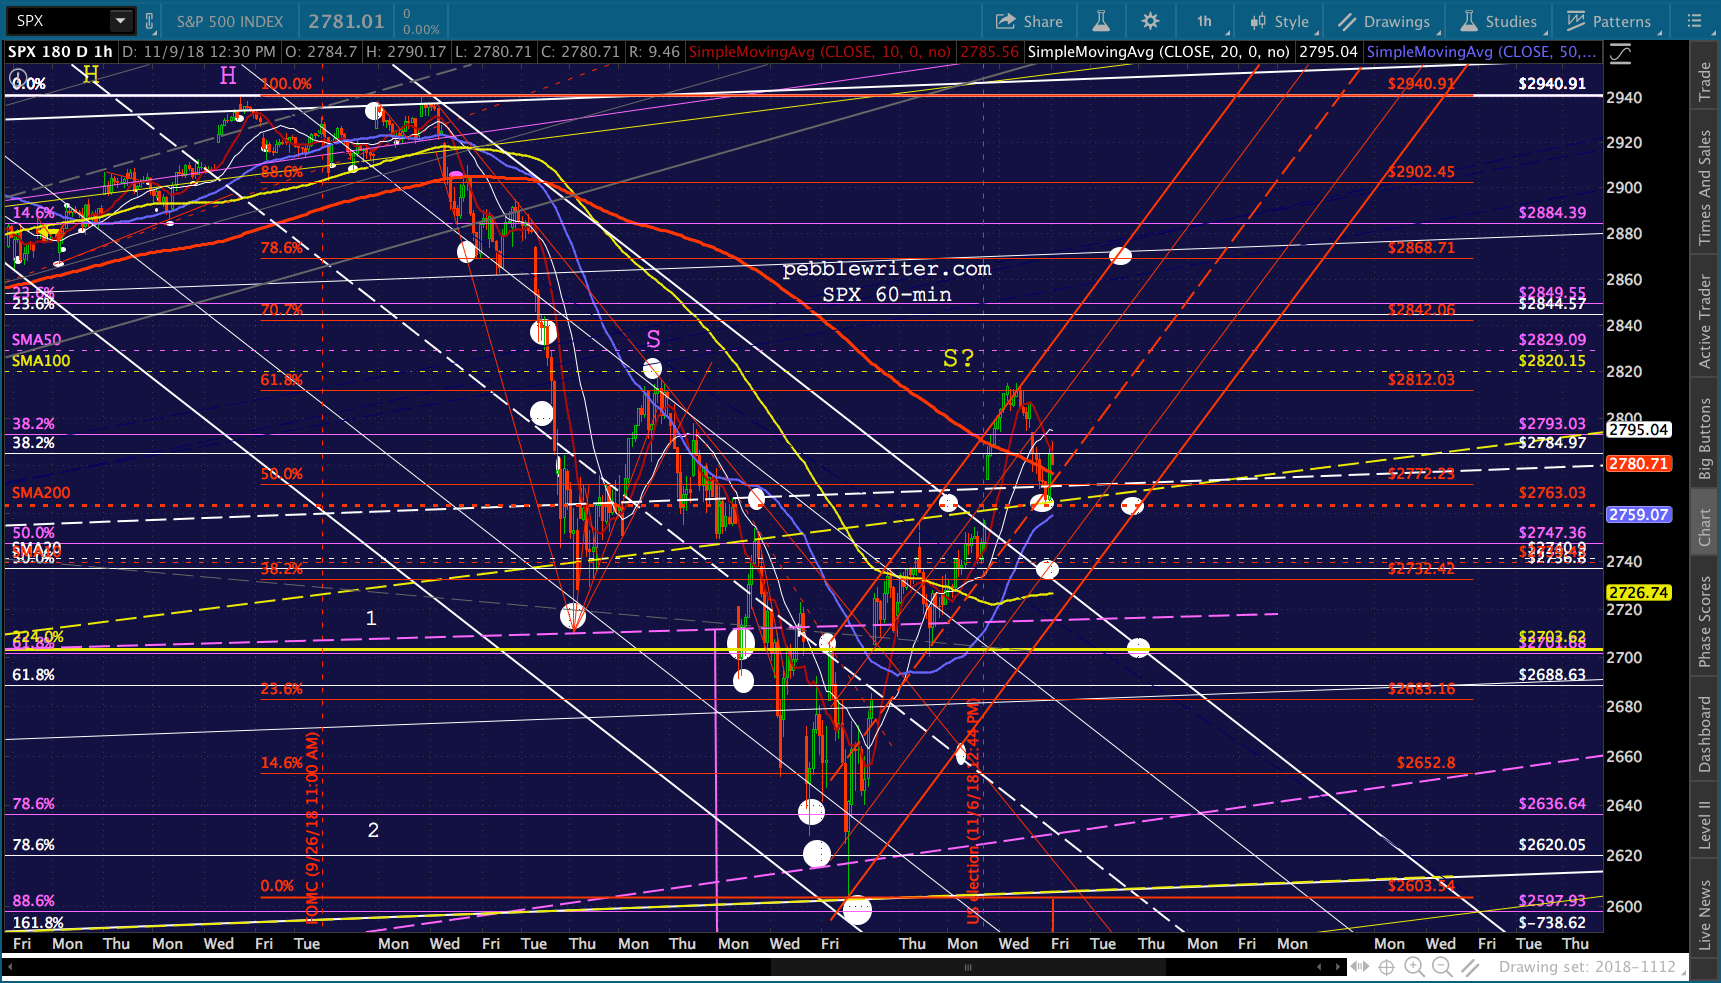 If the SMA200 doesn’t hold, then the next most likely support levels are a backtest of the broken white channel and SMA10/20 around 2739-2741 and, of course, the 2.24 at 2703.
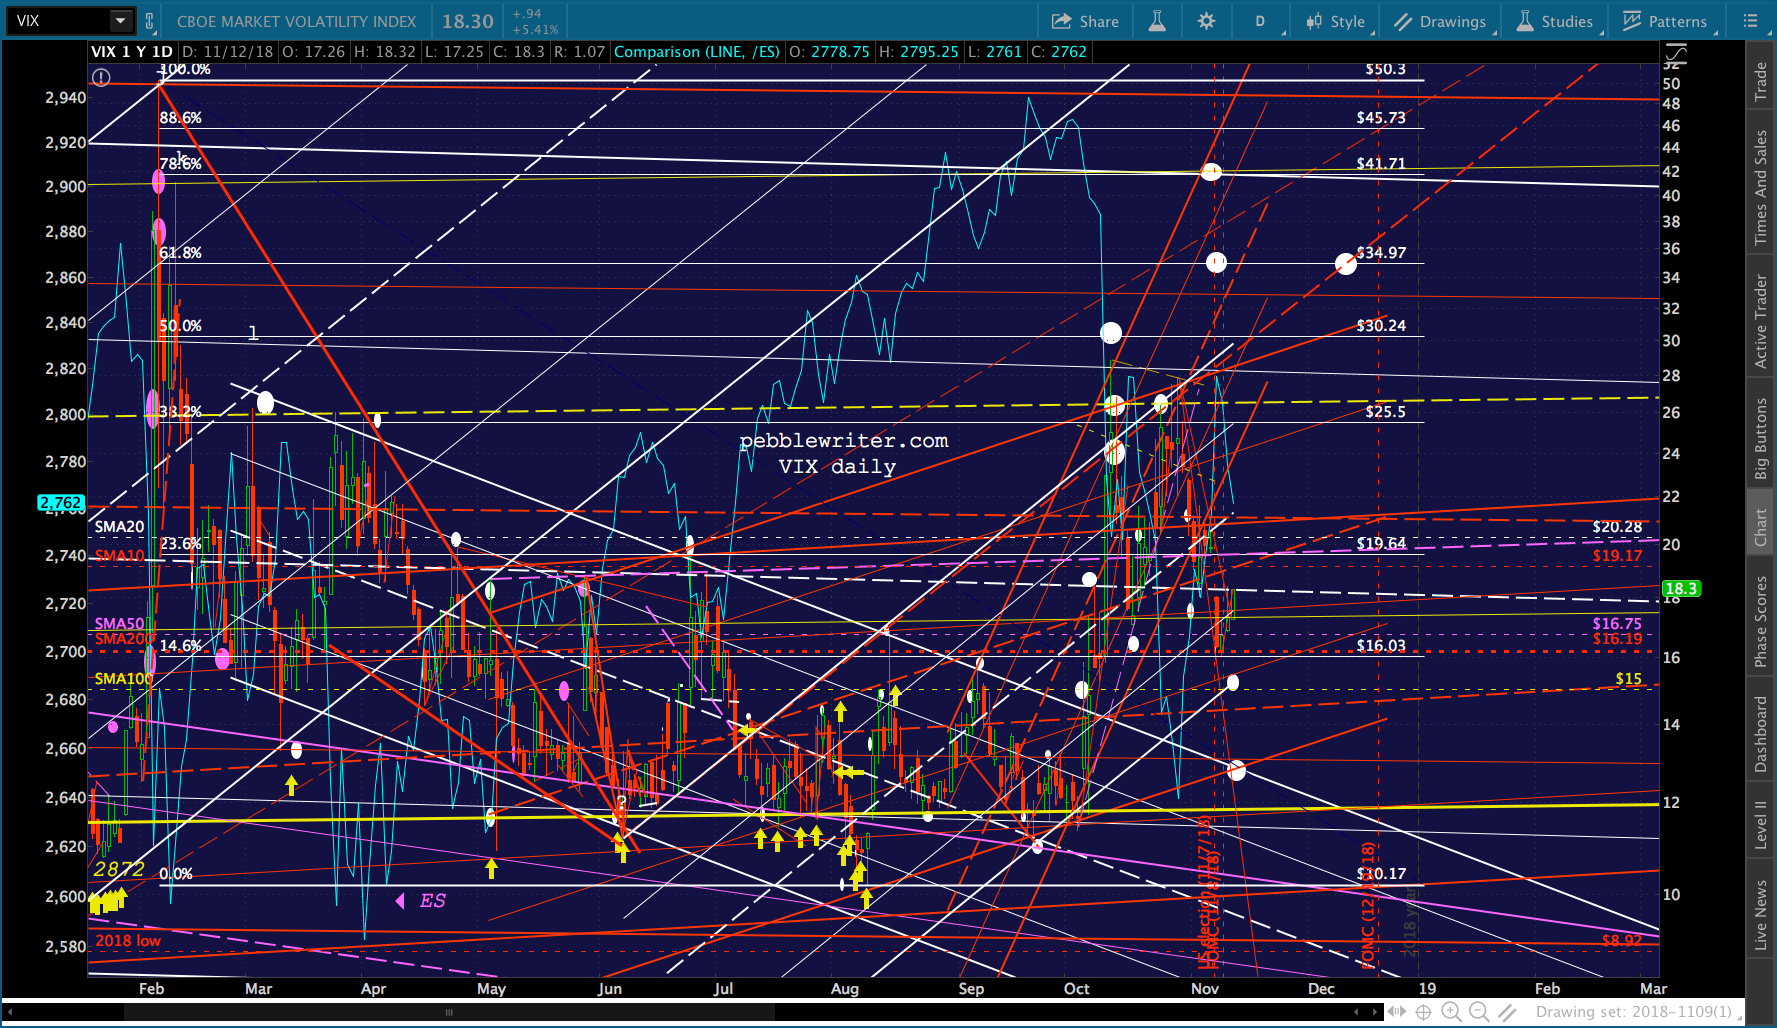
It’ll be important to watch VIX, as it broke down from Friday’s TL and is currently backtesting it. 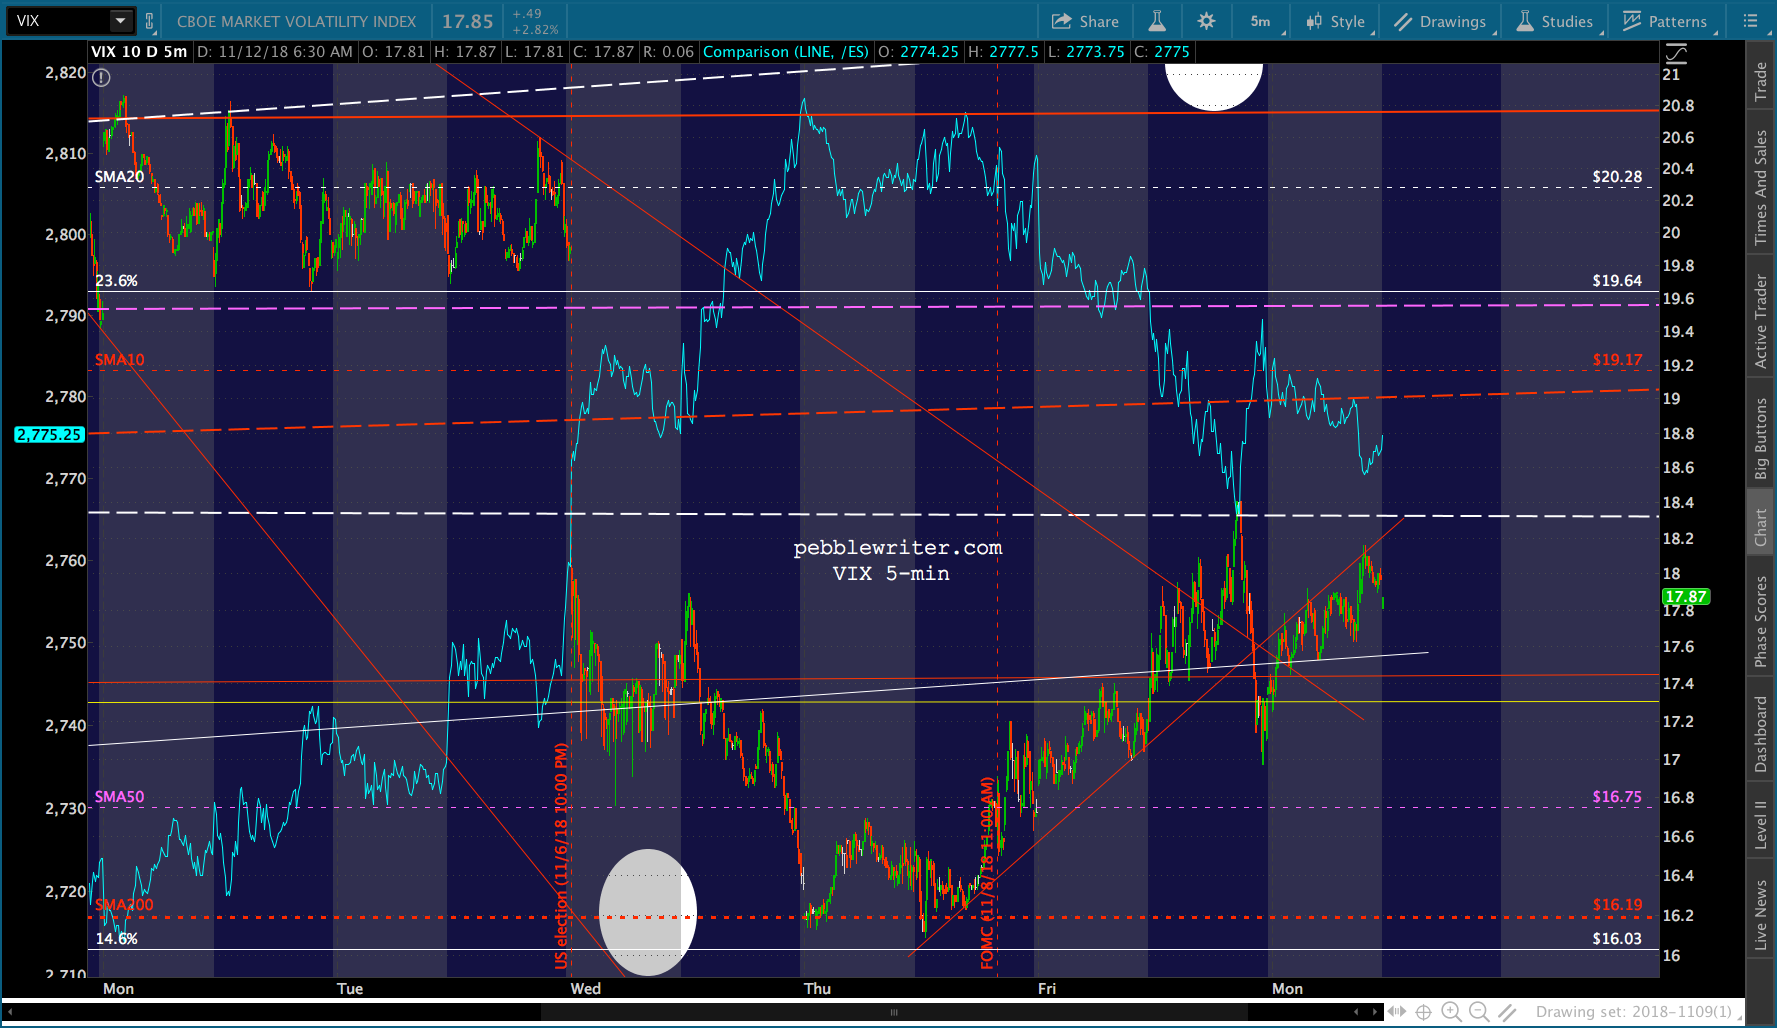 A retreat from that TL would strongly suggest a drop to flesh out the rising white channel. Whereas, a bounce above the red midline at 18.22 would suggest further losses for stocks.
 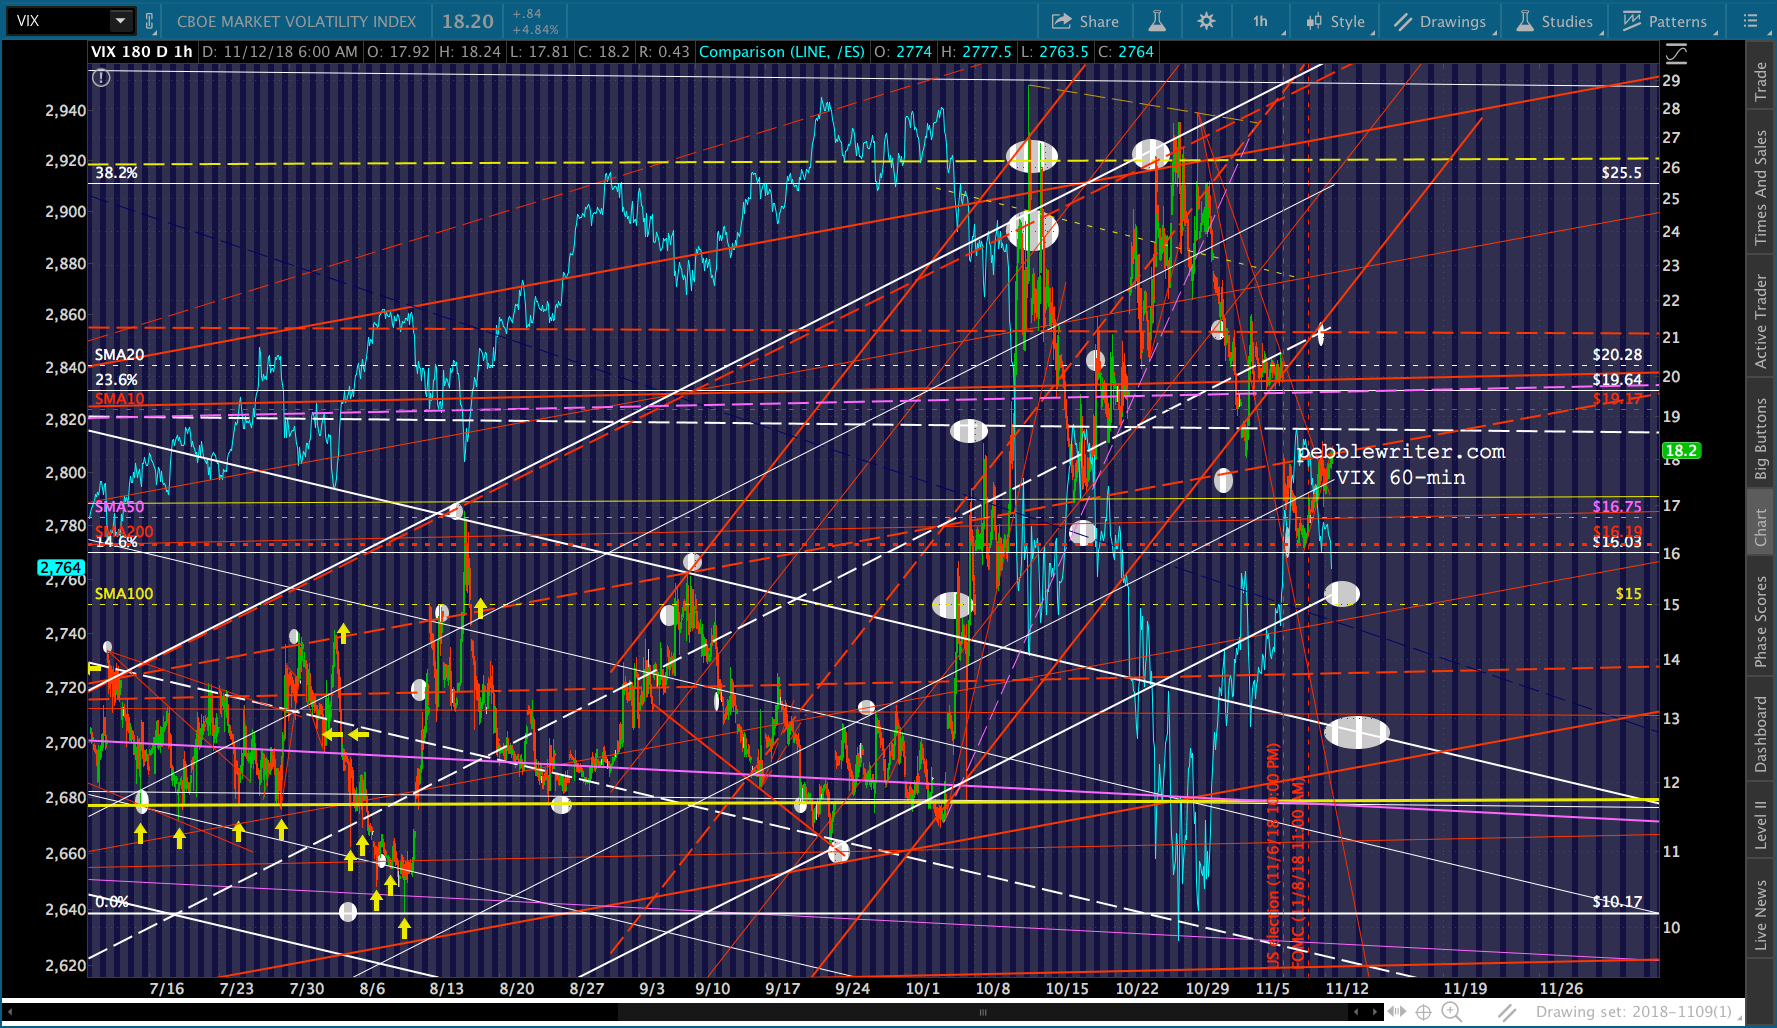 COMP continues to suggest a 7% drop from here — the equivalent of a whopping 190 SPX points. The timing looks to be around Dec 11.
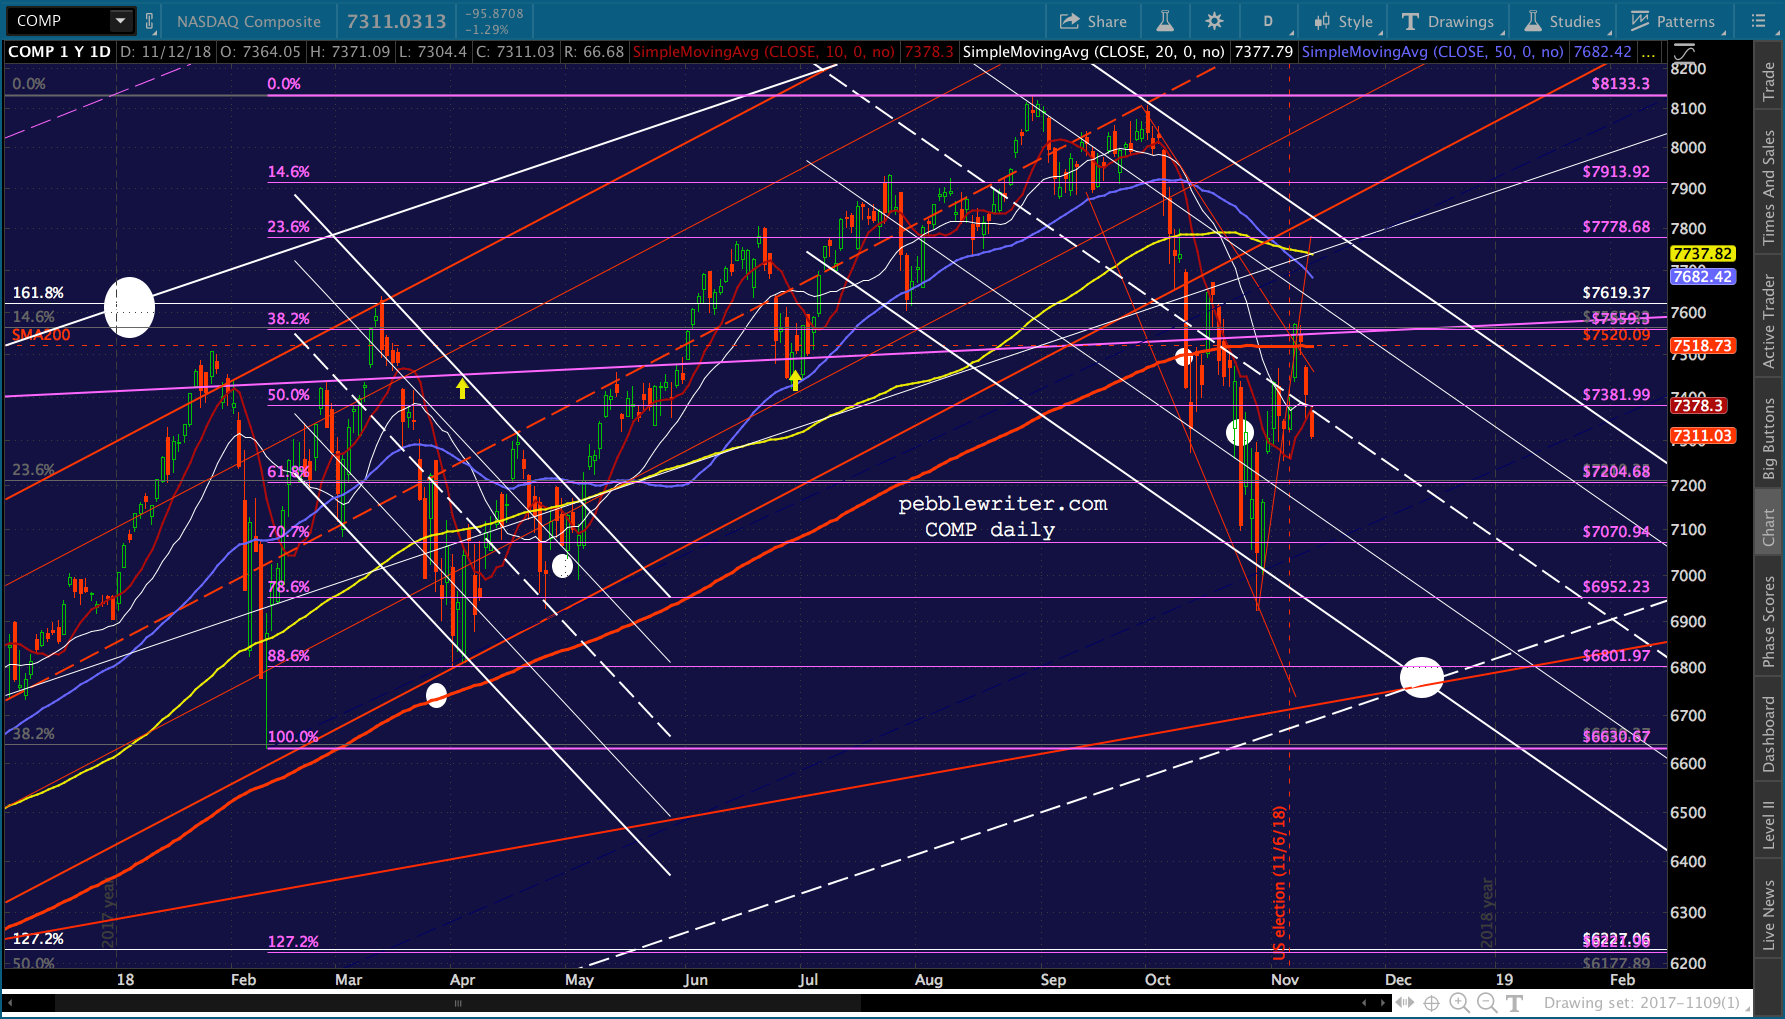 Recall that we have a couple of H&S patterns in the works — with 2608 being the completion of the larger, red one. The timing looks workable, given that the FOMC is expected to hike rates a week later.
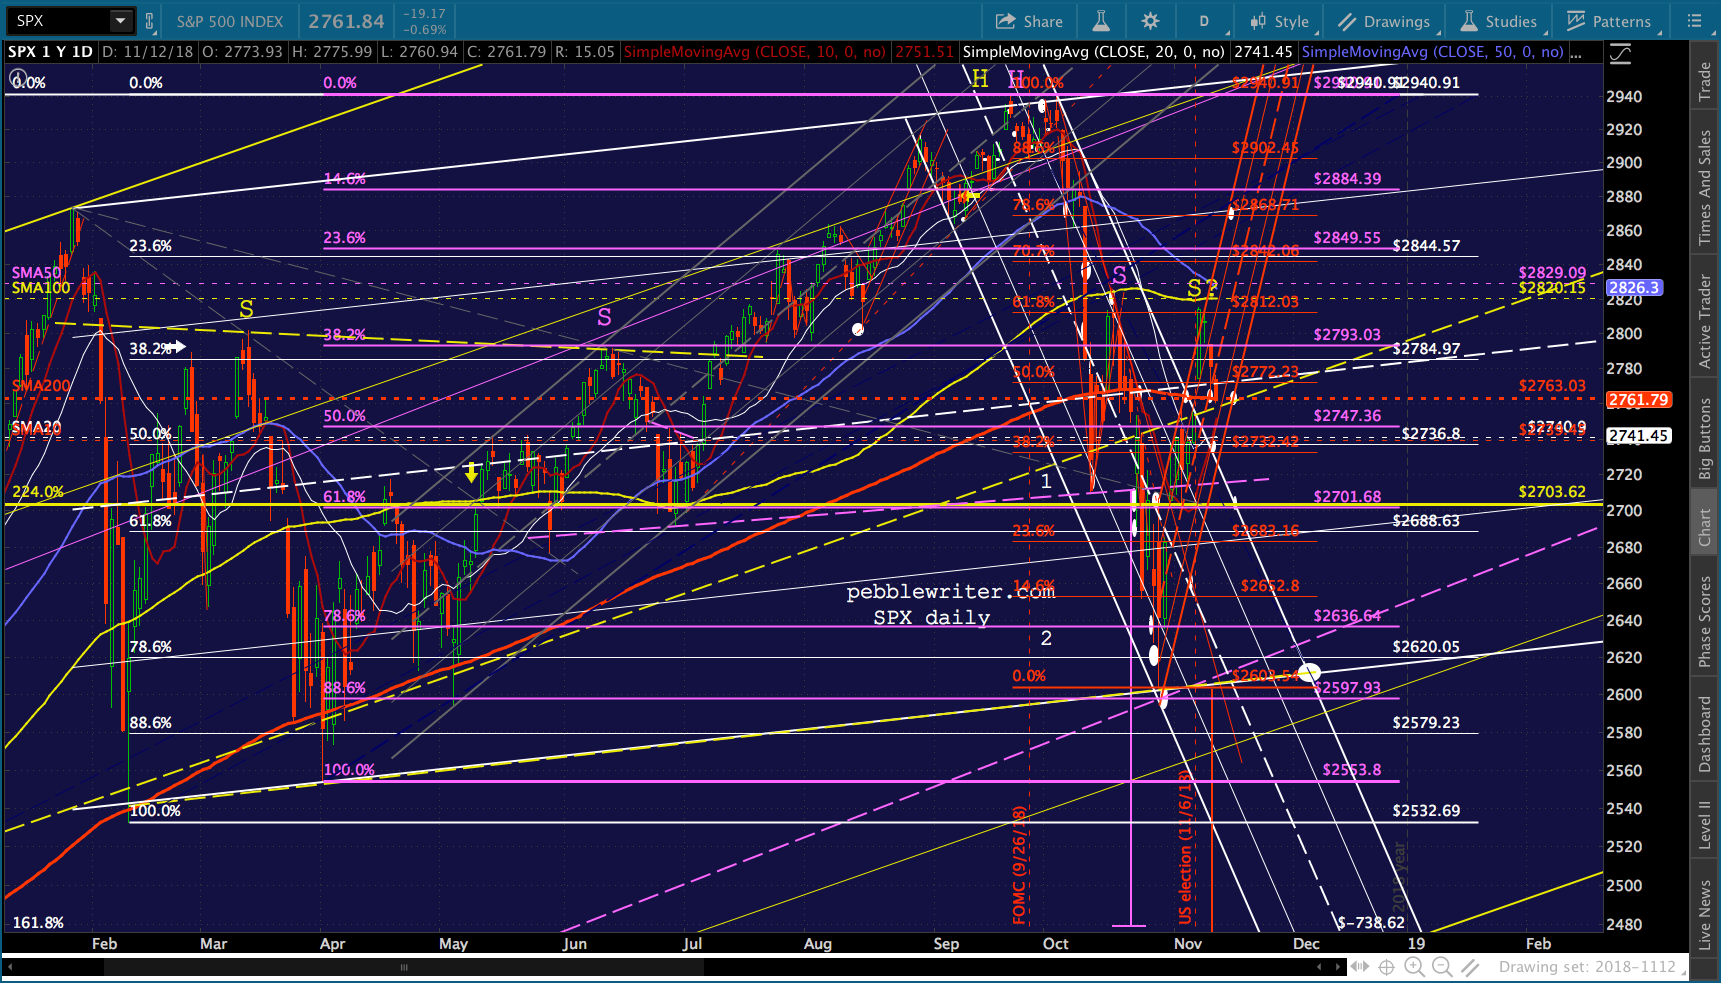
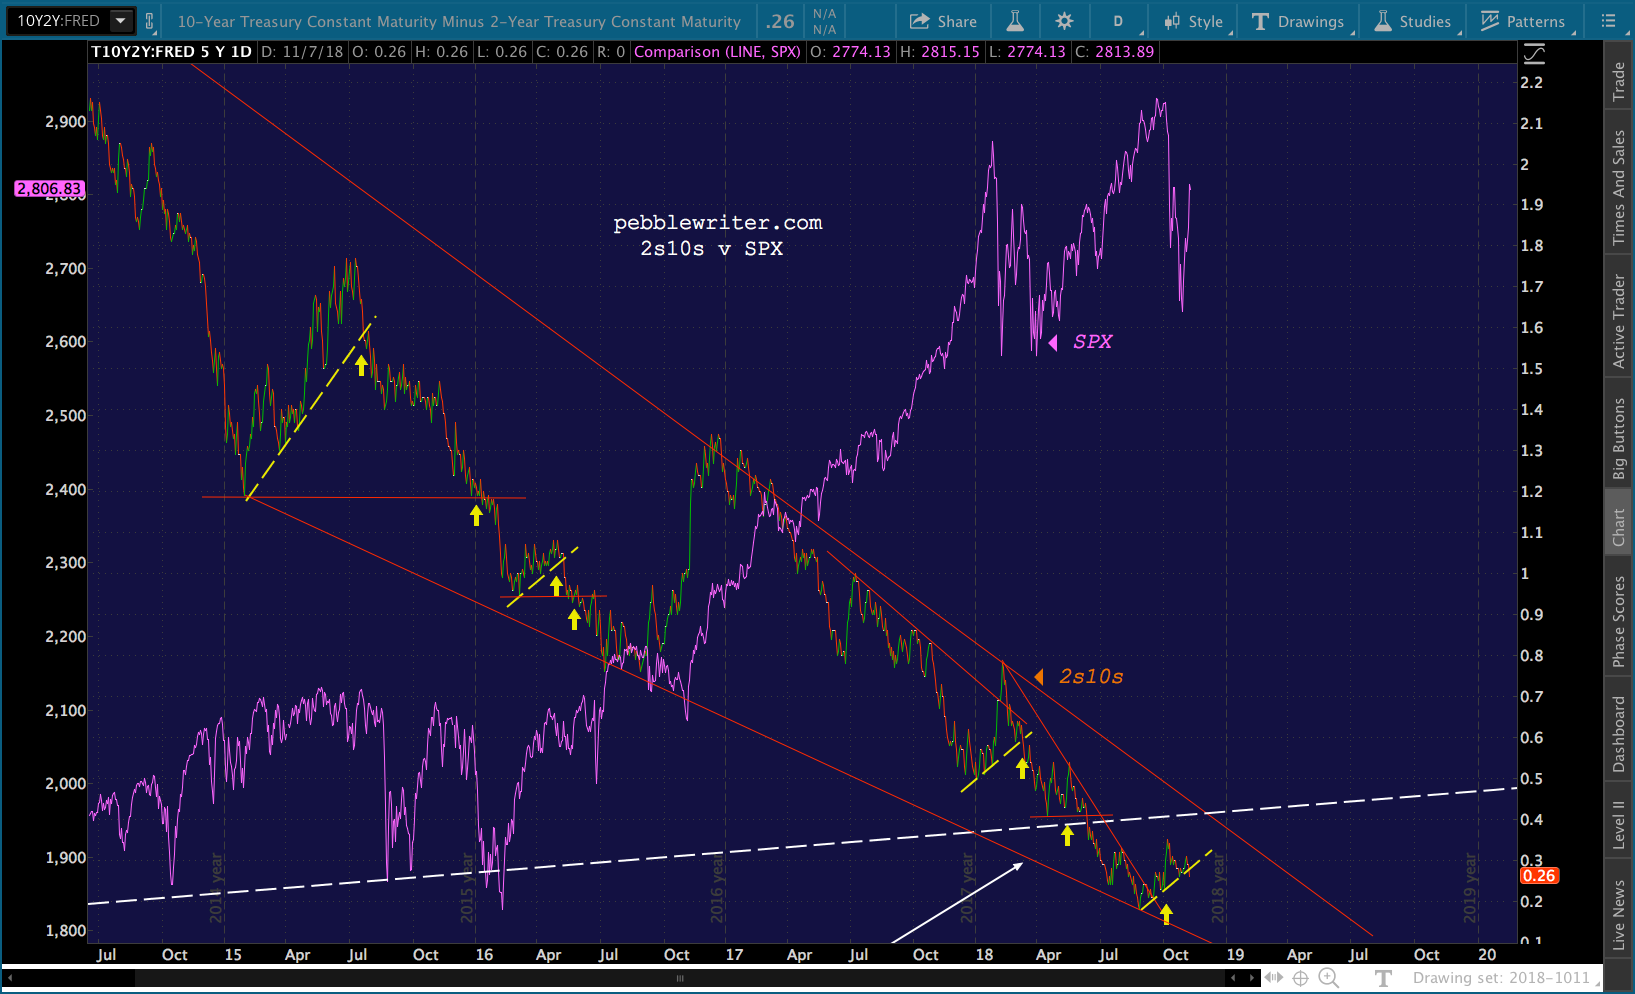
 Helping the bear case – our yield curve model. Note that the 2s10s recently broke down below the latest TL of support – typically bearish for stocks.
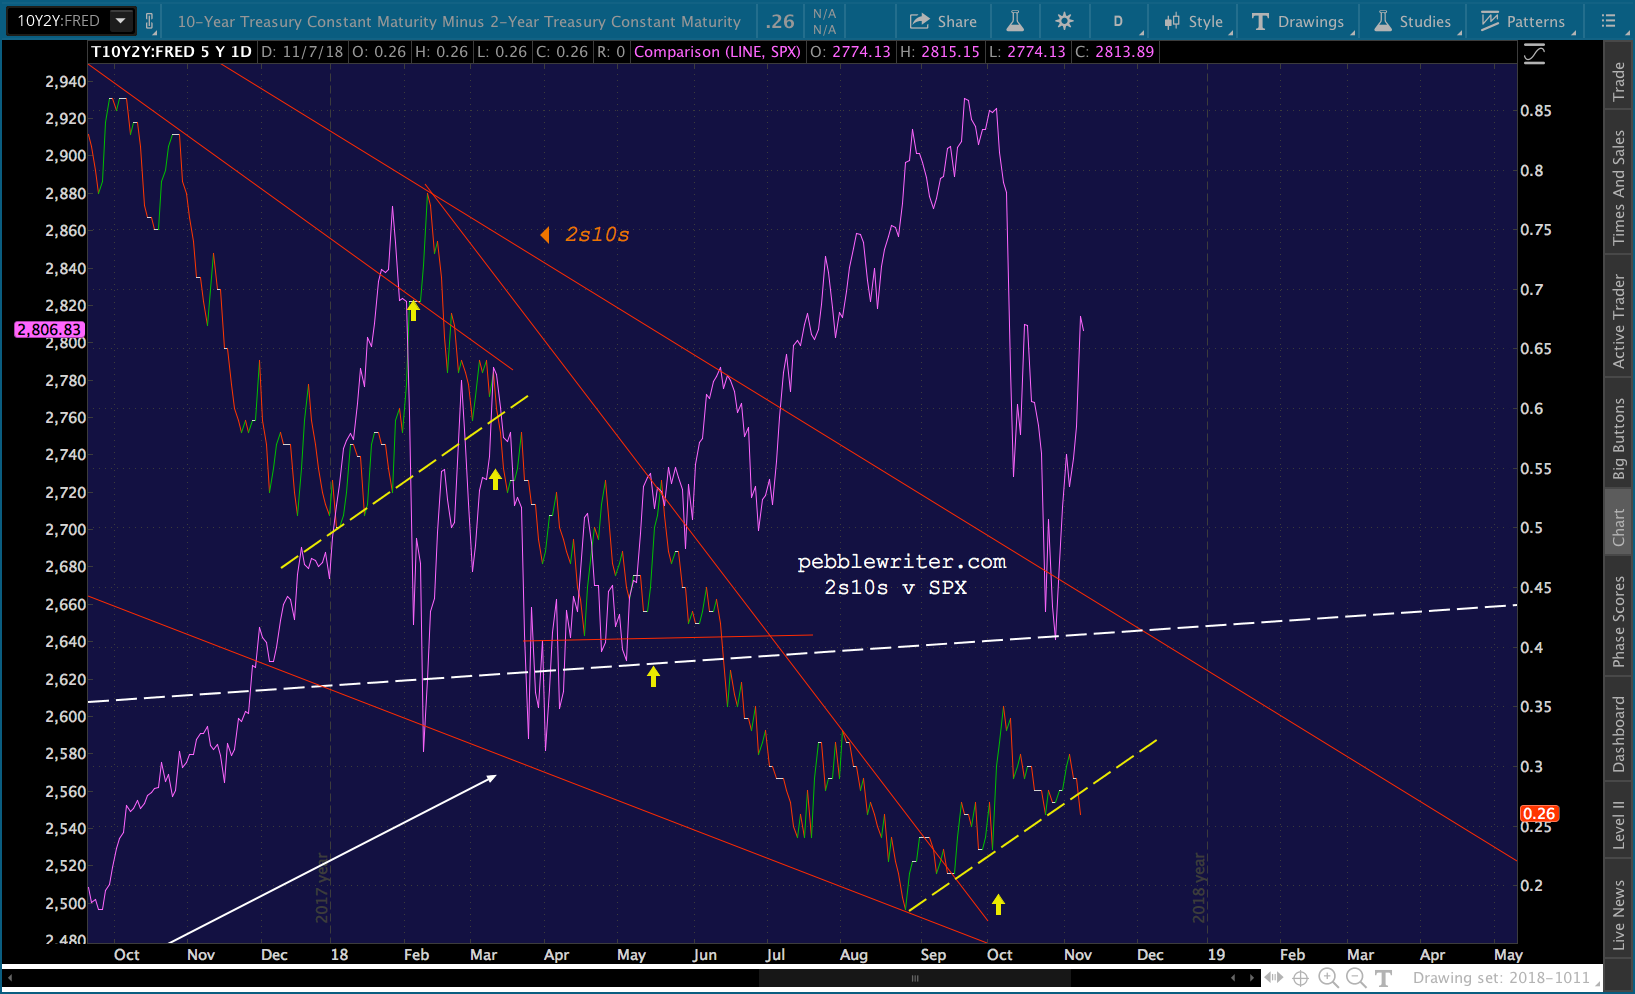
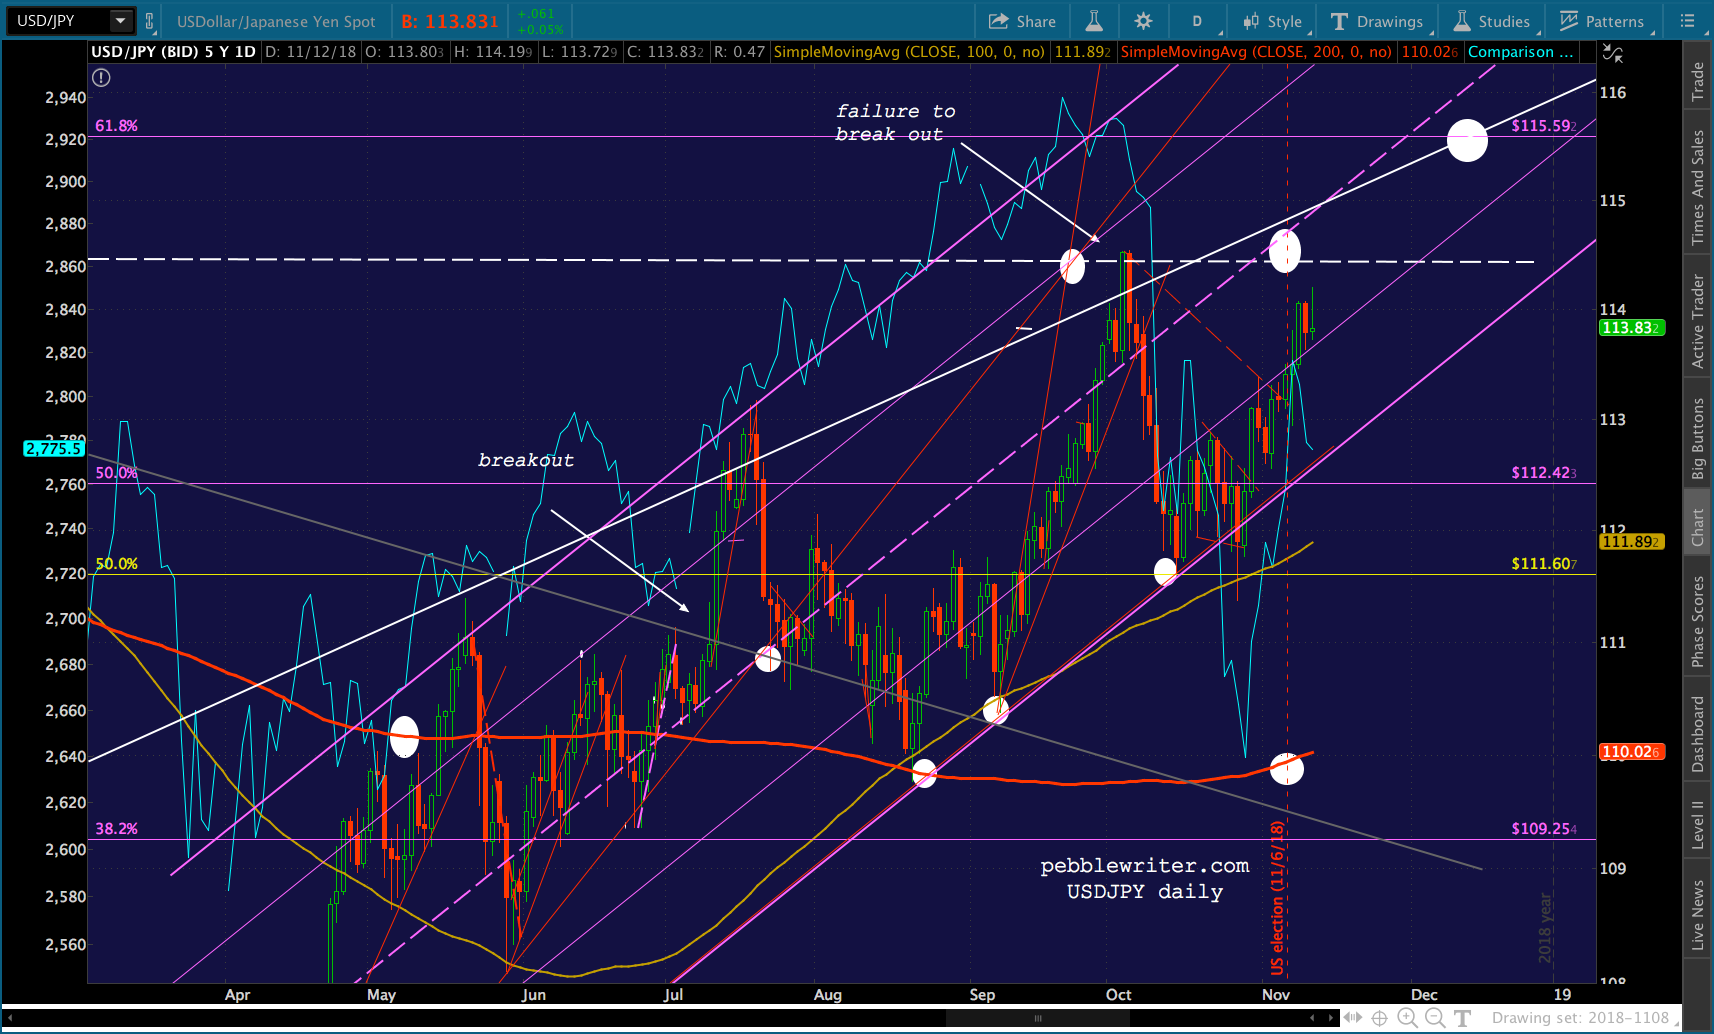
 Right now, USDJPY is doing nothing to indicate it’s going to support stocks. It has retraced .886 of its drop since shorting it at 114.50 — a good place for a reversal.
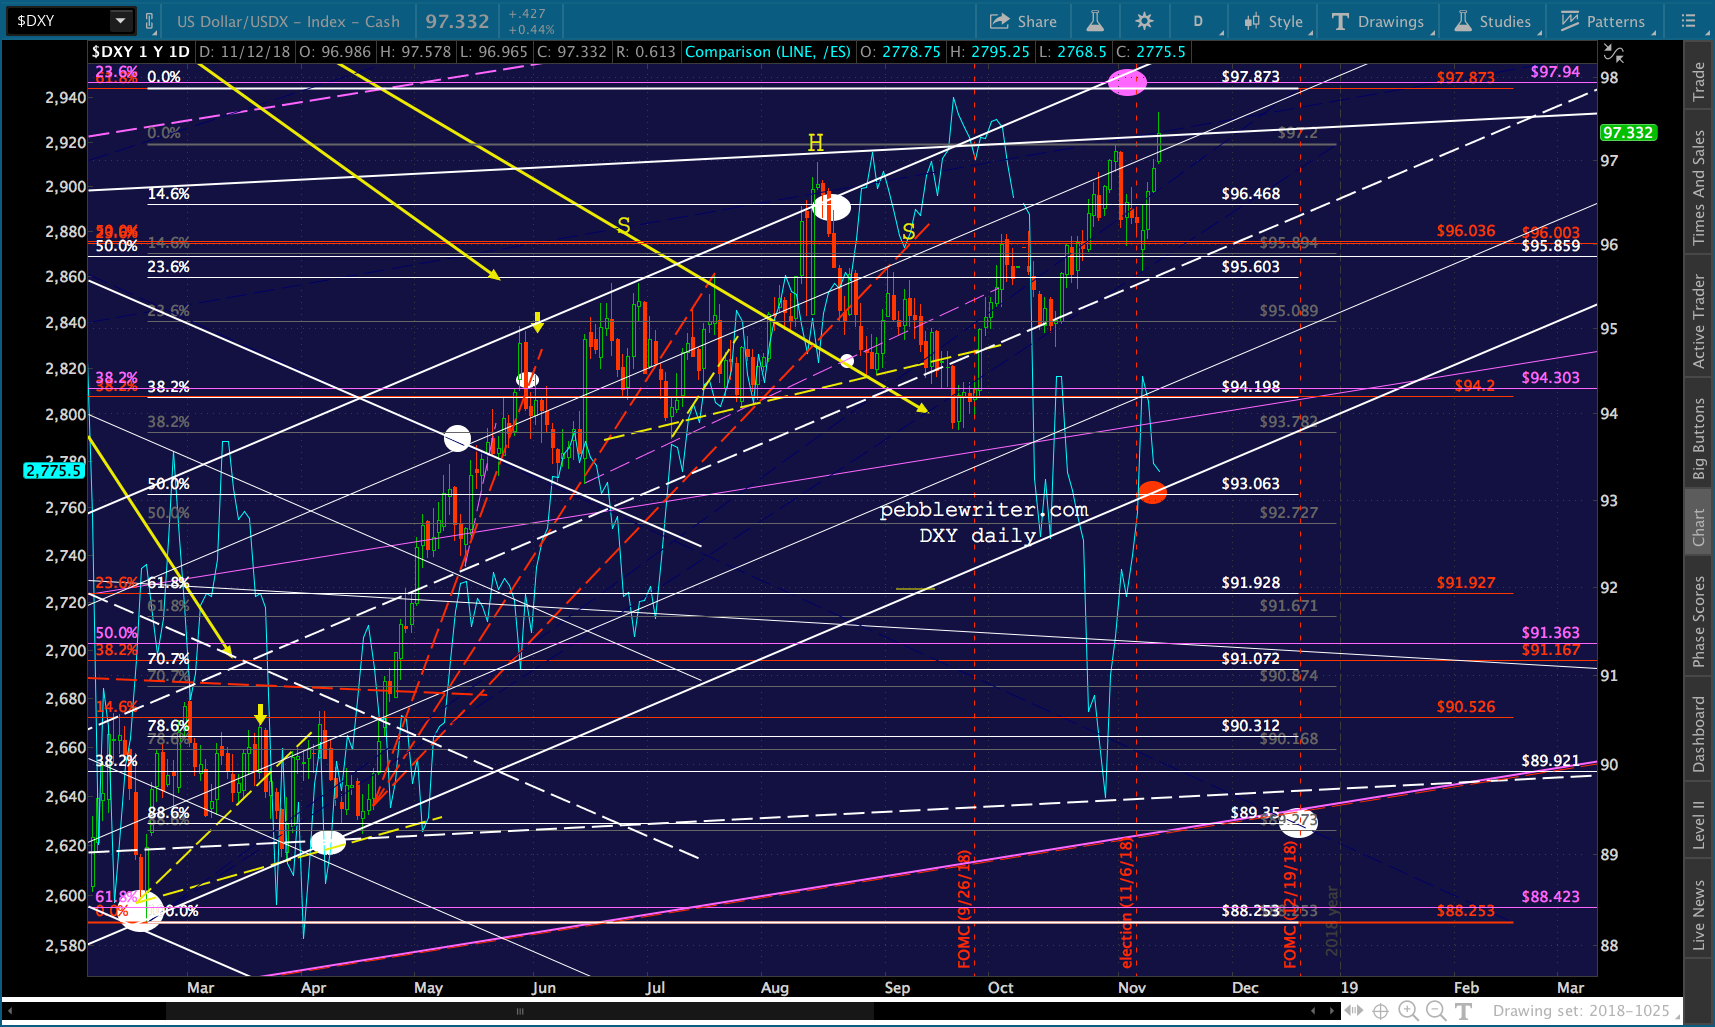
DXY is higher, but solely on EUR weakness. And, note that DXY is drawing very close to our 97.873 target. A sharp reversal, especially if it involves JPY strength, could do some damage to stocks.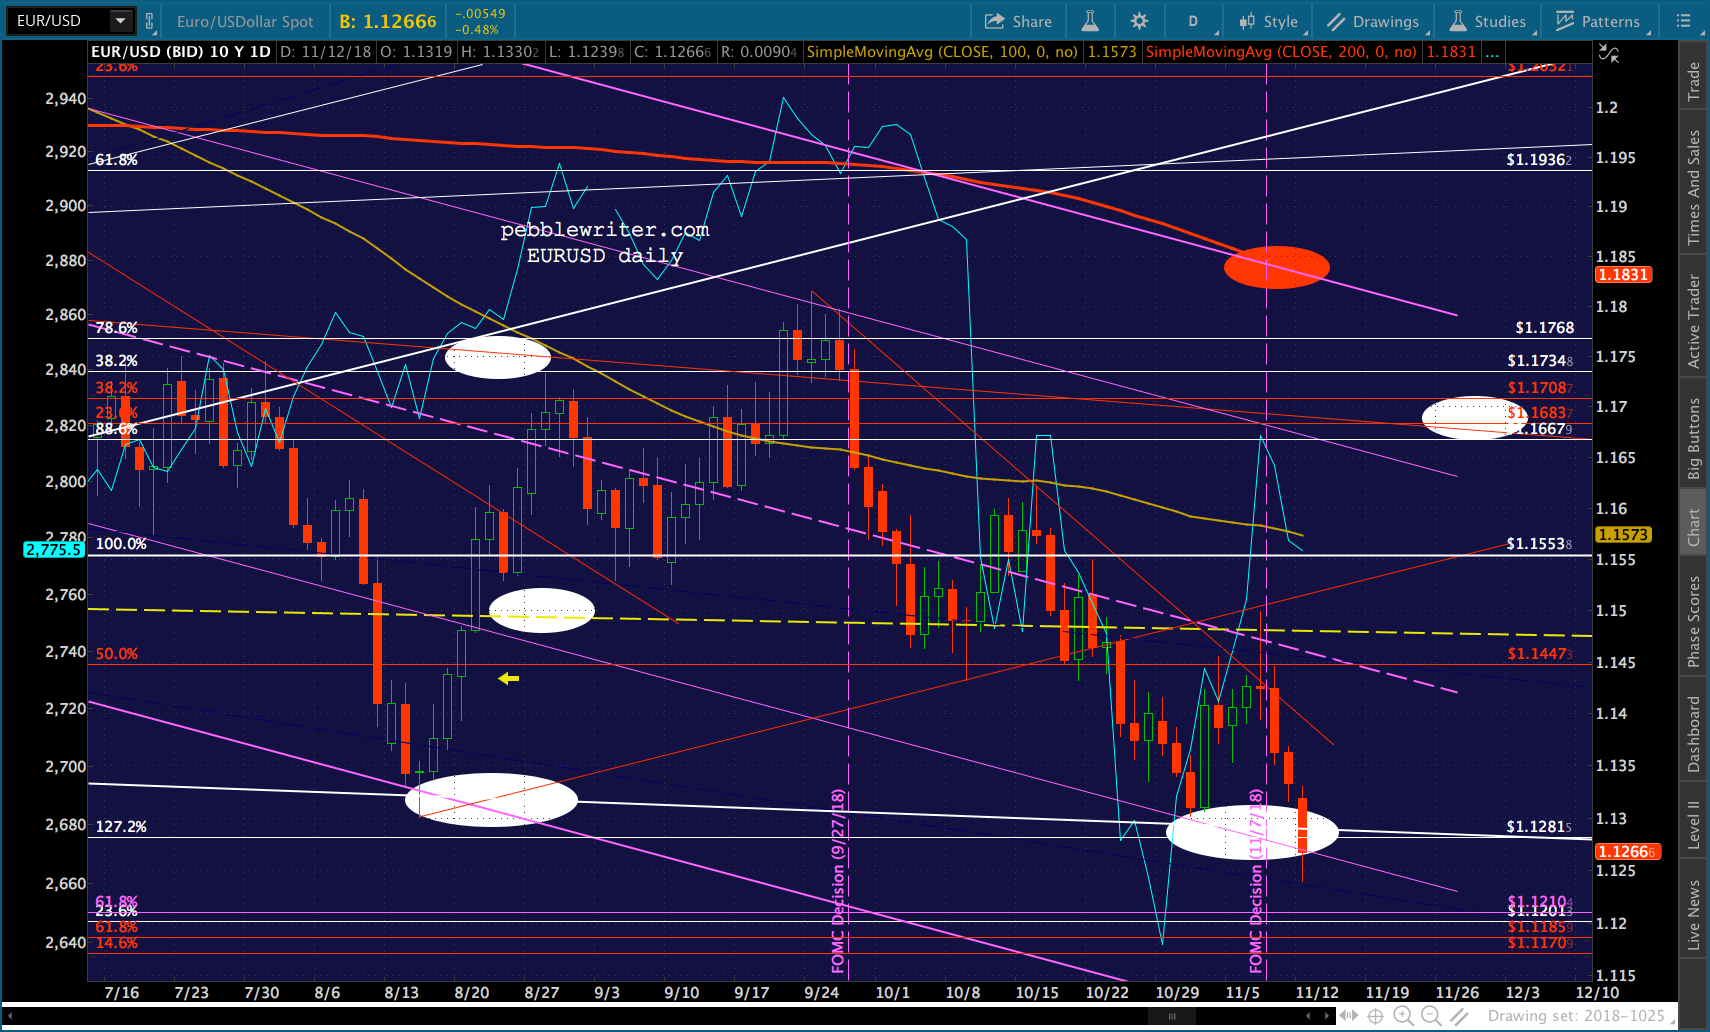
 As I mentioned last week, I’m taking the day off. Just wanted to get this info out there. I might have a chance to check in later in the day.
GLTA.