The big story yesterday was oil and gas, which have now fallen about 29% since our short call on Oct 23 [see: VIX Takes the Plunge.] Importantly, the decline has occurred without decimating stocks. And, the impact on November’s CPI – due out on Dec 12 – will be significant.
Will it matter to the FOMC, which is widely expected to hike rates on Dec 19? PCE is due out on Dec 22. I can only imagine the onslaught of tweets from the White House if CPI comes in at 2.1% and the Fed hiked anyway…
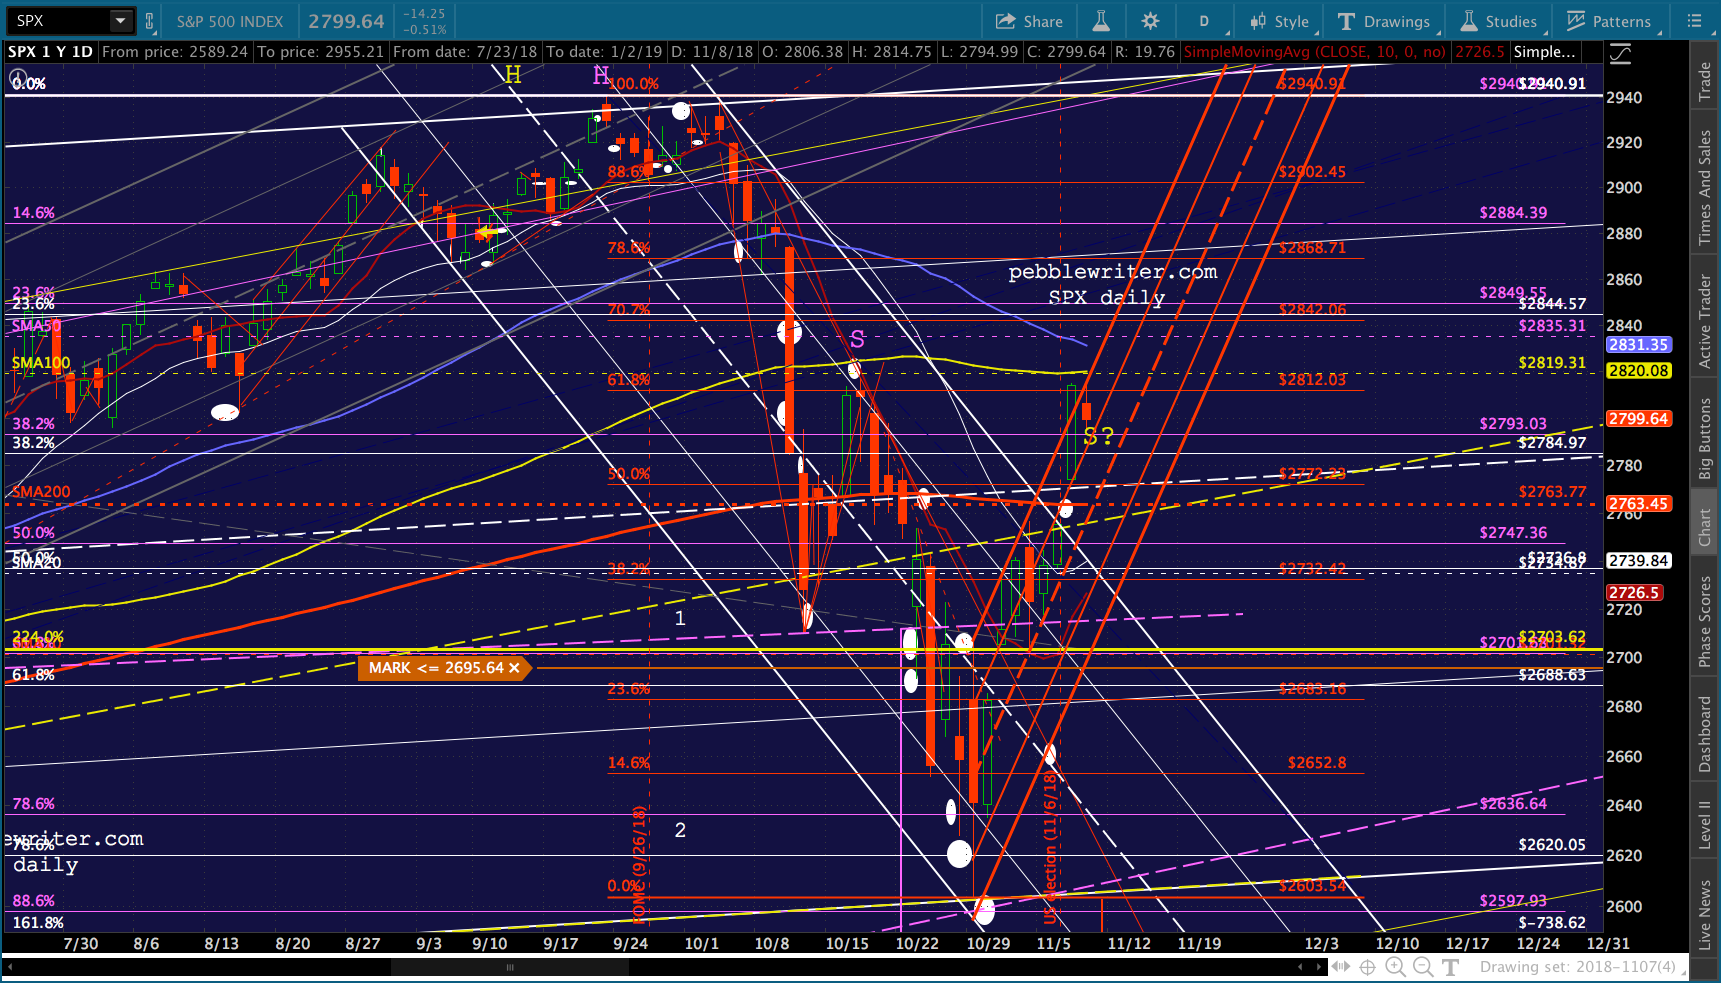
In any case, SPX is at a very interesting place right now. A continuation of the drop would complete a H&S Pattern that targets 2250. A reversal and new highs from here would complete an IH&S that targets 3035.
So far, oil and gas have been a drag on stocks. USDJPY and VIX have been conspicuously non-committal. What say you, BoJ? Are you ready to sacrifice a few thousand points on the NKD for the sake of market integrity?
A quick update on AAPL, which has reached two of our downside targets today…
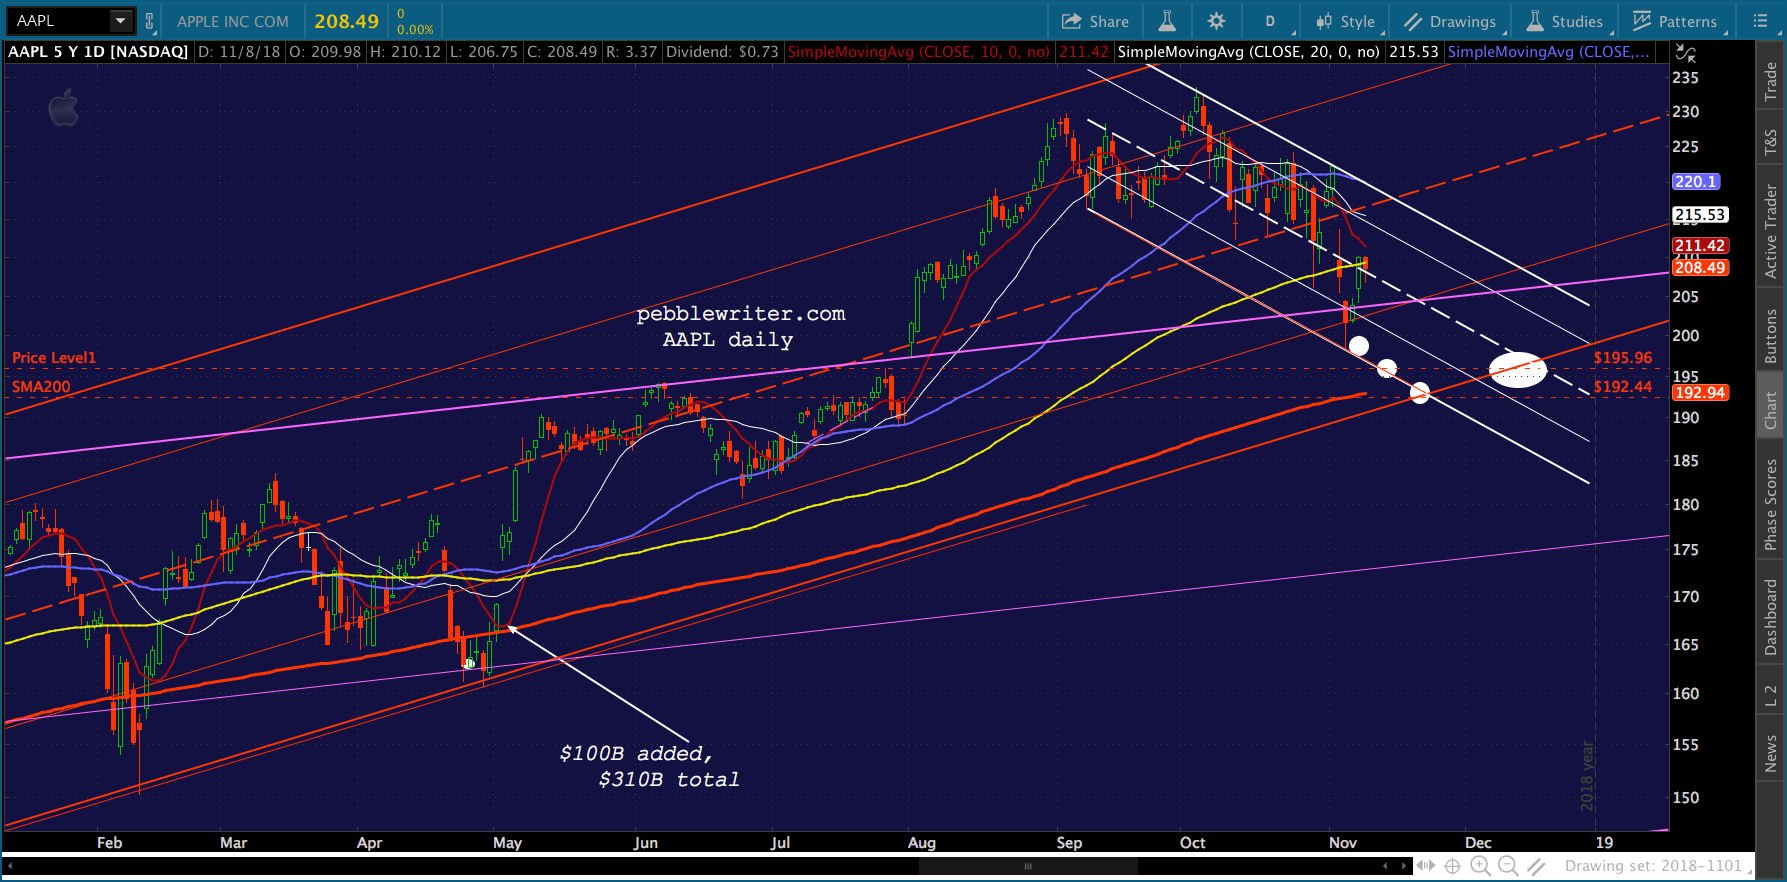
As we discussed prior to AAPL’s earnings report [see: All Eyes on AAPL] the stock had a gap to close and 200 DMA to backtest. The danger in reaching both targets was that AAPL would have to descend below the triangle top above which it broke out in August [see: Focus on the FAANGs.] But, as we discussed, this wouldn’t necessarily be all that alarming.
A drop to 200 or so wouldn’t do much to dent bulls’ enthusiasm. Even a drop to the SMA200, currently at 192.17, could be passed off as a base-building exercise.
It’s been almost two weeks since AAPL posted earnings, and it just reached its SMA200, (one day after closing the gap) posting a low today of 191.45 — an 18% drop from its Oct 3 highs. Needless to say, some bulls are getting nervous.
A quick glance at the weekly chart shows why. If the rising red channel from 2016 doesn’t hold, it’s quite a ways to the first serious support down at the purple channel midline. Maybe it’s time to expand the company’s stock repurchase plan.Don’t own any AAPL? Wondering why you should care? Drops through AAPL’s 200-DMA have been a trap door to some big swoons for the overall market.
With our yield curve model and oil/gas charts screaming “short!” I’d give better than even odds that AAPL’s channel and the overall market are headed lower. If AAPL closes below its SMA200, I’d say it almost certain.Stay tuned.
UPDATE: Nov 14, 2018 – 3:45 PM
AAPL closed below its SMA200 and its red channel is failing. As we noted a couple of weeks ago, the nearest significant support is now the .618 Fib at 144.48.(more…)
I turned on CNBC this morning just to see what the “experts” are saying. Basically, they’re all over the map – trying to explain how the fundamentals indicate various outcomes.
Thankfully, our charts offer a clear path to SPX’s next downside objective: the 2.24 extension at 2703.62. Yes, again.But, if our yield curve model works as well as it has in the past, we could see a much bigger drop than that. We first explored this model last February [see: Does the Yield Curve Matter? A Closer Look.]
Since then, it has facilitated many accurate forecasts. Right now, it’s suggesting even more downside.If CL and RB (which just officially tagged our 1.5915 target overnight) fall any further, SPX could be in for quite another tumble.continued for members… (more…)
ES reached our next downside target on Friday, though SPX came up a few pennies short. The more interesting story is oil and gas, which — after tagging our downside targets on Friday — are both up nicely on reports of an OPEC production cutback.Will it be enough or in time to prop up stocks?
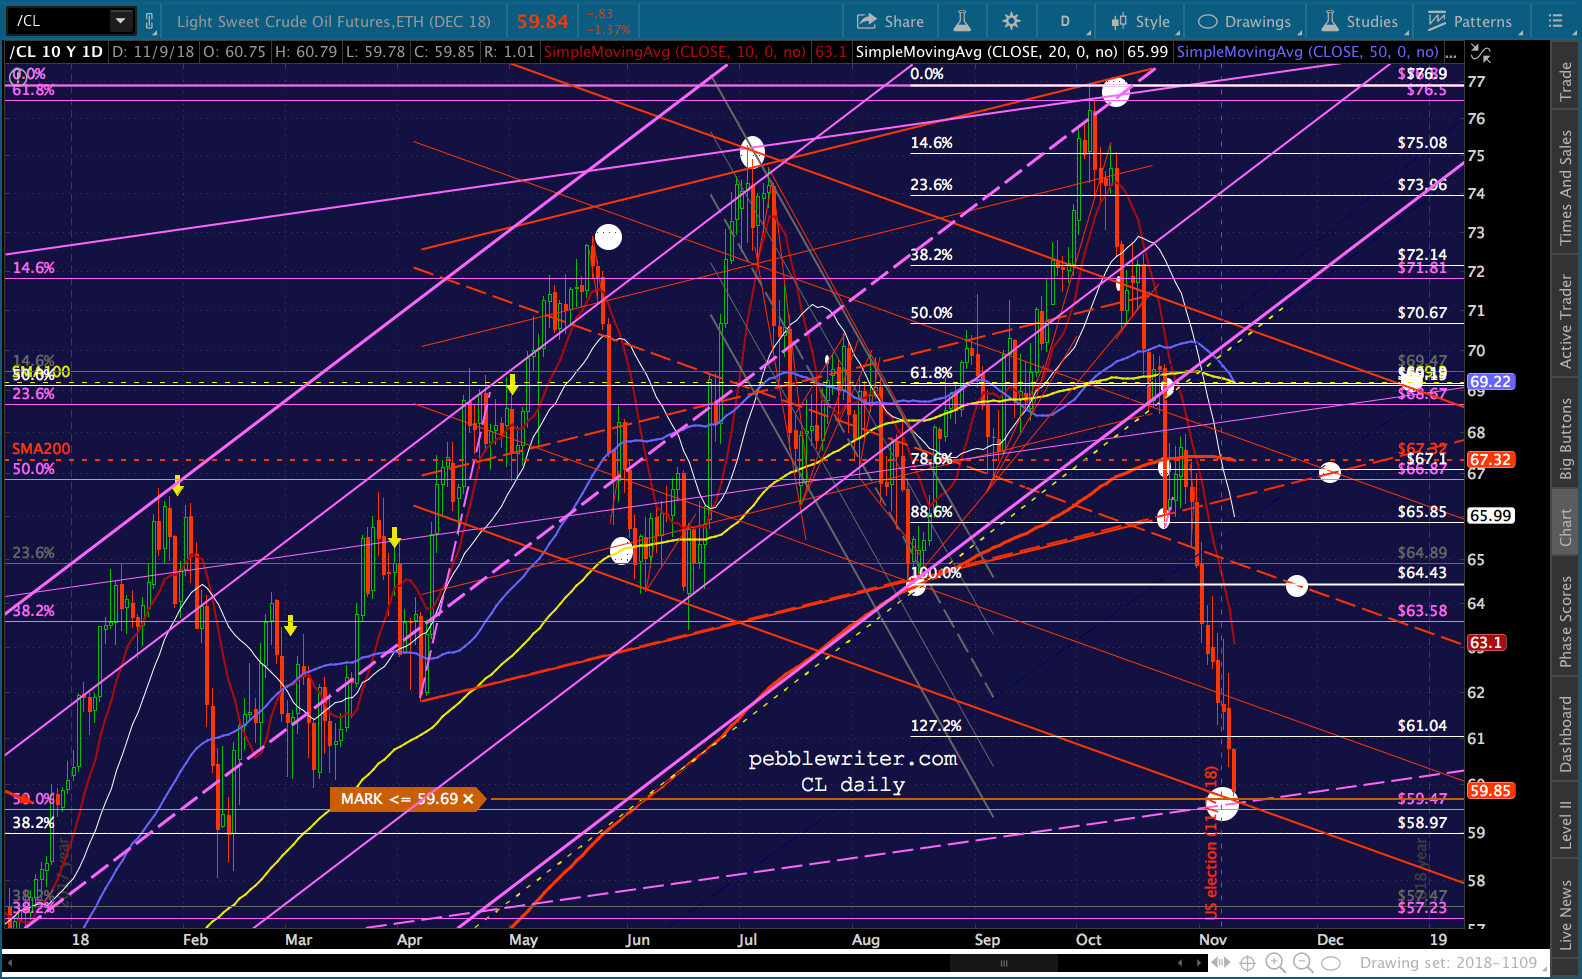
CL just reached our next downside target of 59.47…
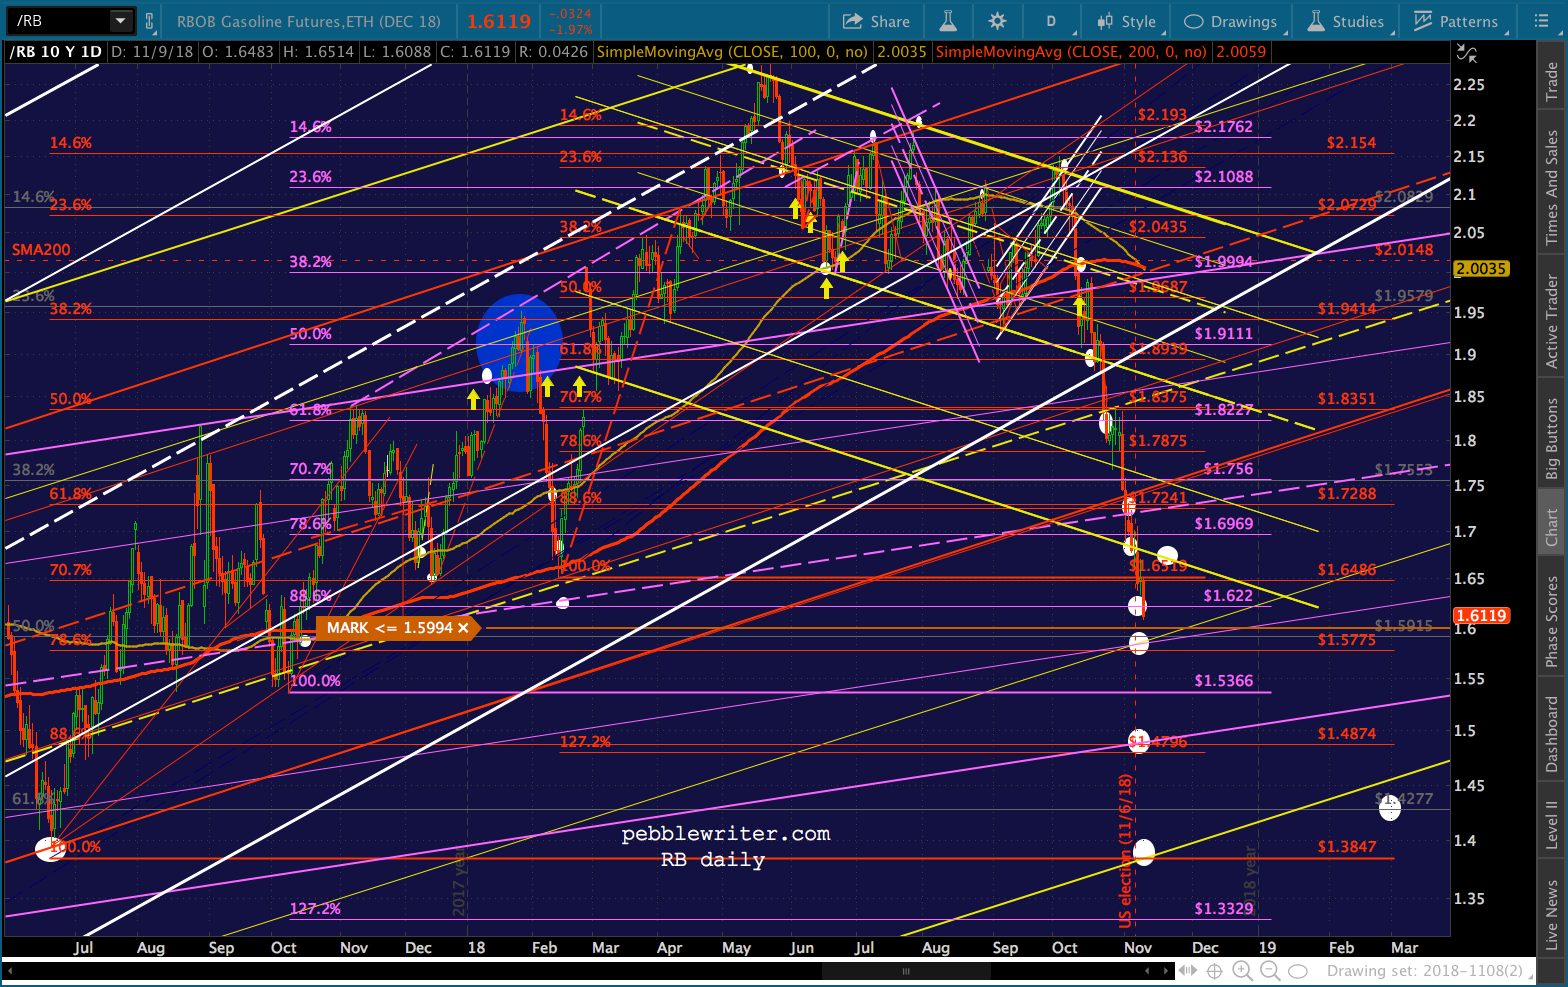
…and, RB has reached our target range of 1.58-1.62. This is important support for both which, if broken, would portend much more downside.
This completes a nearly 23% gain for CL and a 25% gain for RB since our Oct 3 top call [see: VIX Takes the Plunge] and brings our YTD gains to 155% for CL and 158% for RB.
As we detailed yesterday, this move was as much about politics and chart patterns as it was about supply and demand [see Trump: Falling oil prices…that was me.”] Now that the election and the Fed’s latest meeting are over, we can focus on November CPI. Ultimately, oil and gas’ path forward will decide much about interest rates and broader markets.
continued for members…
59.47 is the intersection of the rising purple channel midline, the bottom of the falling red channel and the purple .500 Fib line. If it fails, there are much lower targets that would come into play: the gray .382 at 57.47, the purple .618 at 55.36, the gray .500 at 51.47 and the purple .886 / white .236 / gray .618 at 46.02.Note that CL also came quite close to the white .382 retracement of the drop from 112 to 26 — a typical retracement for a retreat from the .618 at 79.32.
If it bounces from here, the leading candidates are the previous low and falling red channel midline at 64.43, the SMA200 and rising red channel backtest at 67.1 and the white .618 and red channel top at 69.19. While 59.47 is potentially low enough to get CPI back under control, it should leak a little lower intraday to facilitate RB – which the charts show could really benefit from tagging 1.58ish. There, it would enjoy not only red .786 Fib support, but channel line support as well.
If that support doesn’t hold, there isn’t much help until the purple channel bottom at 1.48, followed by the previous low and yellow channel bottom at 1.3847. If RB catches a bid here, we can look for it to backtest the broken yellow channel at 1.67ish, the broken red channel at 1.75ish, and the yellow midline at 1.84ish.Futures are off about 18 points this morning, dropping slightly below the horizontal support at 2800.The drop is being facilitated by oil and gas’ drop, VIX’s manicured rise and USDJPY’s pullback. So, I continue to expect at least a backtest of the SMA200 (2764.67 and dropping slowly) as the SMA10 rises to meet it over the next day or two. Many of our factors, however, argue for a much larger drop.
The 2s10s has clearly broken down.And, VIX has bounced nicely off its SMA200. While the red channel breakdown has aided in the latest equity bounce, previous moves above the SMA200 have produced very sizeable drops in SPX. The trick for bears would be in getting VIX up past 27ish.And, USDJPY faces yet another important test of overhead resistance. A failure to punch through (remember, this is a backtest of the broken white channel) would be quite bearish for stocks.For SPX, this translates into at least a backtest of its SMA200, currently at 2763.49. If they stretch it out till later next week, they can flesh out the rising red channel and backtest the yellow midline at the same time.If I massage ES’s rising channel a bit, next Tuesday looks like a very good possibility.As we’ve seen in many past meltups, backtest opportunities are sometimes ignored in pursuit of “higher at any cost.” But, by the same token, the past 9 months have seen a few backtests break down and open the door to big plunges.
Don’t be in a hurry to go long on RB, as it probably has further to go. CL might get a playable bounce, but stops are a very good idea. We don’t know the exact level at which CPI can be brought down to a level acceptable to the pols or, more importantly, the Fed.
VIX has more upside as long as it holds the little red TL – parallel to the purple one which served us well last month.This remains a time to be cautious. Only stay short over thefb weekend if you can handle the gap risk. Our yield curve model says we could be in for considerable downside. Remember, SPX doesn’t like breakdowns of the rising or horizontal support or breakouts above falling TL resistance.
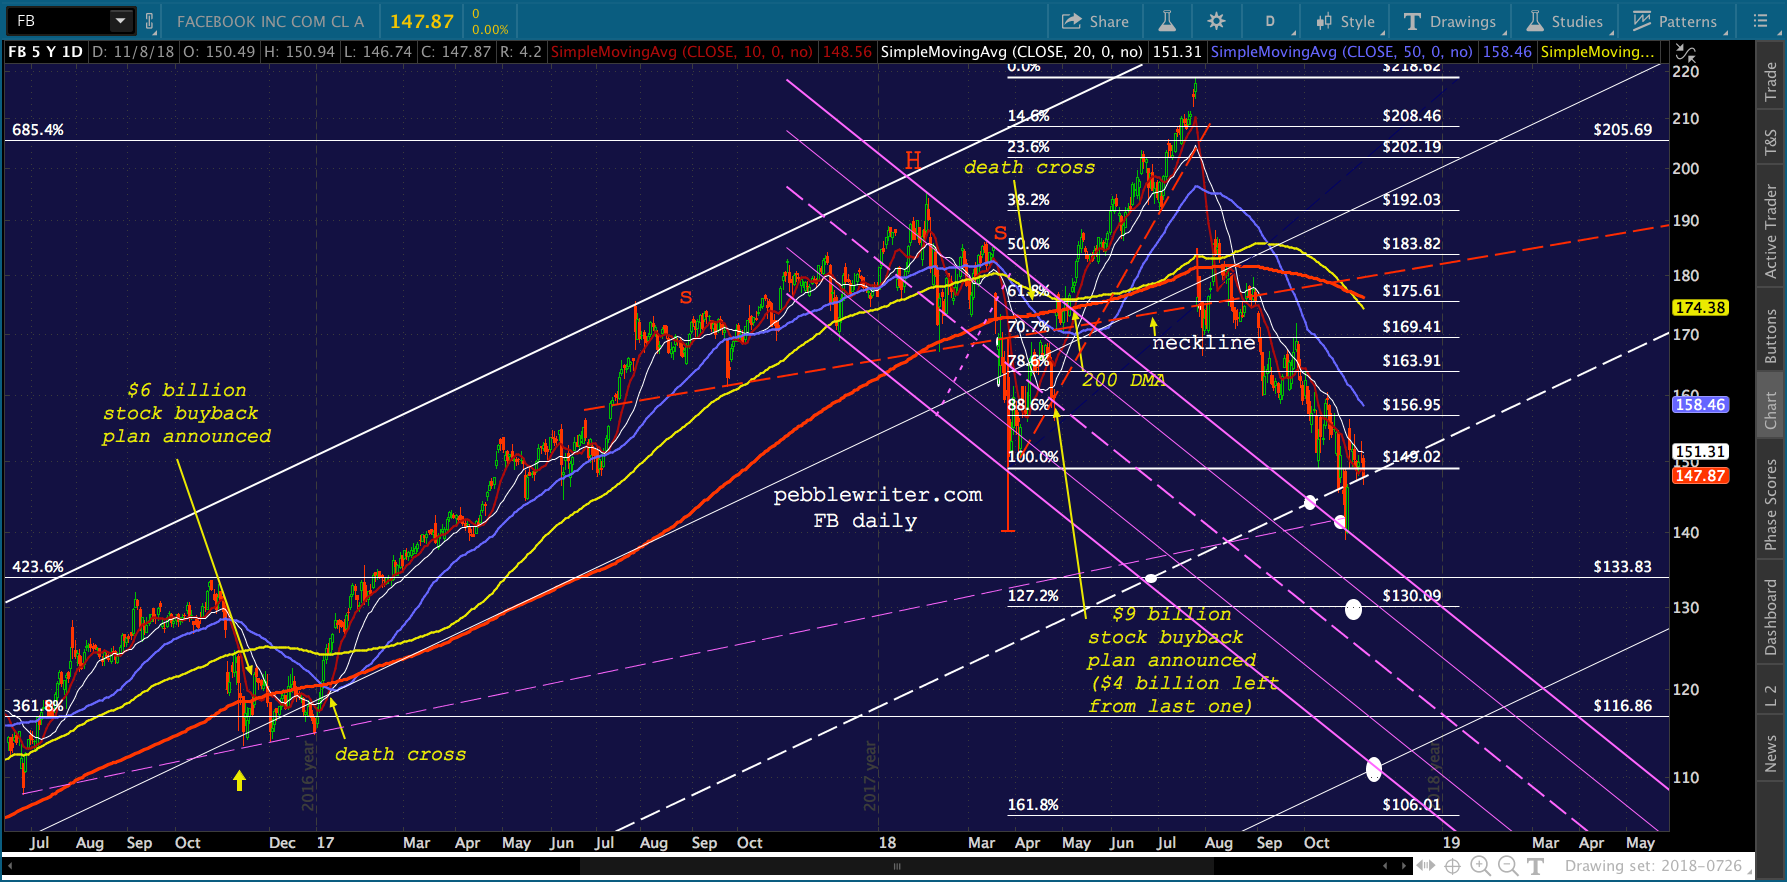
And, right now, we’re seeing the latest rising yellow TL break down.If COMP doesn’t hold its SMA200… …then, AAPL and FB could easily pace it to a 10% loss.If that should happen, it’s highly unlikely SPX would hold its SMA200!
I’ve been working some pretty crazy hours lately, so I’m going to get an early start on my weekend. I plan on taking Monday off, but we’ll see how things go.
I have long looked at interest rates, inflation and politics as at least as important as supply and demand in forecasting oil and gas prices. After July’s 2.95% CPI print and subsequent spike in interest rates, it seemed obvious that the Fed faced a dilemma. From Currency Crisis on the Horizon:
…the rise of inflation — caused primarily by rising oil and gas prices — is a problem. If oil and gas prices decline, inflation is reduced by quite a bit. But, the latest rally in stocks was greatly bolstered by the breakout in oil and gas. If the breakout goes away, would the rally?
Oil dropped nicely over the next week, but began a sharp rally that lasted from from mid-Aug to early October. Gas put in another leg lower through Sep 6 before joining in the rally. Sure enough, stocks responded positively. SPX gained 5%. But, the 10Y soared from 2.80 to 3.25%. Ouch.
It was obvious that oil and gas needed to come back down lest inflation and interest rates get out of control. CL (WTI futures) reached 76.9 and RB (gasoline futures) 2.15 on Oct 3 when we pulled the plug in VIX Takes The Plunge:
…CL and RB, which not only reached overhead resistance by our measure, but must deal with bearish API data, another round of Trump tweeting, and a large build in EIA inventory. I think the time has finally come to revert to short, but with tight stops in case this is a head fake.
We delved further into motives on Oct 16 in Appearances:
…since Trump is desperate to reverse the rise in gas prices, inflation, and interest rates between now and November 6 (and, to salvage billions in arms sales) don’t be surprised if we get that next leg down in oil prices very soon.
While baffling those who focus on fundamentals and various geopolitical risks, these price moves made perfect sense when viewed through our favored prism: “what do TPTB need them to do?”
That equation, my friends, boils down to a few essential elements: inflation, stock market support, politics and chart patterns. We know the administration craves lower inflation and interest rates and has been agitating for lower oil prices in order to accomplish this.
It’s interesting how Khashoggi’s murder top-ticked oil and gas prices – and, so soon after Trump’s latest demand that OPEC lower oil prices.
I’ve received more than a few sideways glances over the past month, especially from those focused solely on fundamentals who felt it was ludicrous to suggest that Trump might be manipulating oil and gas prices in order to achieve his political goals.
Yesterday, Trump came to my defense.
click above to watch
“If you look at oil prices they’ve come down very substantially over the last couple of months,” Trump said. “That’s because of me. Because you have a monopoly called OPEC, and I don’t like that monopoly.”
Translated: “Voters were becoming increasingly agitated about soaring gas prices and I needed to get them back down prior to the midterm elections. I’d also like some ammunition at my disposal to keep a lid on further FOMC rate hikes.”
Touting his success in bringing prices down, of course, is specious at best. Current WTI prices are actually higher than they were before Trump’s “provocative actions” response to the February Israeli-Syria-Iran conflict laid the groundwork for his subsequent withdrawal from the JCPOA which sent prices soaring.
* * *
CL and RB have reached every downside target we’ve set for them so far, with one potential last leg down looking fairly likely. Our Oct 3 short call has produced a 20.5% gain in CL and 23.7% in RB.
But, my point isn’t to toot my own horn — though we have enjoyed a string of nice results [OIL and GAS].
I simply think it would be wise for analysts to consider central bankers’ and politicians’ objectives whilst laying out their forecasts.
continued for members…
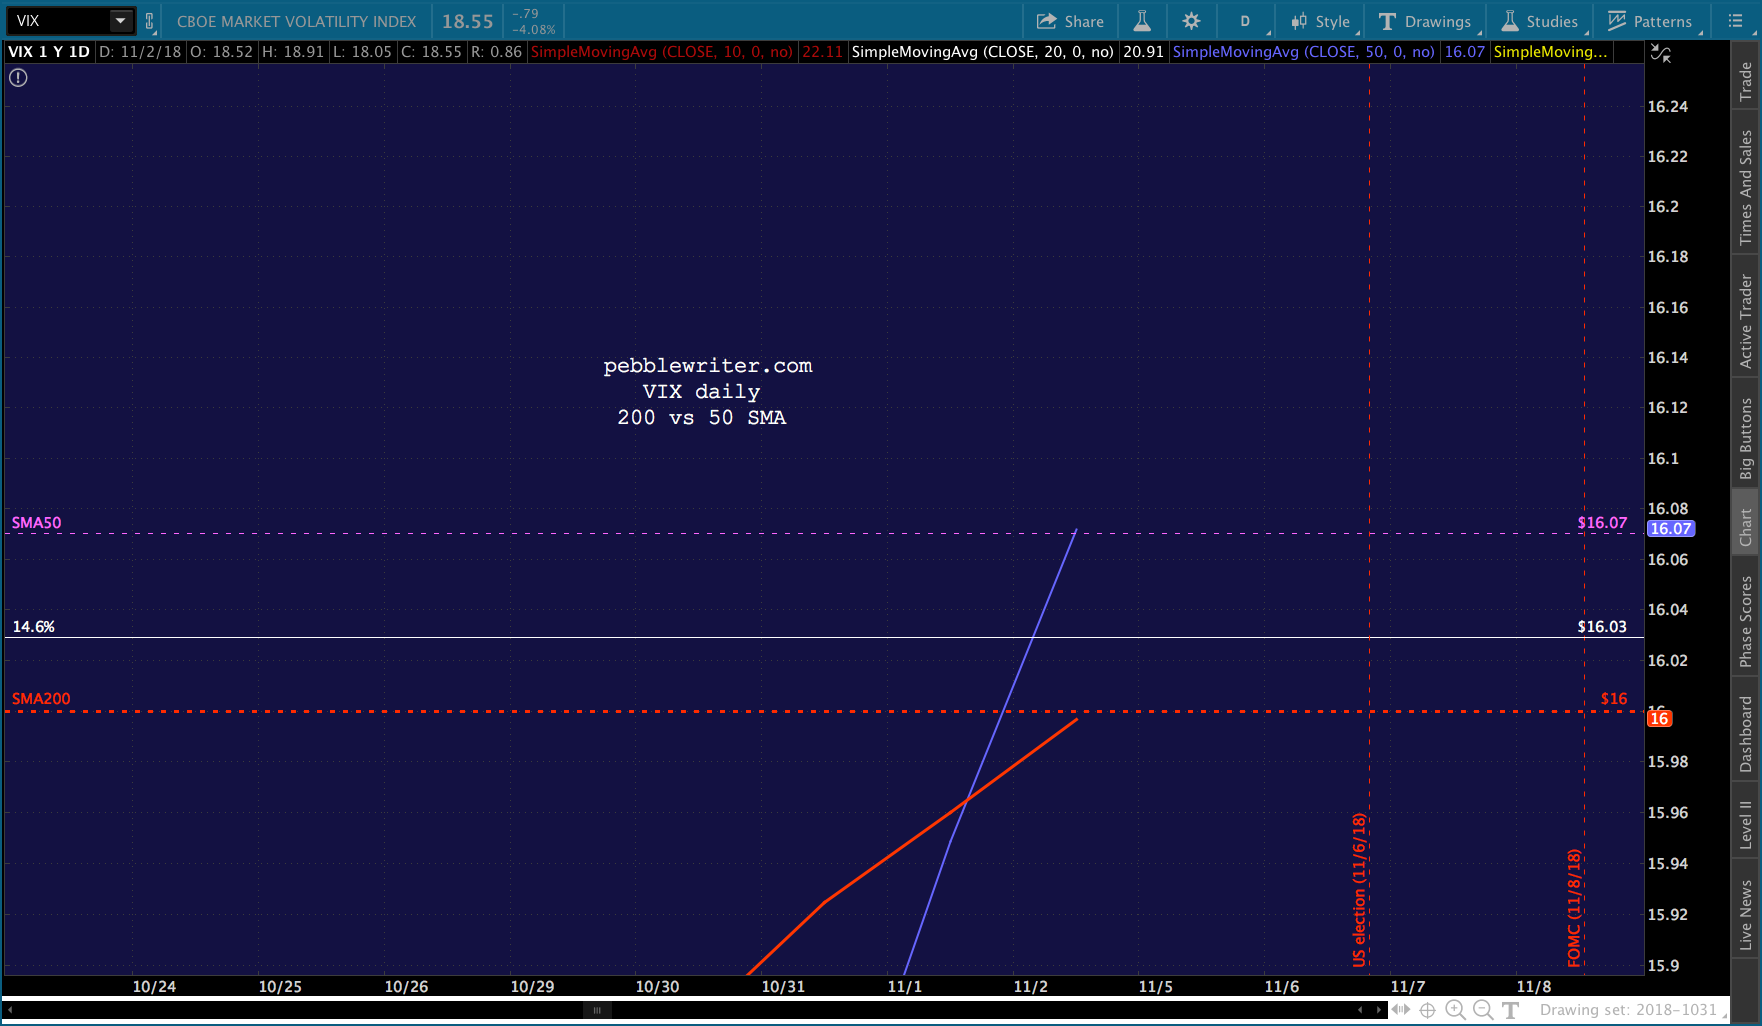
VIX is still sitting just above its SMA200, so we’ll know soon enough whether or not stocks have topped out. USDJPY continues ramping higher.As such, stocks are in limbo – waiting to hear what the Fed has to say, which could potentially be damaging, but with the usual downside protection. Note that even COMP is sitting atop its SMA200.I have to run out for a meeting, will post more later.
UPDATE: 2:00 PM
The FOMC statement…
UPDATE: 2:45 PM
Nice downturn, so far. VIX is bouncing, so this reversal might have legs.UPDATE: 3:20 PM
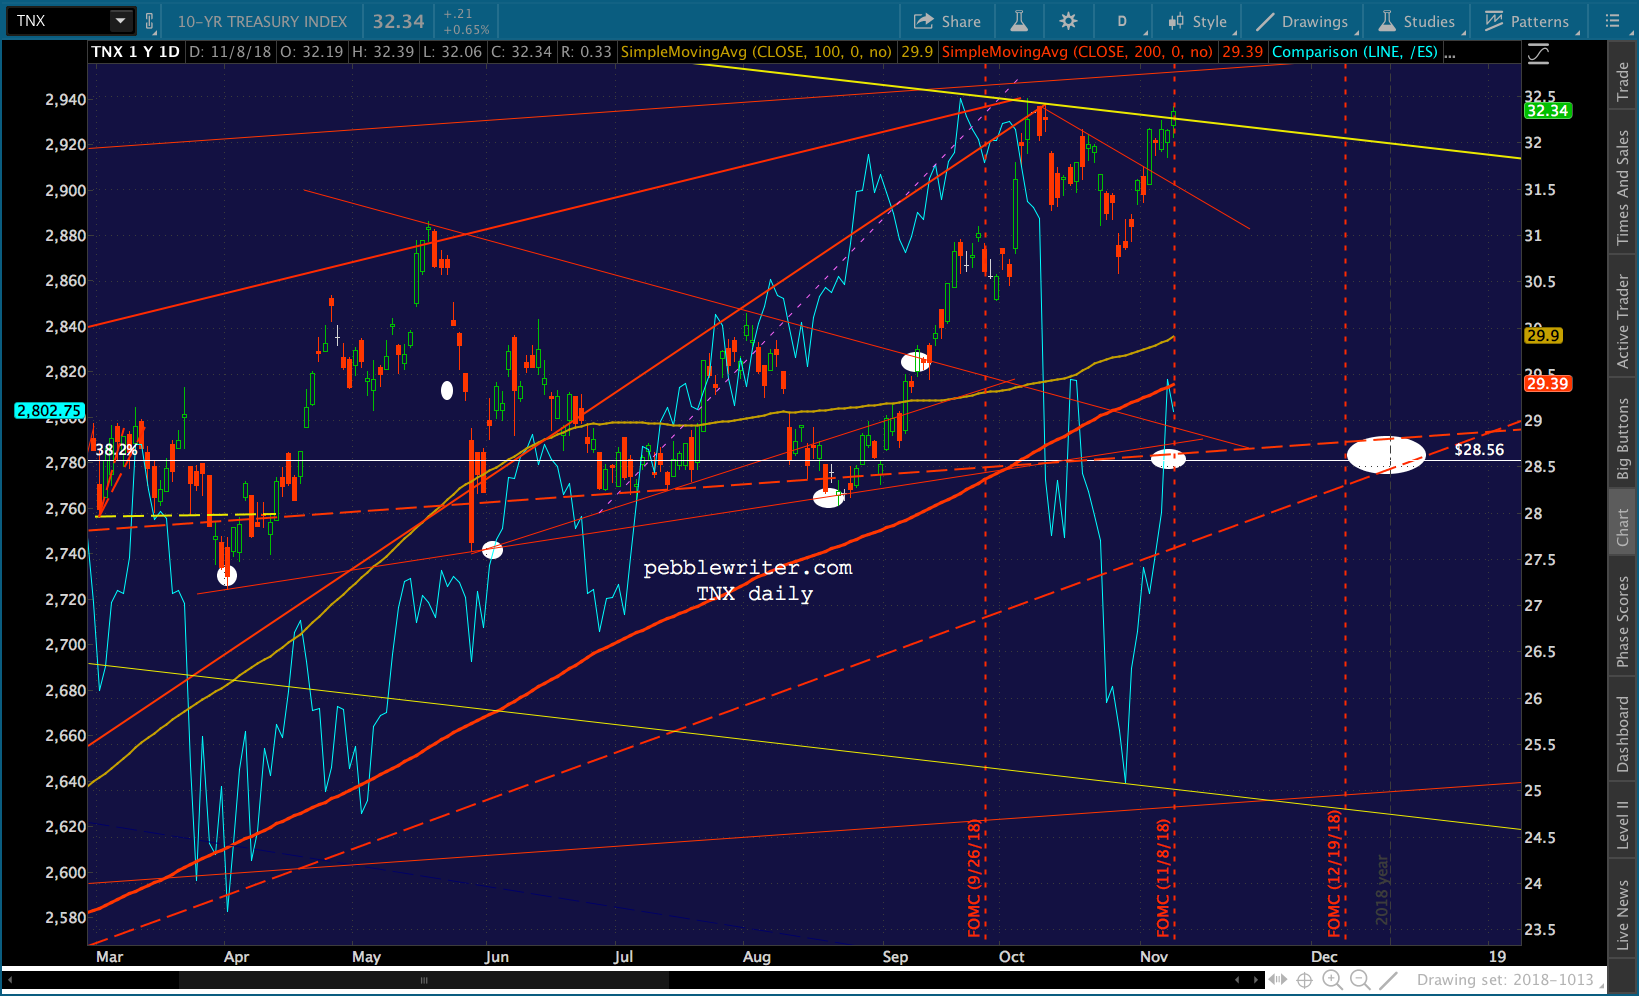
I suppose the minutes weren’t dovish enough. TNX, DXY and USDJPY are pushing higher…
…while EURUSD is headed lower.ES and SPX are still clinging to 2800.And, interestingly, COMP is back below its SMA200. If we can just get a nice bounce of of VIX’s SMA200, we should see SPX back down to its SMA200. Again, if it can’t hold, we have a slew of targets ranging from 2600 to 2703 that would align nicely with our COMP target. More on this later.CL is soldiering on toward our downside target. When it stops, RB should too. The latest catalyst is almost laughable. Now, Saudi Arabia is considering disbanding OPEC. Riiiiight.
Baffled by soaring futures in the wake of an election which ushered in gridlock? Don’t be. As we witnessed after Brexit and the US election in 2016, algos were easily driven higher by VIX and USDJPY. Last night was no exception.
USDJPY, which had dropped below its latest straw man TL, suddenly reversed and spiked higher exactly at the same time that ES dropped through its yellow channel midline. Only after ES pushed through its SMA200 did USDJPY settle back down.Likewise, VIX dumped below its horizontal resistance just in time to ensure a big, green opening. Oil futures even got in on the action, just for good measure. Following a very bearish API inventory report, CL spiked higher anyways. The net result: ES is not only higher but is accelerating higher and will easily allow SPX to gap above its SMA200 on the open. With ES’ and SPX’s 2.24s and SMA200’s behind them, is the coast clear for equities? Hardly.
Futures are off modestly on an important election day which will hopefully resolve plenty of unknowns.On the bullish side of the aisle: both ES and SPX are safely above and have backtested their 2.24 Fib extensions; oil and gas have fallen sharply to decent support levels; VIX is at a modest level with a clear path lower if necessary; USDJPY has a clear path higher – at least temporarily.
On the bearish side of the aisle: inflation should be much lower in Oct as a result of oil and gas declines; interest rates are still pushing against important resistance; VIX experienced a golden cross on Friday; FAANGs are providing bearish leadership; and, many fundamental analysts have pronounced a democratic surge as bearish.
Both sides have played to their bases in this midterm. In several cases, this has resulted in excellent results for our forecasts. Consider, for instance, how much gas prices have dropped — mitigating the damage done by Trump’s Iran sanctions and helping our oil/gas forecasts working out quite nicely.The assistance provided by currency moves has played nicely into our USDJPY forecast.As we learned after the 2016 election, the market moves the way the algos dictate. The only question is whether the algos will receive enough “guidance” to keep stocks on the rise. It should be an interesting next couple of days.
Futures are back to flat, having bounced a bit on the Iran sanction news as it provided a modest (so far) bounce for oil and gas prices.The market has a wait and see feel to it this morning, with AAPL breaking down further……but, the algos all but ignoring it, focusing instead on dollar strength (TNX is higher again) and oil’s potential recovery. AAPL is now off almost 14% and is nearing our channel target [see: All Eyes on AAPL] with the gap close target of 195.96 and SMA200 target (currently 192.44) looking better all the time.
Members might wish to revisit last week’s post on VIX [see: VIX’s Warning] in which we discussed the bearish implications of the impending 50/200 cross. This morning, it’s alive and well.continued for members…
The headlines have been coming fast and furious over the last 24 hours. First, Trump’s tweet yesterday morning regarding trade negotiations with China touched off a rumor, declared false this morning, that a trade deal was imminent. But, SPX soared yesterday anyway.
Then AAPL’s earnings came out. The numbers were underwhelming; and, the company’s announcement that they’d no longer report unit data was very poorly received.
The chart we put up yesterday prior to the close [see: All Eyes on AAPL] showed substantial downside potential… …which after-hours trading is confirming.Then there was this morning’s payrolls data: a 250K increase with a 3.1% increase in average hourly earnings. While no doubt It’s exactly the sort of data the Fed needs to justify further rate increases in the face of the collapse in oil and gas prices — the last piece of the puzzle.
Gasoline has now fallen over 20% since our Oct 3 short call and tagged another downside target yesterday.Oil is off over 16% and just broke beneath horizontal and channel support. To be sure, it will keep October’s CPI low and will delight voters driving to the polls on Tuesday. But, like the employment data, there are repercussions.By the way, I have updated our oil and gas forecasting results, available at the links below.
I hope to post currencies, VIX and gold later today or this weekend.
Futures melted up to backtest the SMA200 early this morning and have since fallen 16 points to the algo-darling SMA5 200. It remains to be seen how the mixed messages being sent up from Washington and Cupertino will play out. But, for now, I’m leaving our targets in place.For the moment, at least, VIX’s 50/200 cross is on again.continued for members… (more…)


 continued for members… (more…)