Month: October 2018

  • Decision Time…Again

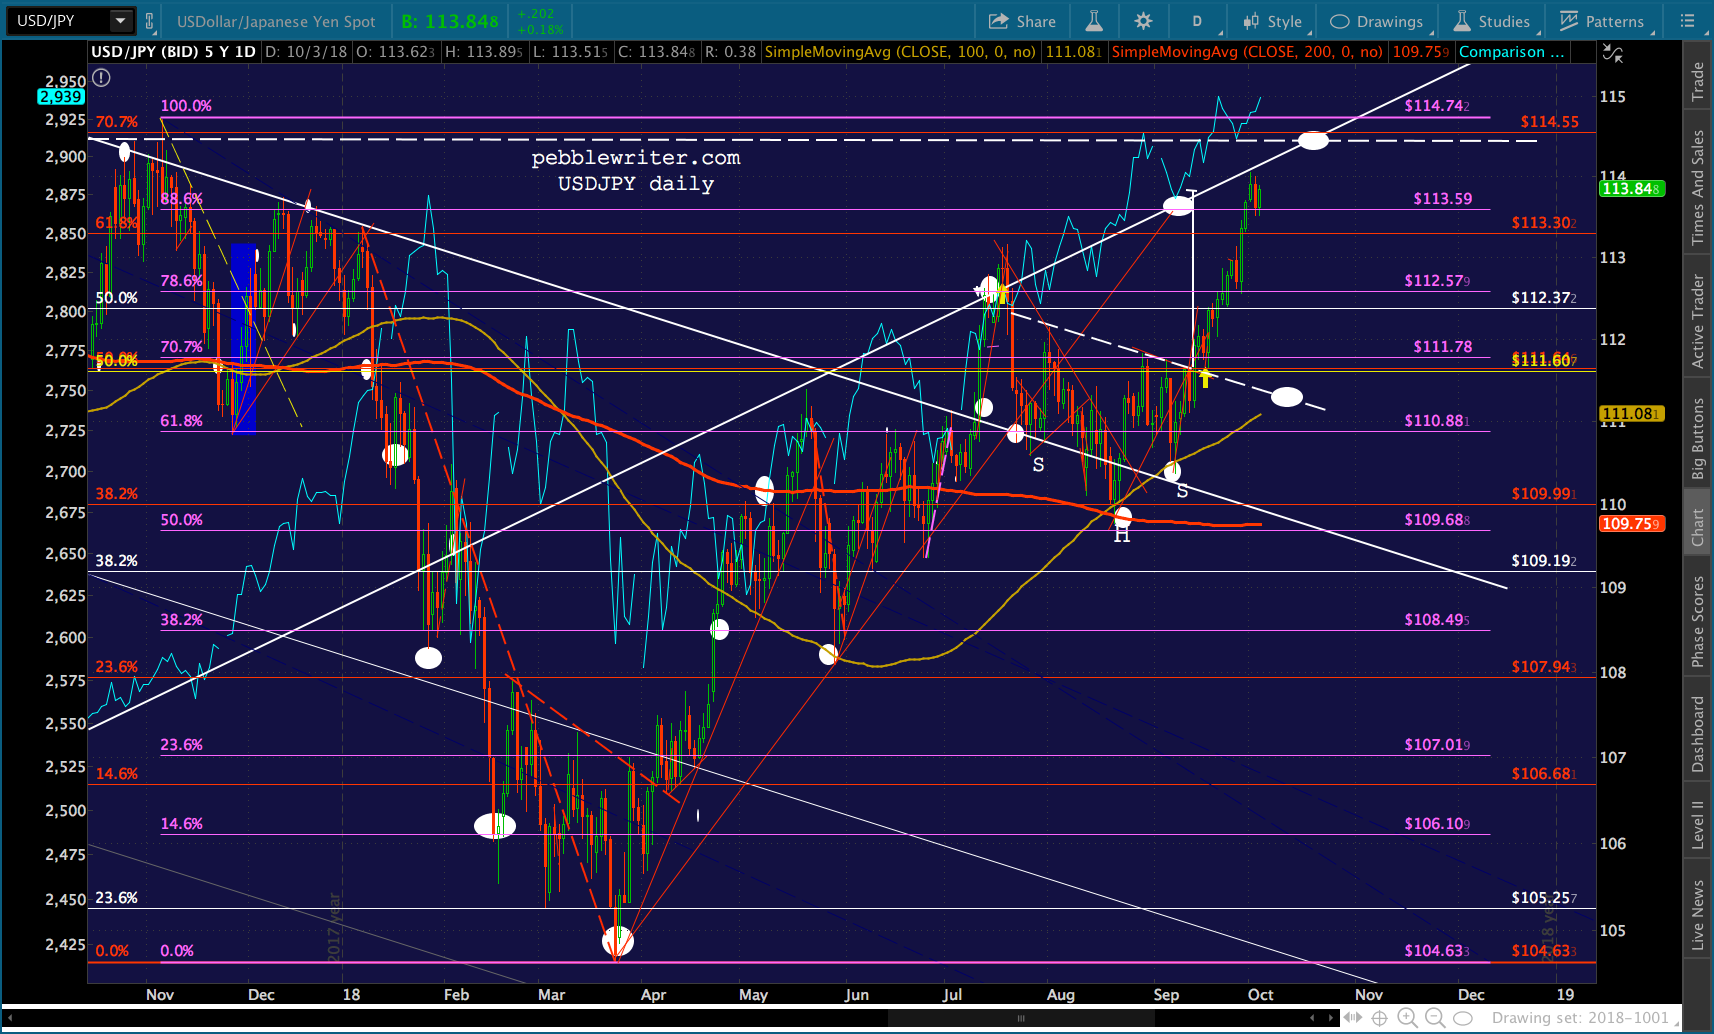
    VIX’s rising TL has been a solid guide to lower stock prices.  This morning it is indicating another, more serious breakdown than the head fake we saw on Monday.Along with USDJPY’s “breakout” it has been enough for the algos to bid futures up to the top of their falling channel for the 10th time this month.

    There are two ways to look at this.  One is very bullish, while the other is quite bearish.  It’s decision time for stocks.

    continued for members(more…)

  • What If?

    You know the market is in trouble when USDJPY ramps in the hours before the open and futures tumble into the red anyways.If you’re wondering why the BoJ picked this particular moment for USDJPY to break out, look no further than the NKD.  After guiding NKD higher for over 10 years, it doesn’t seem likely they’ll just roll over at this point.This on the heels of a pretty wild ride, yesterday.  SPX spiked up to slightly above our upside target and then got whacked, plunging 103 points from its highs before bouncing into the close.

    In the process, SPX formed the right shoulder we were expecting — which opens the door to a much bigger drop than was originally the case.The algo backdrop is negative this morning, with VIX still above its key trend line and RB and CL dropping toward our next downside targets.  Stocks could be in for another rough day.  What if this is the day?

    continued for members(more…)

  • Charts I’m Watching: Oct 29, 2018

    SPX bounced right in between the two .786 retracements we had identified Friday – leaving it either on the road to recovery or in the midst of forming a right shoulder in a Head & Shoulder pattern.

    Again, we should keep an eye on VIX – which is threatening to break down after an extended rally.continued for members(more…)

  • What Are the FAANGs Trying to Tell Us?

    Futures have bounced 17 points off their lows, but are still indicating a 26-pt drop — giving up all of yesterday’s goal-seeking meltup and then some.

    SPX was desperate to retake its 2.24 extension at 2703.62…and it did.  Unfortunately, for those who weren’t watching VIX……it was a headfake.  The flimsy little TL off the recent highs proved to be plenty enough resistance for a reversal, and we should have no trouble exploring our downside targets today (as long as VIX remains above its purple TL.)As expected, RB has continued to sell off and CL continues to go sideways.  And, USDJPY gave up a half-hearted attempt to break out past another one of those flimsy TLs of resistance.Never say never, but these are not the characteristics of a market which is going to be rescued any time soon.

    Suddenly, our COMP forecast from Oct 10 isn’t looking so far-fetched.

     *  *  *

    Some of you might have seen this GOOGL chart yesterday.  It’s striking in a number of ways.Obviously, GOOGL has broken a very long trend line of support.It is also threatening to break down through the last horizontal support it has.  Recall that back on April 23, when all of the FAANGs were in danger of breaking down [see: Is the Market About to be de-FAANGed?], GOOGL came to the rescue.

    It spiked to within 6 1/2 points of our 1298 target [see: Alphabet’s Big Day]……which was enough to help the broader market (including the rest of the FAANGs), but then proceeded to tumble to every one of our downside targets in succession.  From Focus on the FAANGs in July:

    If [GOOGL] stumbles further here, it has decent support at the previous high and red channel bottom at 1178.16 around Aug 6 — 4.8% below current levels and 8.8% from its recent highs. If 1178 doesn’t hold, the next support is its SMA200 (currently 1093 but rising fast), followed by the white TL where it intersects with the .618 at 1103.99.

    Note that it closed at 1103 yesterday, but is positioned to drop back below it this morning.Facebook is another stock which has surprised with its compliance with our bearish outlook.  As we discussed in Focus on the FAANGs, it had plenty of downside if its H&S neckline didn’t hold. 

    The neckline held for another month, then didn’t.  The death crosses which had always served as reminders to increase the size of its buyback plan finally played out, and FB came within a point of our 144 target.

    A better target is 141.40, which would finally allow the backtest of the falling purple channel.  Note that had the backtest been allowed to occur in August as we originally anticipated, it would have reversed at 156 and FB wouldn’t be flirting with the support of the important white channel midline.

    We could walk through each of the FAANGs, but the story is pretty much the same with each.

    This time really is different.  Important support is either broken or in danger of being broken. The usual tricks aren’t being deployed.  And, investors are rightfully nervous.  Things are going to get worse before they get better.

    continued for members…
    (more…)

  • Coincidences and Consequences

    It’s interesting how Khashoggi’s murder top-ticked oil and gas prices…

    …and, so soon after Trump’s latest demand that OPEC lower oil prices.

    I’m certainly not insinuating that Trump had anything to do with Khashoggi’s murder.

    But, OPEC ignored Trump’s Sep 20 demand.  Two weeks later, oil prices had spiked 10% higher.  Since Oct 3, the day of the murder, WTI has fallen 14.5% and RBOB has fallen 16.7%.

    As Churchill famously said, “never let a good crisis go to waste.”

     *  *  *

    Sometimes it’s quite difficult to anticipate a major market move.  You’ve got hundreds of companies, all with their own earnings, outlooks, and market-moving headlines.  Then, there’s the economic news of the day, both domestic and foreign.  And, of course, there are geopolitical developments such as who’s dismembering or cozying up to whom?

    And, sometimes it’s not so difficult at all. It can be as simple as the VIX chart we’ve discussed all week.  From Time to Panic on Tuesday:

    Note that VIX need only break the purple TL [for SPX to bounce.] If VIX doesn’t break down, this should be the end of the line for this bounce.

    It didn’t bounce.  SPX plunged.  Next?

    Or it can be slightly more complex, but still fairly straightforward — such as is the case with oil and gas.

    As we all know, central bank support (low interest rates, among other accommodations) has been critical to stock prices since 2009.  Low interest rates, of course, rely on low inflation.  And, low inflation relies to a great extent on low oil and gas prices (more accurately, low MoM and YoY increases in those prices.

    From last April in Oil & Gas, Inflation and Interest Rates: A Delicate Balance or Goal Seeking?

    The complicating factor, of course, is that oil and gas prices took over the job of stimulating algos (chief among the 90% of all trading activity which is conducted by machines) to drive stocks higher.

    Most recently, oil, gas and SPX all bottomed on Feb 11, 2016 and oil and gas prices played an integral role in stimulating the subsequent rally.  The most important nudge was in December 2017, when oil and gas prices broke out of an already rising channel.

    To chartists, and to algos, this is a very bullish maneuver.  It also has the effect of driving inflation and interest rates higher. CPI rose from 2.11% in December 2017 to 2.95 in July 2018.  The 10Y rose from 2.31% in December to 3.24% just a few weeks ago.

    The Fed told us they were okay with this, that they were going to let the economy and inflation “run hot.”  I was among the many doubters, citing the damage that higher rates would inflict on our already alarming budget deficit, but darned if they didn’t do it anyway. I suppose that, at the end of the day, a temporary increase in the rate at which the debt and interest expense are expanding was less important than having a higher perch from which to crash rates during the next GFC.

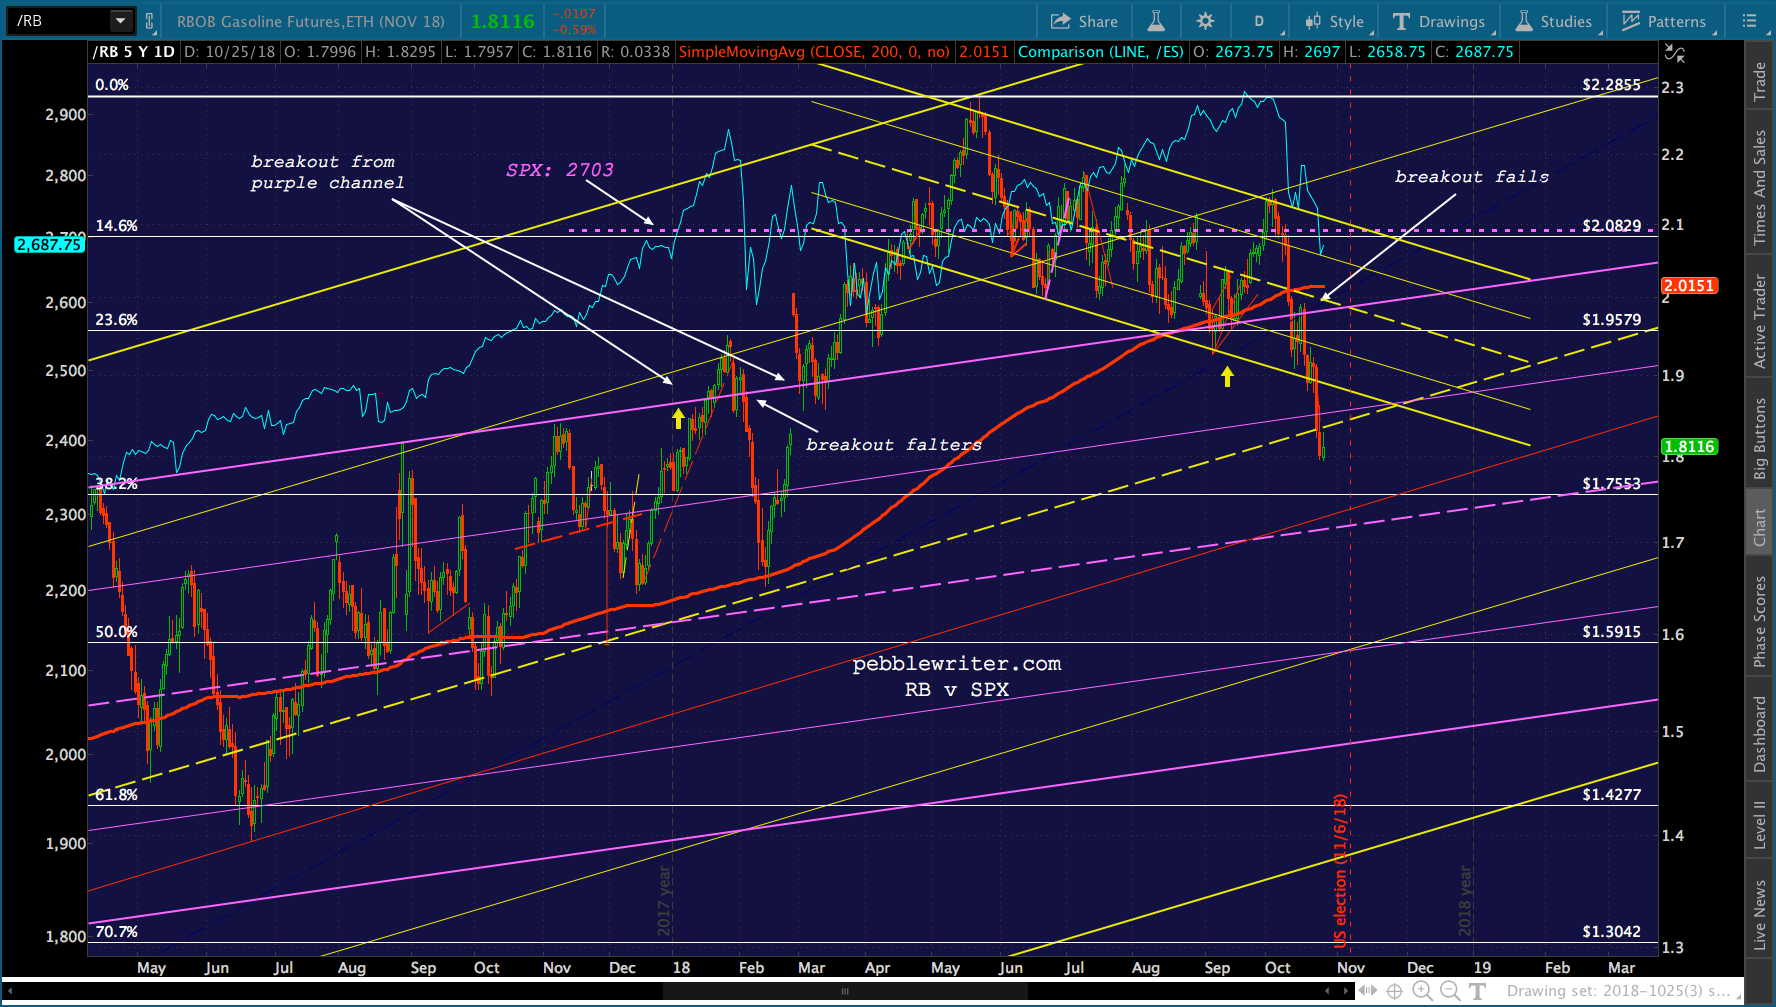
    Stocks ignored the implications for a while, happy to play follow the leader with oil and gas prices.  The day that RBOB popped out of the rising purple channel was the day that SPX popped above its 2.24 Fibonacci extension at 2703 – a level which might otherwise have provided serious overhead resistance.  It can be seen as the horizontal, purple trend line on the chart below. In early February, though, RBOB’s breakout faltered.  No surprise, but SPX followed along, suffering its biggest and sharpest decline in years.  Like magic, RB quickly popped back above the purple channel top – rescuing SPX and helping it back above 2703.

    Note that SPX went on to new all-time highs in September, only after RB backtested the purple channel and bounced higher.

    And this lovely little correction we’re enjoying?  SPX topped the day that RB failed to break out of the falling yellow channel (also the day of Khashoggi’s murder.)  SPX fell through its 200-day moving average on the day that RB plunged back below the purple channel top.  And, SPX plunged below 2703 on the day that RB fell out of the falling yellow channel.

    With the elections less than two weeks away, I’m not expecting a sharp rebound in oil and gas prices any time soon.  So, the algos will have to rely on other tools — such as VIX, which has now shed 12.5% since tagged our 26 target yesterday.

    So far, VIX’s decline has produced a pretty nifty bounce.  Is it enough to offset weakness in oil and gas and a hawkish Fed which has been browbeaten by a “low-interest rate president?

    continued for members... (more…)

  • Warning: Interesting Days Ahead!

    It was a nice short and bounce — 288 points (+9.8%) in three weeks — but it leaves us in that familiar and not so comfortable place of wondering whether there might be more.

    While there are plenty of hints, the answer today should come from VIX — which will either bounce or break down below the purple trend line. Since I didn’t win the Mega Millions jackpot, I’ll have to contemplate whether RB and CL, which both tagged our next downside targets yesterday, have more in store.

    Both have broken down below multi-year trend lines and will clearly play a role in October inflation data and, thus, what to expect from the embattled Fed.

    This is about to get really interesting.

    continued for members(more…)

  • Time to Panic?

    I read another one of those tweets the other day stating that no one knows where the market is going.

    Fundamentals haven’t been a great guide lately.  So, it doesn’t bother me in the least when investing “experts” admit they don’t know where the market’s going.  Those guys, many of whom are clients, keep me in business.  But, it greatly annoys me when they insist that it can’t be known.

    Technical analysis and chart patterns have been on fire for the past 9 months.  Today, they are sending a clear message.

    Is it time to panic? In a word, no.  Not yet, at least.  S&P futures, USDJPY, CL and RB are all at or near the targets we set for them 3-4 weeks ago.  Let’s compare current charts with those from VIX Takes the Plunge on Oct 3:

    USDJPY…

    CL…

    RB…

    …ZN from Analog Details on Feb 7…

    …and, SPX from back on Sep 27, in FOMC: Two out of Three Ain’t Bad:

    Pebblereaders know that 2703 was chosen because it represented a pretty significant drop that would backtest a critical Fib that SPX has been dancing around for 9 months — the 2.24 Extension of the drop from 1576 in 2007 to 666 in 2009 — and, allow USDJPY, CL and RB to get where they needed to go.  They also know that a drop through 2703 (or 2688) would be an important warning of bigger drops to come.

    On Oct 9 [see: Investing for Dummies] I put out such a warning that was supposed to be clear enough for anyone to read — even investing experts.  I understand that not everybody would sell out in order to avoid a 6% (so far) drop.  But, even buy and hold types could benefit from a little hedging.  If nothing else, they could have locked in the 7.3% YTD gain.

    Let’s take an example of Dow components which is freaking people out this morning: 3M. MMM is currently off about 15% from its recent highs……but has solid Fib and channel support at 185 and intraday at 177ish.If it drops through 177, then there might be reason to panic.  But, for now, it is merely solidifying and protecting its gains by backtesting a former line of resistance.

    Other major Dow components are at similarly important support.  So, when we examine whether it’s time to panic yet, it’s important to note that this support — whether for SPX, CL, RB, USDJPY, MMM, etc — is vitally important.  If it breaks down, by all means panic.

    Now, on to today’s forecast.

    continued for members(more…)

  • The Big Picture: Oct 22, 2018

    It’s that time again.  Rising volatility, inflation and interest rates have left investors nervous and markets unsettled.  We’ll take a look back at how stocks got here, and a look ahead at where they’re going.

    Following the GFC, central bankers used QE to provide liquidity and drive interest rates lower.  It was an effective tool, but expensive and somewhat clumsy.  And, no one seemed very sure about the eventual effects that a dramatic increase in money supply and debt would have on inflation.

    Rating agencies weren’t thrilled, and downgraded US debt in August 2011.  SPX broke down, closely following the same path it had followed in 2007-2008 – an analog I initially presented in May [see: Analogs.]

    SPX broke out of the analog with the help of the yen carry trade — limiting the correction to only 22% and reinforcing the placement of the rising purple channel below.

    The yen carry trade involves the depreciation of the yen relative to the US dollar, which equates to a rise in the USDJPY (the number of yen per US dollar.)

    USDJPY had dropped 49% since 1998. It was poised to drop much further in mid-2011 — a result of the flight to safety in the wake of the Fukushima disaster.  As stocks were sinking in 2011, however, the Bank of Japan greatly expanded its own QE program. This provided enormous liquidity to markets, depressed already low interest rates, and ushered in a dramatic decline in the value of the yen (increase in USDJPY.)

    When SPX reached 1823, the culmination of a Butterfly Pattern (a reversal pattern in Harmonics), USDJPY broke out of the falling channel it had been in since 1998 and spiked up over its important .618 Fib level at 120.11.

    This period, highlighted above as Rectangle 1, enabled SPX to overcome the resistance at 1823 and treat it, instead, as support.  In fact, SPX backtested 1823 a total of five times over the next two years — never managing to break out.

    The reason?  USDJPY had run out of upside.  An ever-depreciating yen is great for Japanese exporters.  Toyotas and Hondas are cheaper, for instance, to US buyers.  But, it presented problems to the rest of Japan’s economy, which — in the wake of Fukushima — had shut down its nuclear power plants and relied upon imported oil for nearly all of its energy needs.

    Because oil is priced in US dollars, the ongoing rally in oil prices hit the Japanese particularly hard.  Oil in yen had nearly tripled by Jun 2014.This increase in oil prices, due largely to depreciation in the yen, drove inflation from below 0% to an alarming 3.7%.  Needless to say, it was hard to justify 10-yr rates of only 1.2% with nearly 4% inflation.  Inflation had to come down…which meant oil needed to crash.The silver lining was that USDJPY was able to rise even further.  In fact, USDJPY broke out [Rectangle 1 above] on the exact same day that CL (crude light, or WTI futures) broke down.

    Once it became apparent that USDJPY had run out of upside, another tool was needed to keep stocks afloat.  As the inflation chart above illustrates, the drop in oil prices had been a little too effective. Japanese inflation had transitioned back to deflation. US inflation was also flirting with 0%.

    Not only that, but debt to oil and gas exploration and production companies had ballooned even as the underlying assets depreciated [BIS Report.]  Banks’ exposure to the industry was making headlines.  It was time for oil prices to recover.

    On Feb 11, 2016 — the same day that SPX tested 1823 for the fifth and final time — CL bottomed out.  It enabled us to call an end to the 2015-2016 correction [see: USDJPY Finally Relents] which had begun when SPX first tagged its 1.618 Fib level in May 2015 [see: The Last Big Butterfly.]

    But, SPX wasn’t out of the woods just yet.  Brexit and the 2016 US election were just around the corner.  Fortunately, the tools were pretty well understood by then.  Despite plunging initially, USDJPY made a stunning recovery both times.

    The danger was elevated at the time of the US election, however.  SPX had been trending lower in the days leading up the election, dropping back below important Fib support (formerly resistance) at 2138 and threatening to drop below its 200-day moving average.

    As it became increasingly apparent that Trump would prevail, futures started dropping.  At one point, ES had dropped as much as 4.5% from its high the previous day.

    It was then that a rather strange thing happened.  VIX, which is a measure of risk and volatility in the markets, began to drop. Since investors buy VIX in order to protect against drops in equity prices, this was utter nonsense.  It would be akin to calling your insurance agent to cancel your flood insurance as a hurricane is bearing down on your beachside bungalow.

    It had happened a few months before when the Brexit vote also sent futures tumbling. By the time the cash market opened the day after the election, stocks were in the green, closing back above 2138.

    At this point, it’s worth taking a look at VIX over the years.  The yellow channel in the chart above has played a key role over the years.  VIX tagged it once per year in 2014, 2015 and 2016.

    Such plunges (the yellow arrows) were a signal that fear was quite low.  In other words, the coast was clear.  It was safe to buy.  This, of course, was a contrarian signal.  Repeatedly, the tags had marked complacency and market tops.

    Everything changed after the US election.  Rather than occasionally tagging the yellow channel bottom, VIX was suddenly plunging to it or beneath it on a regular basis.  The rising yellow channel had yielded to a falling channel shown in white below.  During the course of 2017, VIX would drop below the channel bottom about 3/4 of the time — a stark change from the previous once-per-year track record.

    Combined with USDJPY spiking 18% over the next 30 days and CL spiking 80%, the regime change in VIX easily propelled SPX to the next important Fib level: 2703.  Since topping out in January, SPX has tested its 200 DMA 16 times (after zero tags since the election) and has reacted at or crossed the 2703 Fib 24 times.

    As in 2014, inflation is becoming an issue again.  This time, the push above 2% has ratcheted interest rates higher.  With the debt approaching $22 trillion and an annual deficit of about $1 trillion, higher interest rates are beginning to matter.

    The Fed, determined to have a higher starting point from which to lower rates the next time the market needs saving, is seemingly impervious to criticism regarding the repercussions.  And, why not?  The narrative that inflation is under control is dubious unless oil and gas break down. If, as we expect, WTI drops another $10-22  [see: Oil & Gas Come Through Again], inflation would be under control. But, stocks would get clobbered.  Think new 2018 lows.

    This is as good a place as any to insert a disclosure.  This article scratches the surface of the many, many factors driving stocks higher — and, occasionally lower.  For instance, earnings matter — even if they’re inflated by stock buybacks and other gimmicks.  Some of the market’s gains have been driven by positive economic developments.  And, the Fed is unlikely to abandon its (usually) unspoken mandate to prop up stocks.

    The problem, or at least one of the important ones, is that the market is now largely driven by machines.  JP Morgan estimates that only 10% of trading is regular stock picking by fundamental, discretionary carbon-based investors.

    This means that 90% of the trading is driven by algorithms, indexers, quasi-indexers, ETFs, HFTs and other passive and quantitative approaches.  The upshot is that once a factor such as rising USDJPY or falling VIX is established and taken as gospel by the machines, it becomes easier and easier for stocks to be influenced without regard to fundamentals.

    There is no time for real people to reflect on a news blurb and consider whether it’s bullish or bearish.  By the time you or I have finished reading an article’s headline, machines have already made a decision and are placing trades. This opens the door to massive mispricing and outright manipulation.

    What the Fed did, and I was part of that group, is we front-loaded a tremendous market rally starting in March 2009. It was the Fed…the European Central Bank, the Japanese Central Bank… all quantitative driven by central bank activity. That’s not the way markets should be working… they were juiced up by central banks, including the Federal Reserve… I think you have to acknowledge reality.

    Richard Fisher, former FOMC member

    This is not a condemnation of quantitative investing, which simply seeks to capitalize on observations.  But, it’s important food for thought for anyone who places much stock in the veracity of economic data — especially since it emanates from those with an agenda.

    Now, on to our forecast.

    continued for members(more…)

  • Happy Anniversary

    Futures are up about 5 points on this, the 31st anniversary of Black Monday.  Ahh…memories.

    Total losses since the recent Sep 21 highs hit 8% last week — about 5.8% from the simple sell signal we highlighted on Oct 9 [see: Investing for Dummies.]

    Then…

    …and, now.

    The bounce we saw on Oct 11 got ES back above its SMA200, but it remains to be seen whether it can hold.

    Keep an eye on Existing Home Sales, due out at 10am.  They’ve been on a steady decline since March.  And, rising interest rates are very unlikely to have helped in September.


    continued for members(more…)

  • Oil & Gas Come Through Again

    Oil and gas futures tagged our next downside targets this morning.  RBOB is now off 12.2% in the last two weeks.  CL is off 10.8%.  While baffling those who focus on fundamentals and various geopolitical risks, these price moves made perfect sense when viewed through our favored prism: “what do TPTB need them to do?”

    That equation, my friends, boils down to a few essential elements: inflation, stock market support, politics and chart patterns.  While oil gets all the attention, it’s really gasoline prices which do most of the economic fine tuning.

    From Oct 3 [see: VIX Takes the Plunge]:

    CL and RB…not only reached overhead resistance by our measure, but must deal with bearish API data, another round of Trump tweeting, and a large build in EIA inventory.  I think the time has finally come to revert to short, but with tight stops in case this is a head fake.

    This morning, RB is threatening to break below the trend line and channel lines that guided that forecast — which, of course, is all about politics.

    continued for members(more…)