

Futures have bounced 17 points off their lows, but are still indicating a 26-pt drop — giving up all of yesterday’s goal-seeking meltup and then some.
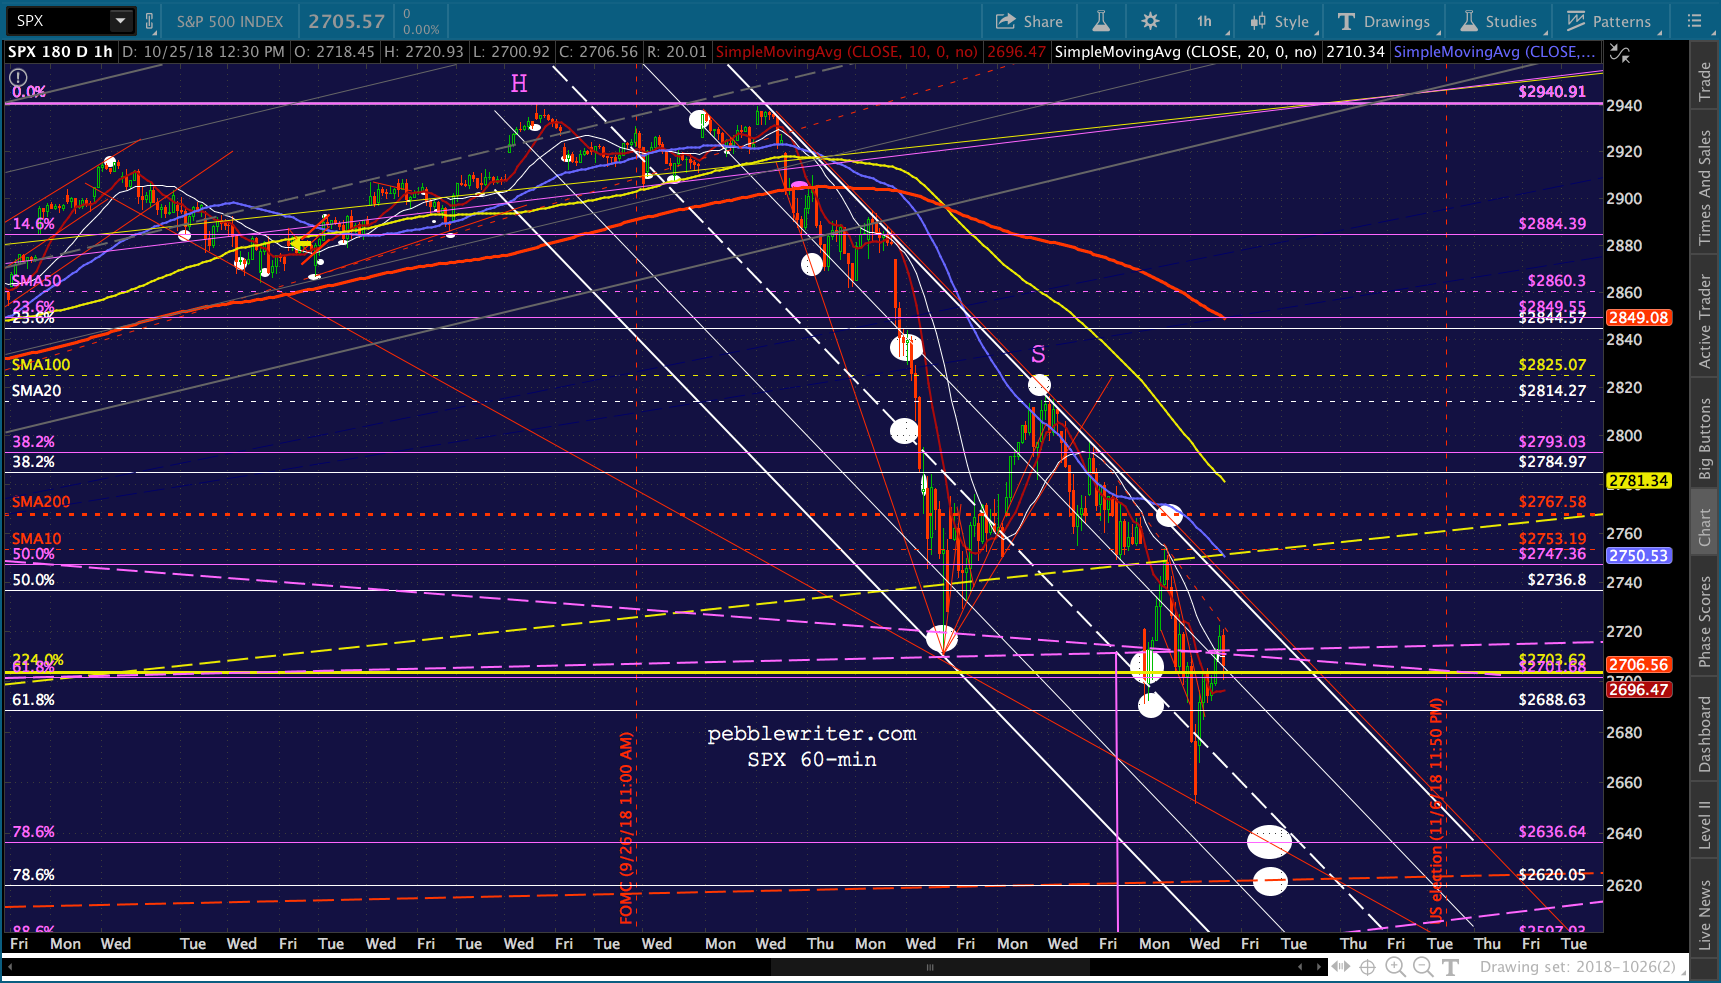
SPX was desperate to retake its 2.24 extension at 2703.62…and it did. Unfortunately, for those who weren’t watching VIX… …it was a headfake. The flimsy little TL off the recent highs proved to be plenty enough resistance for a reversal, and we should have no trouble exploring our downside targets today (as long as VIX remains above its purple TL.)
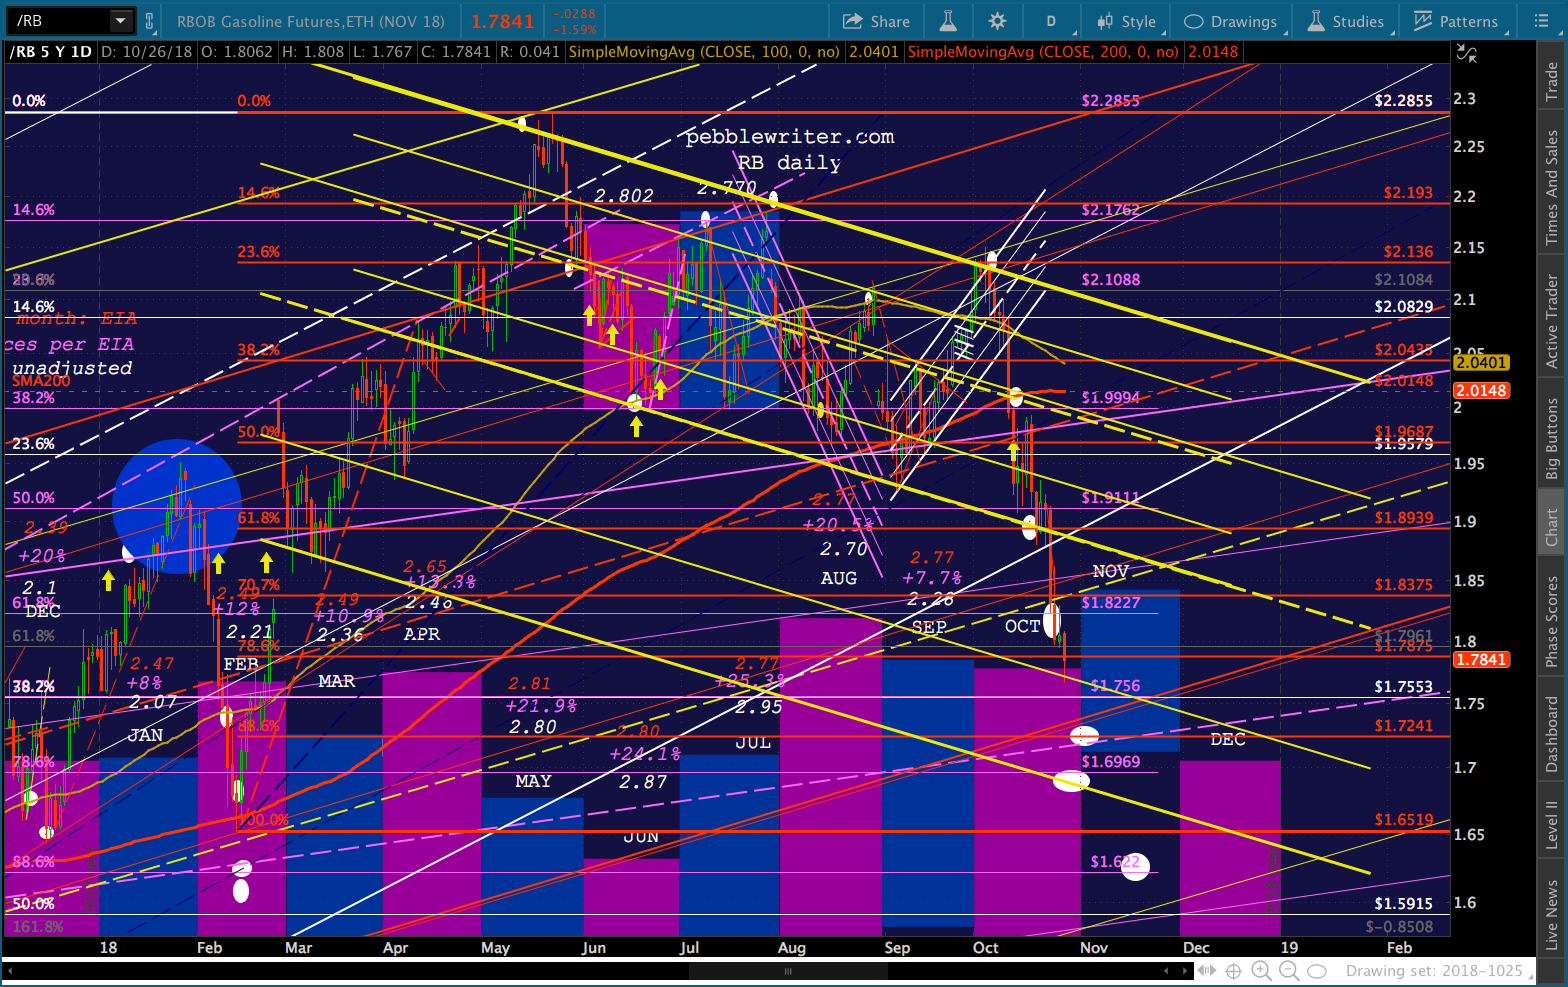
 As expected, RB has continued to sell off and CL continues to go sideways. And, USDJPY gave up a half-hearted attempt to break out past another one of those flimsy TLs of resistance.
 Never say never, but these are not the characteristics of a market which is going to be rescued any time soon.
Suddenly, our COMP forecast from Oct 10 isn’t looking so far-fetched.
* * *
Some of you might have seen this GOOGL chart yesterday. It’s striking in a number of ways. Obviously, GOOGL has broken a very long trend line of support.
 It is also threatening to break down through the last horizontal support it has. Recall that back on April 23, when all of the FAANGs were in danger of breaking down [see: Is the Market About to be de-FAANGed?], GOOGL came to the rescue.
It spiked to within 6 1/2 points of our 1298 target [see: Alphabet’s Big Day]… …which was enough to help the broader market (including the rest of the FAANGs), but then proceeded to tumble to every one of our downside targets in succession. From Focus on the FAANGs in July:
If [GOOGL] stumbles further here, it has decent support at the previous high and red channel bottom at 1178.16 around Aug 6 — 4.8% below current levels and 8.8% from its recent highs. If 1178 doesn’t hold, the next support is its SMA200 (currently 1093 but rising fast), followed by the white TL where it intersects with the .618 at 1103.99.
Note that it closed at 1103 yesterday, but is positioned to drop back below it this morning. Facebook is another stock which has surprised with its compliance with our bearish outlook. As we discussed in Focus on the FAANGs, it had plenty of downside if its H&S neckline didn’t hold.
The neckline held for another month, then didn’t. The death crosses which had always served as reminders to increase the size of its buyback plan finally played out, and FB came within a point of our 144 target.
A better target is 141.40, which would finally allow the backtest of the falling purple channel. Note that had the backtest been allowed to occur in August as we originally anticipated, it would have reversed at 156 and FB wouldn’t be flirting with the support of the important white channel midline.
 We could walk through each of the FAANGs, but the story is pretty much the same with each.
This time really is different. Important support is either broken or in danger of being broken. The usual tricks aren’t being deployed. And, investors are rightfully nervous. Things are going to get worse before they get better.
continued for members…
The SPX picture: I see the either the purple or white .786 being tested and potentially providing a bounce.
 But, a significant enough bounce could set up another H&S pattern to much lower (the current purple H&S targets 2479.24 – the site of pretty much nothing.) And, a failure to bounce would indicate a drop through to the white .886 at 2579.
 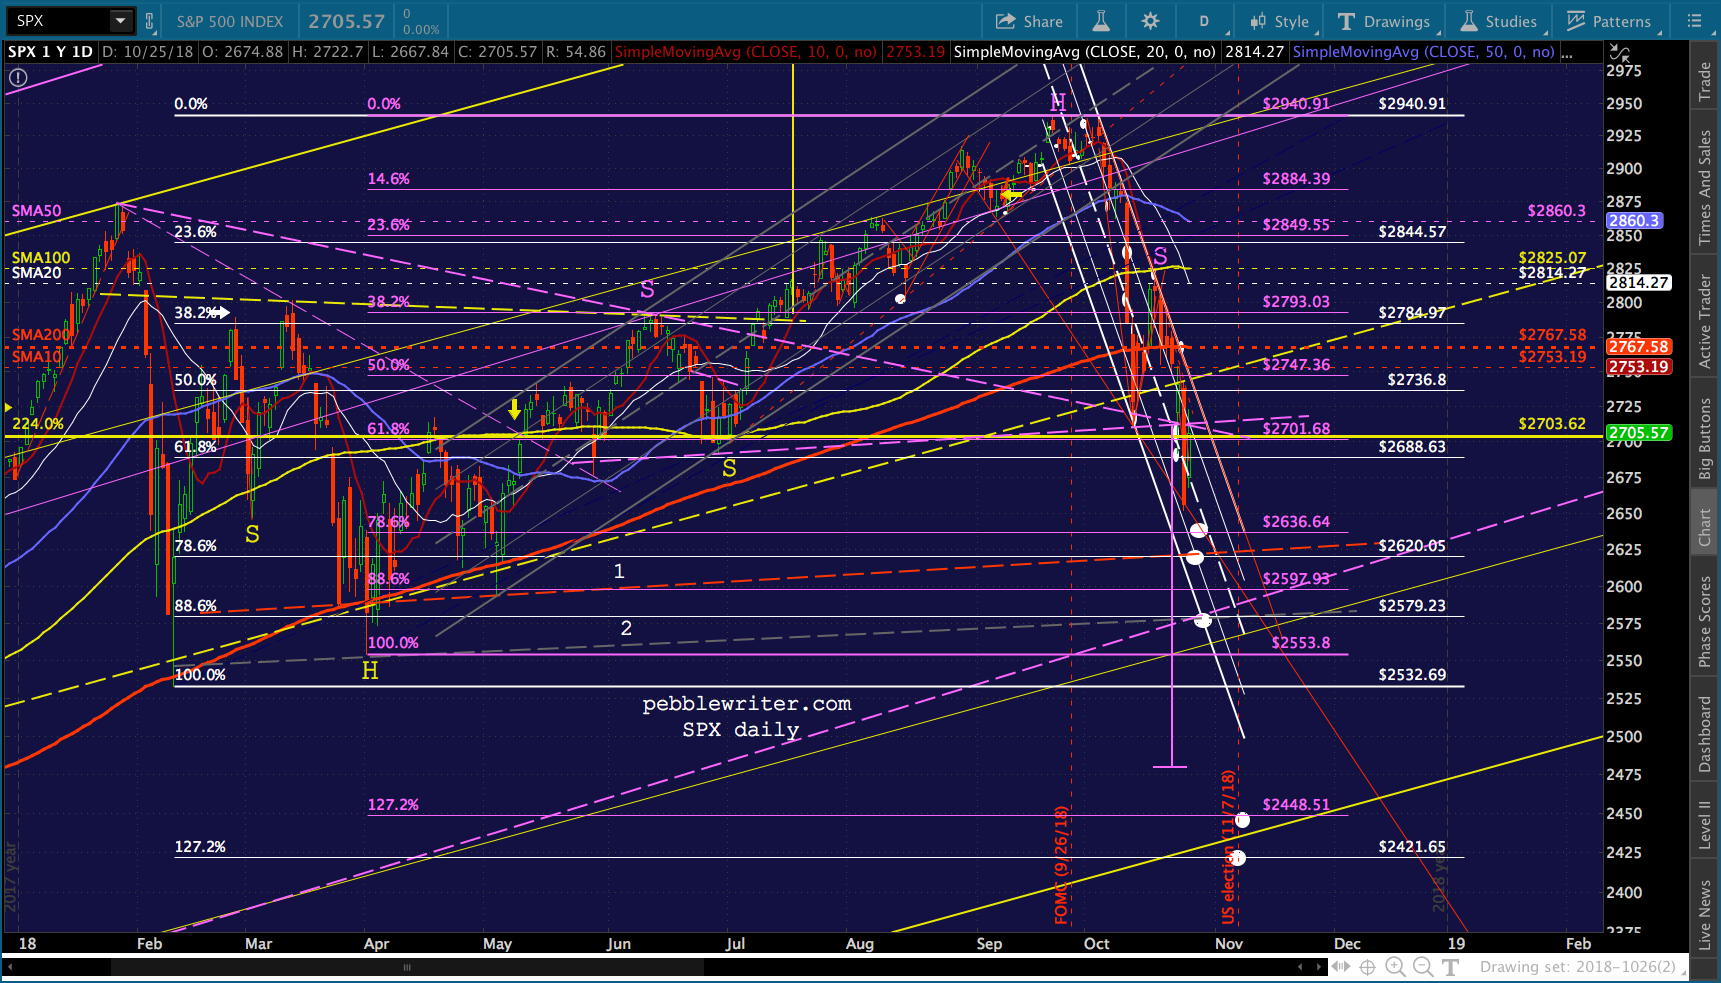 It’s interesting to me that the 2532 low is almost exactly halfway from the 2940 top to 2138. This leaves open the possibility of a bounce at the .886 that sets up a H&S pattern (see the gray and red necklines drawn in above) targeting 2138. It’s still a hell of a long ways down and would require a catalyst.
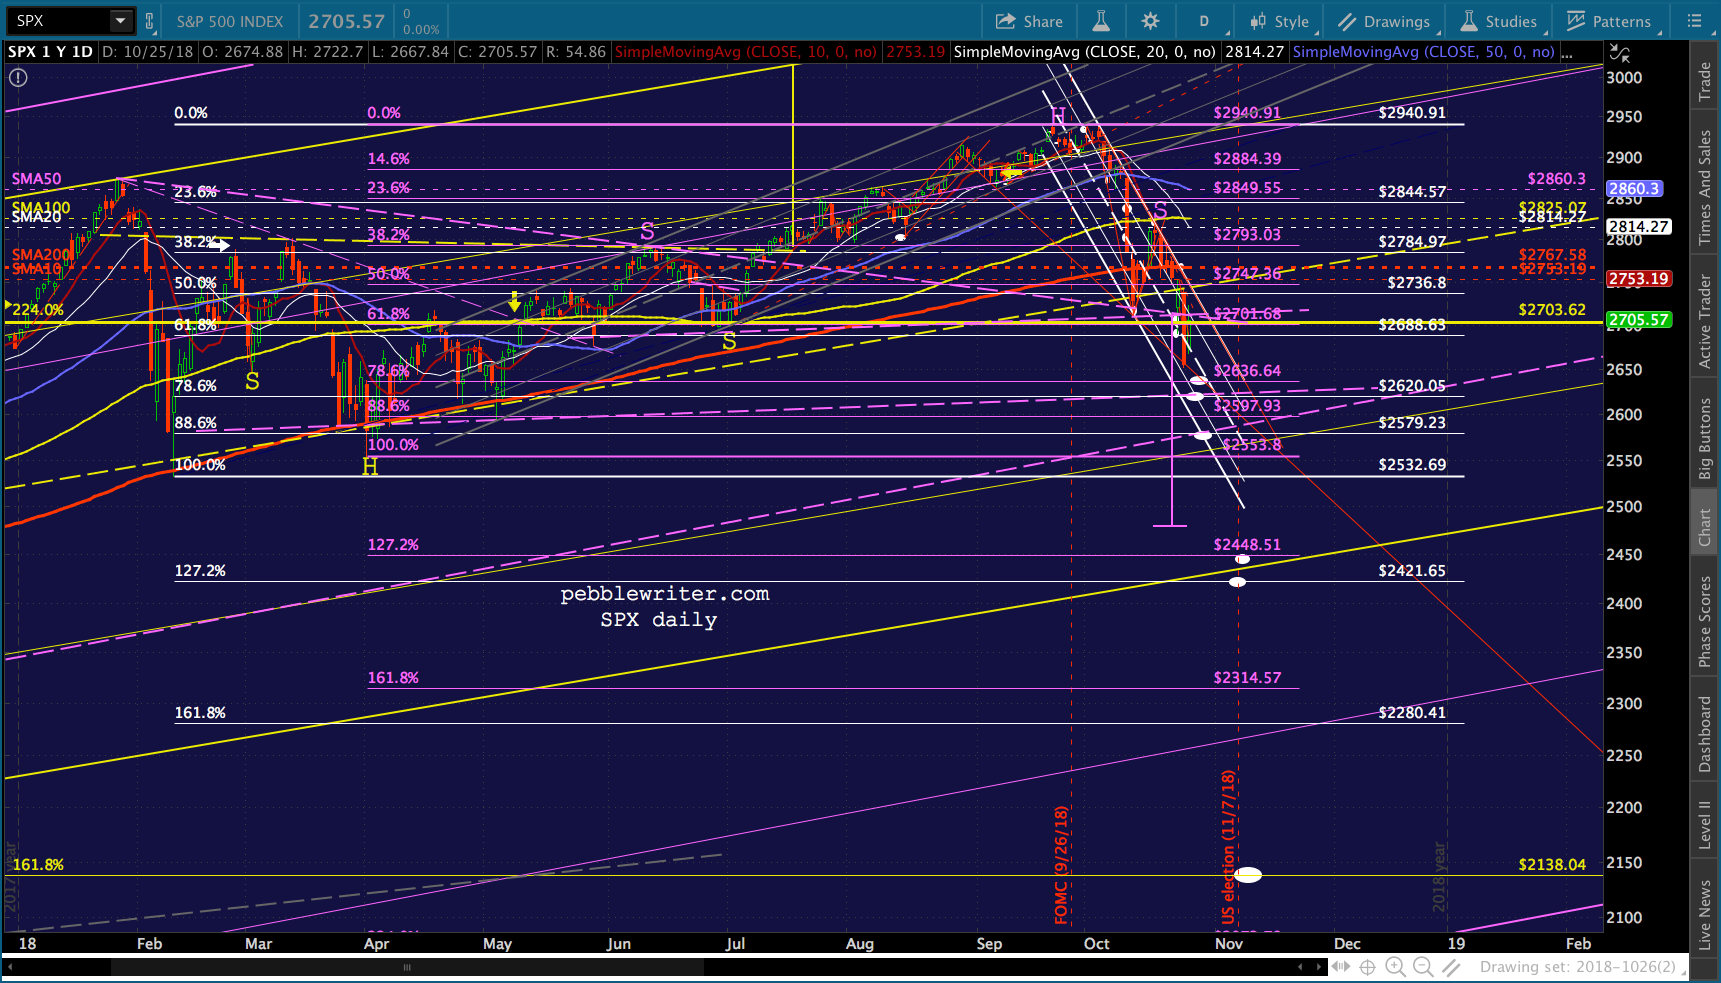 My favorites remain a breakdown of USDJPY…
 …a breakdown in VIX (which is already underway)…
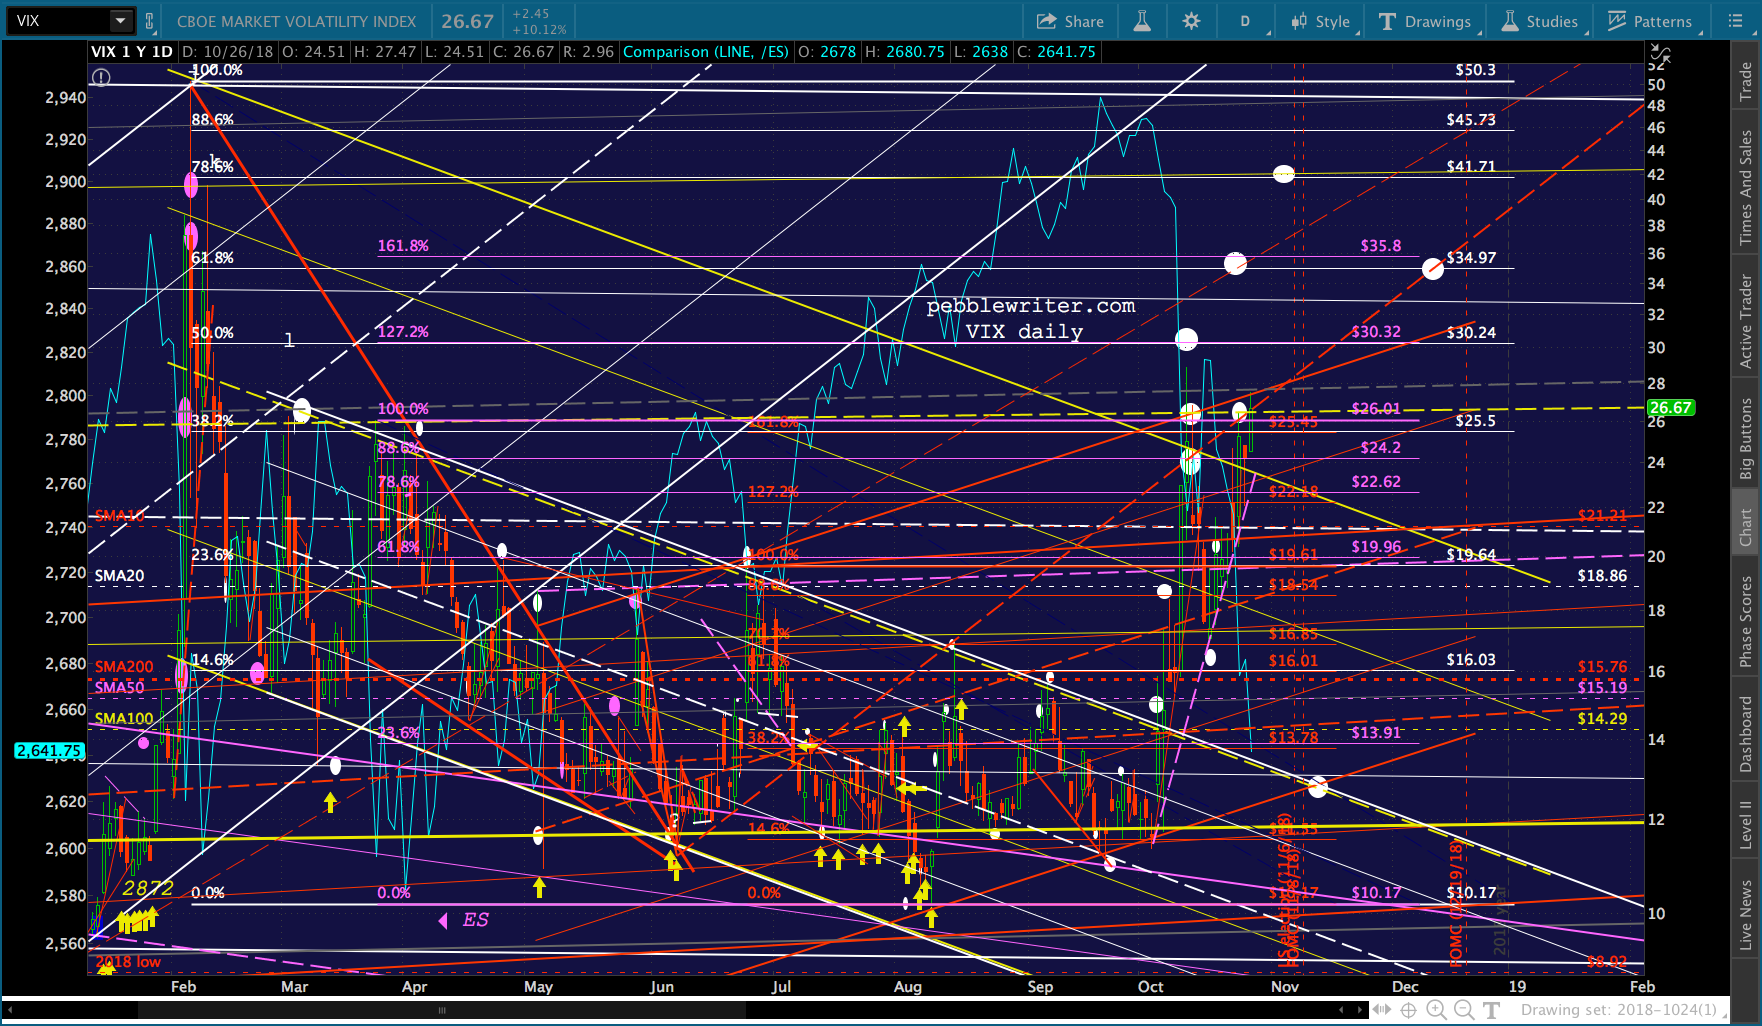 …and/or a breakdown in RB/CL.
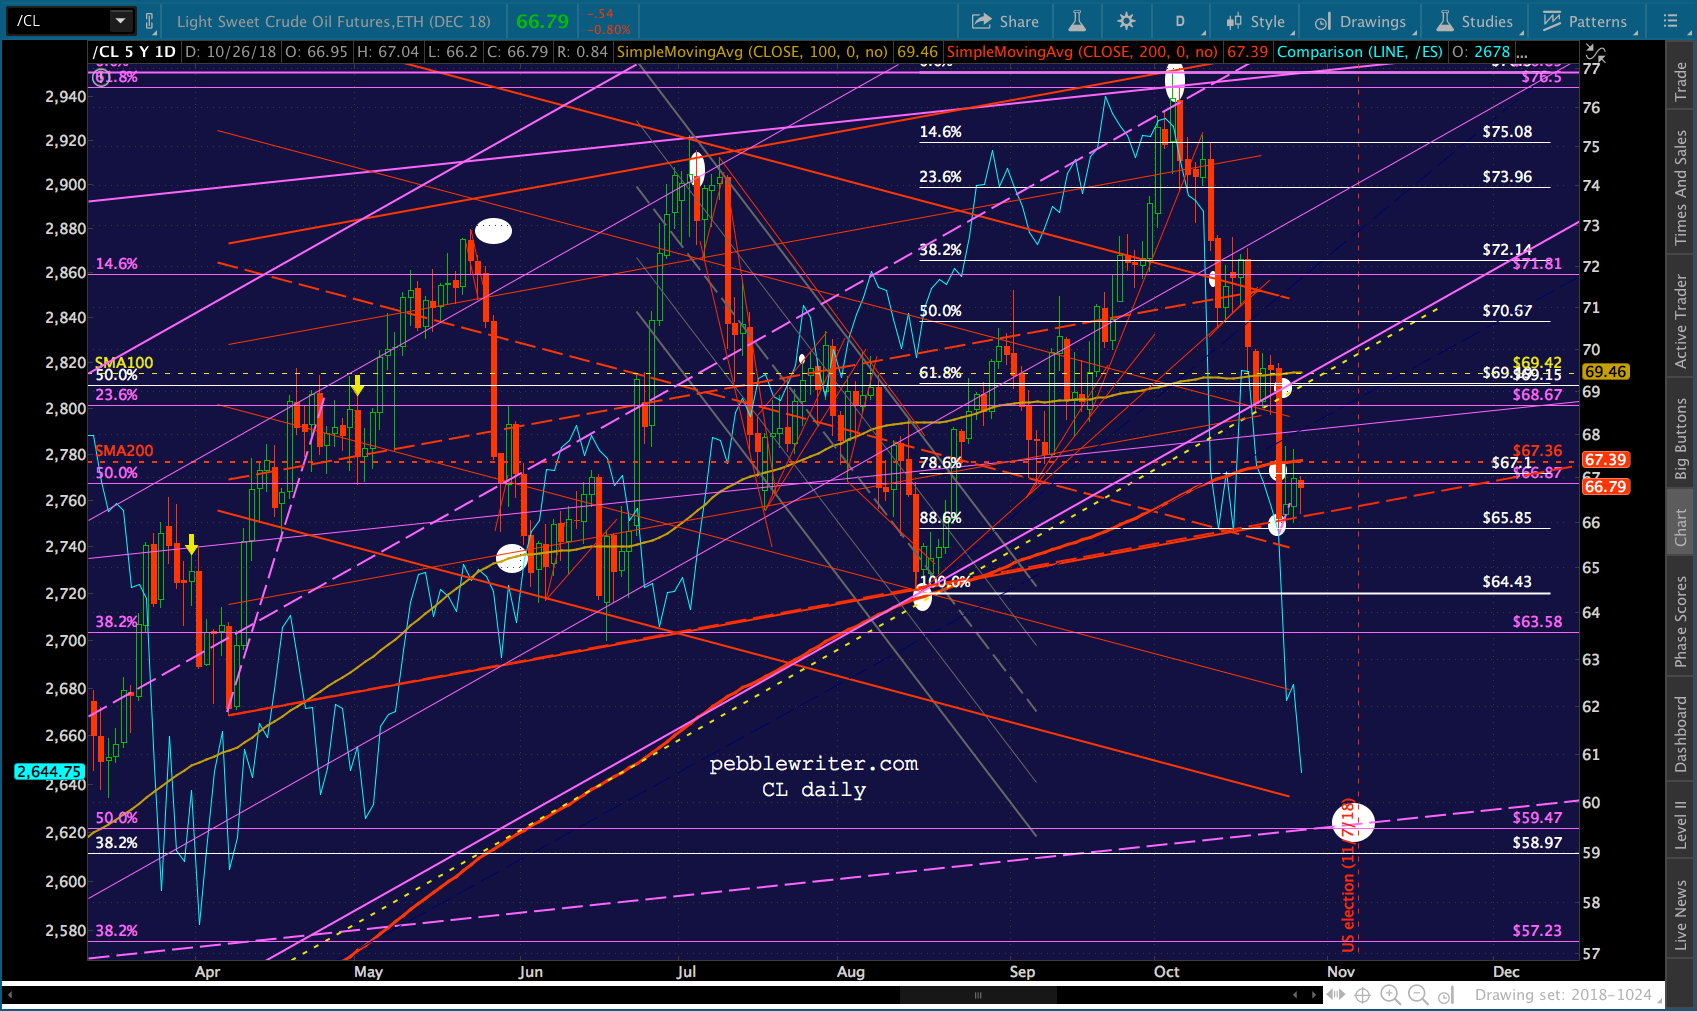
 It could be any or all of the above, in whatever combination ends up working.
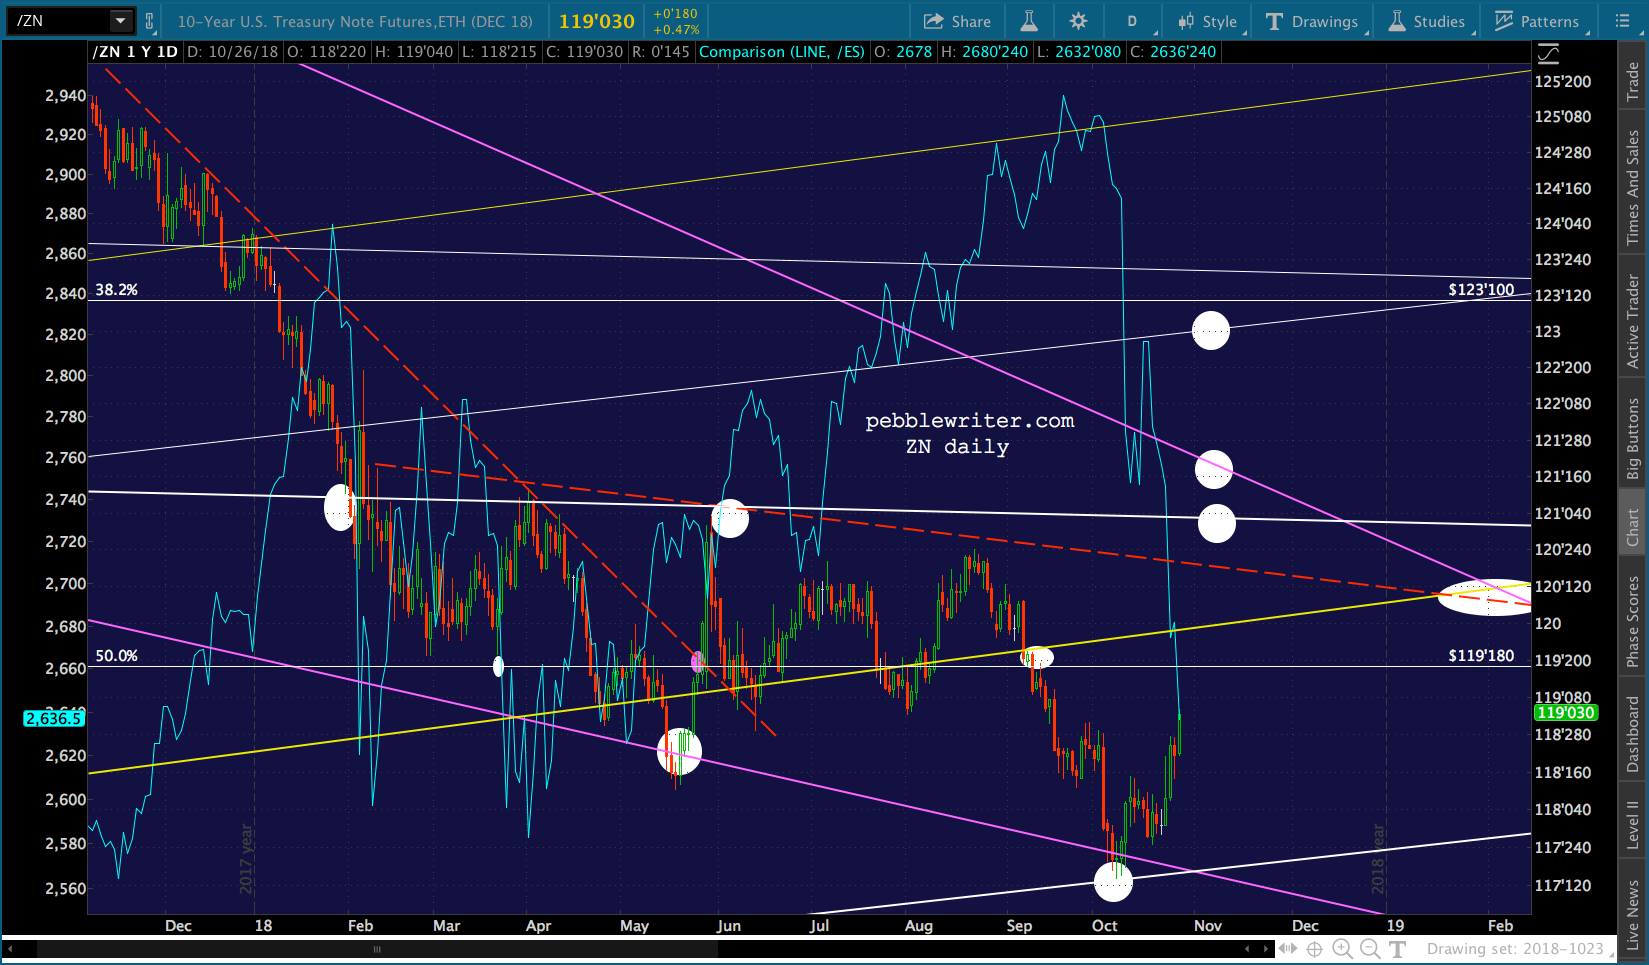
Note that TNX is making its way toward our 28.56 target and ZN is picking up steam.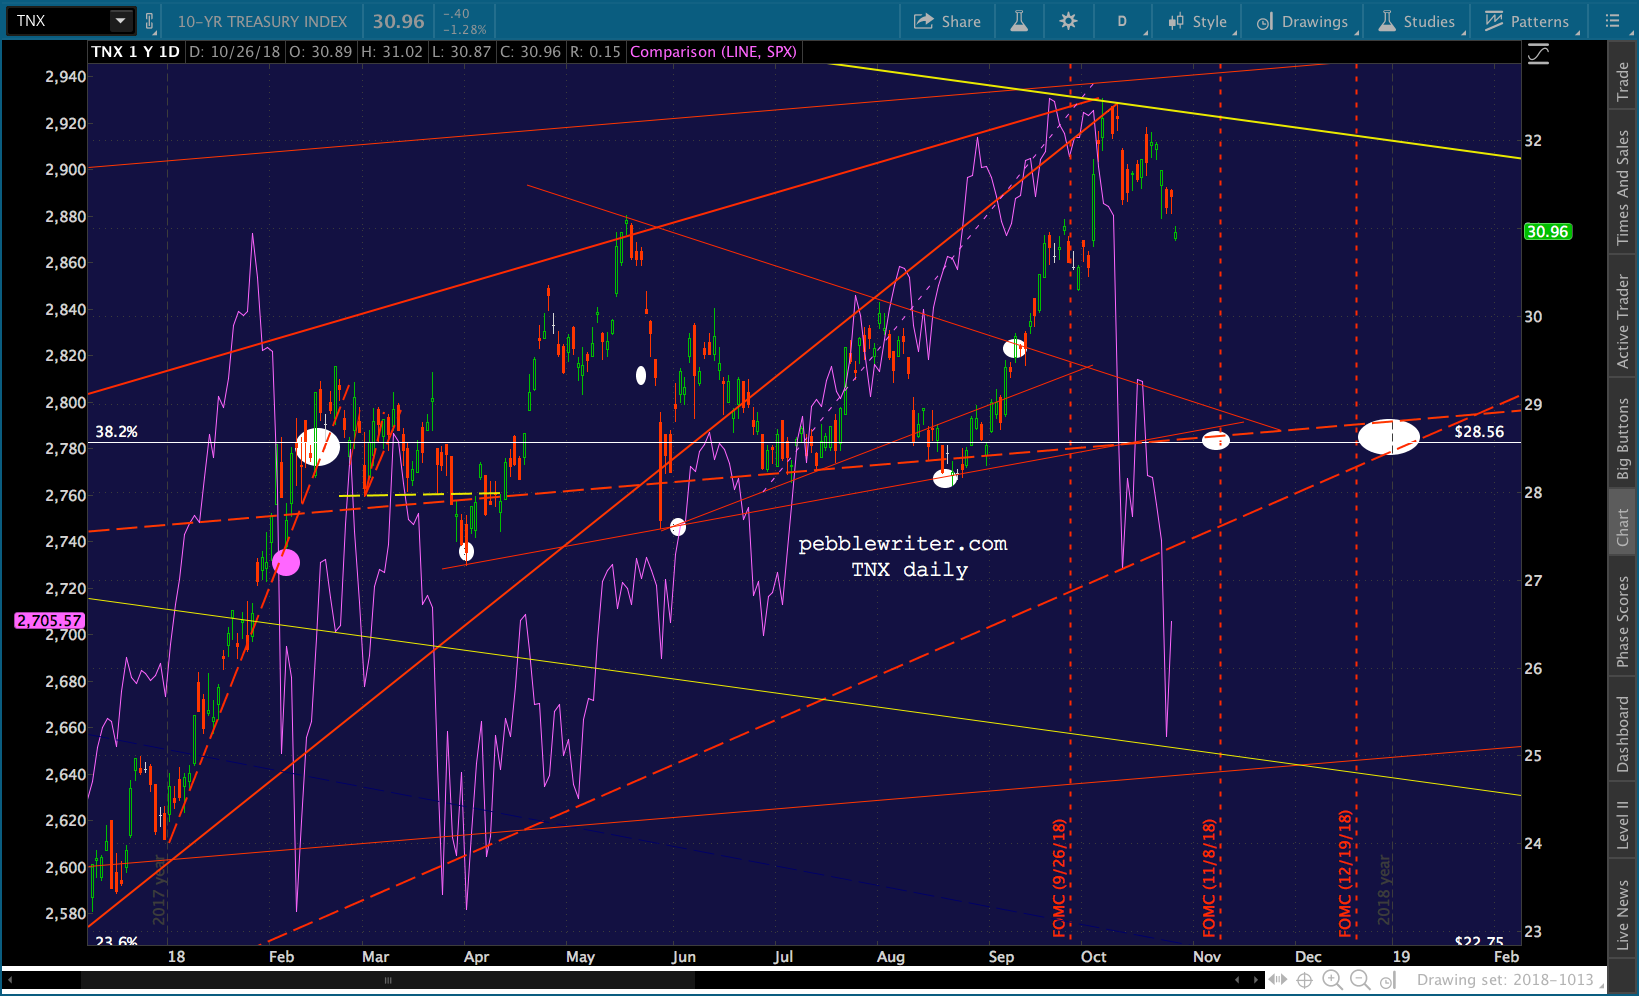
 EURUSD and DXY continue on track.
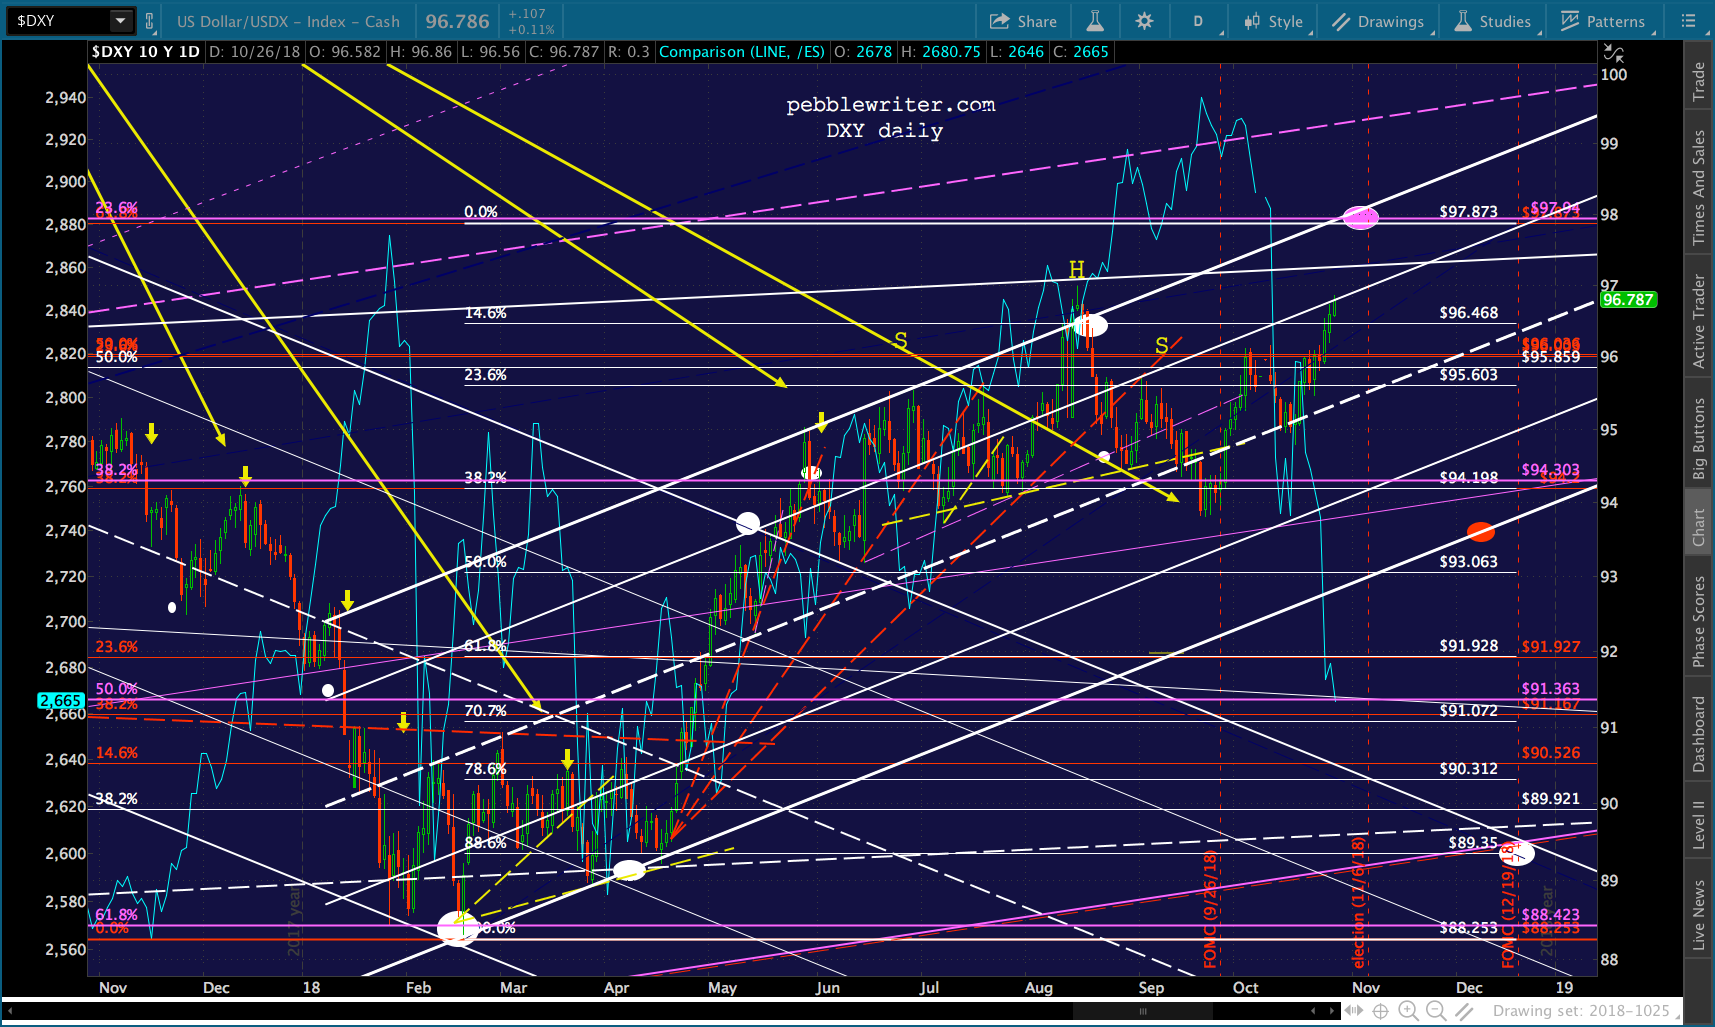
 And, COMP is on its way.
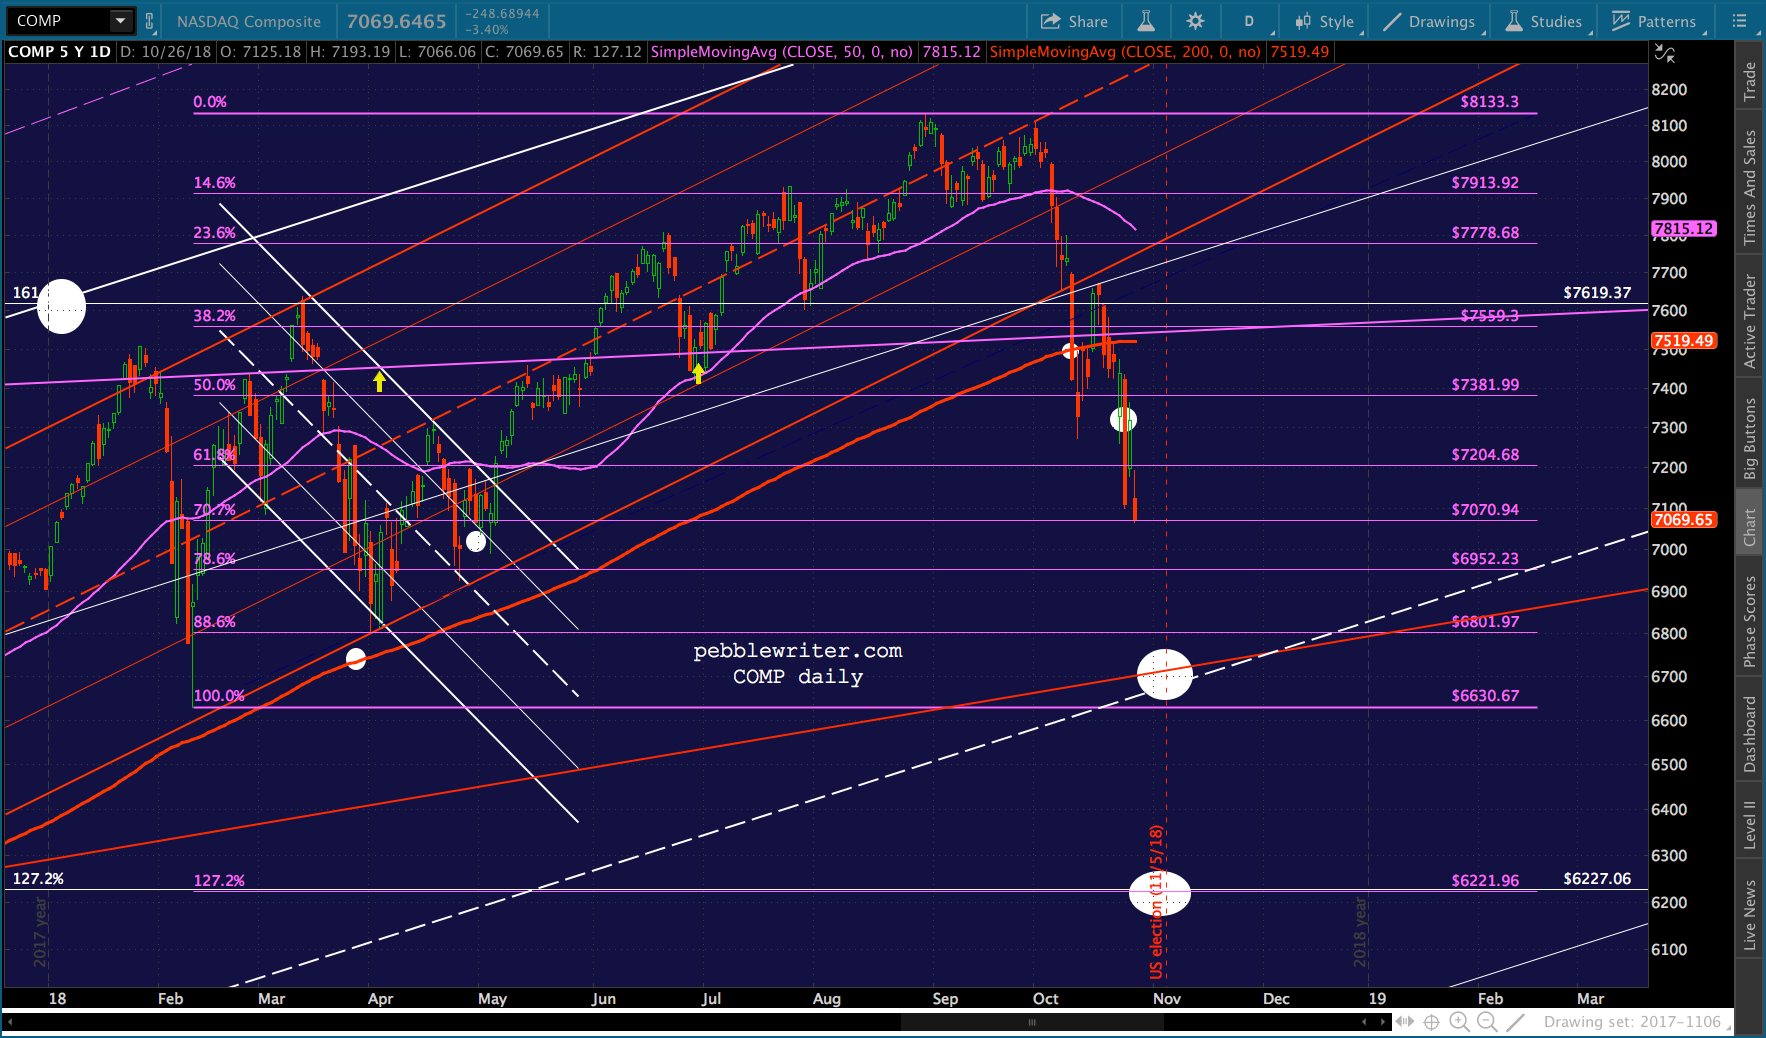
I wouldn’t get too focused on a new H&S pattern. It would take a pretty sizeable bounce to get a right shoulder together — and, I don’t think TPTB would want to deal with 2703 yet again unless they’re ready to keep SPX above it.
Keep an eye on the FAANGS, COMP, USDJPY and VIX. They’ve done an excellent job of showing us the way so far.
I have a boatload of administrative stuff to get done today and am trying to get on the road early this afternoon, so will leave it here for the day.
For those who are interested or have friends/associates who might be, I am currently running a promotion on memberships: half-off for the first month of a auto-renew monthly subscription and only $800(over half-off) for an annual subscription.
GLTA.
Comments
3 responses to “What Are the FAANGs Trying to Tell Us?”
Thanks!
You’d think we are getting close to massive margin calls very soon? What is the support below 2138?
I’m not sure what the tipping point is, Tim. But, I would think we’re already past it. As far as support below 2138…it gets really sketchy. Besides the important 1.618, it’s horizontal support from 2015 and depending on when it might be reached, channel bottom support and the .382 retrace of 666 to 2940. Below that, I suppose we’d have to consider 1823 and, a more interesting prospect, 1576 — the 2007 top and pretty close to the .618 retrace of 666 to 2940 (1535.) I can’t imagine TPTB allowing anything lower than 2138. It would probably mean they’d totally lost control.