

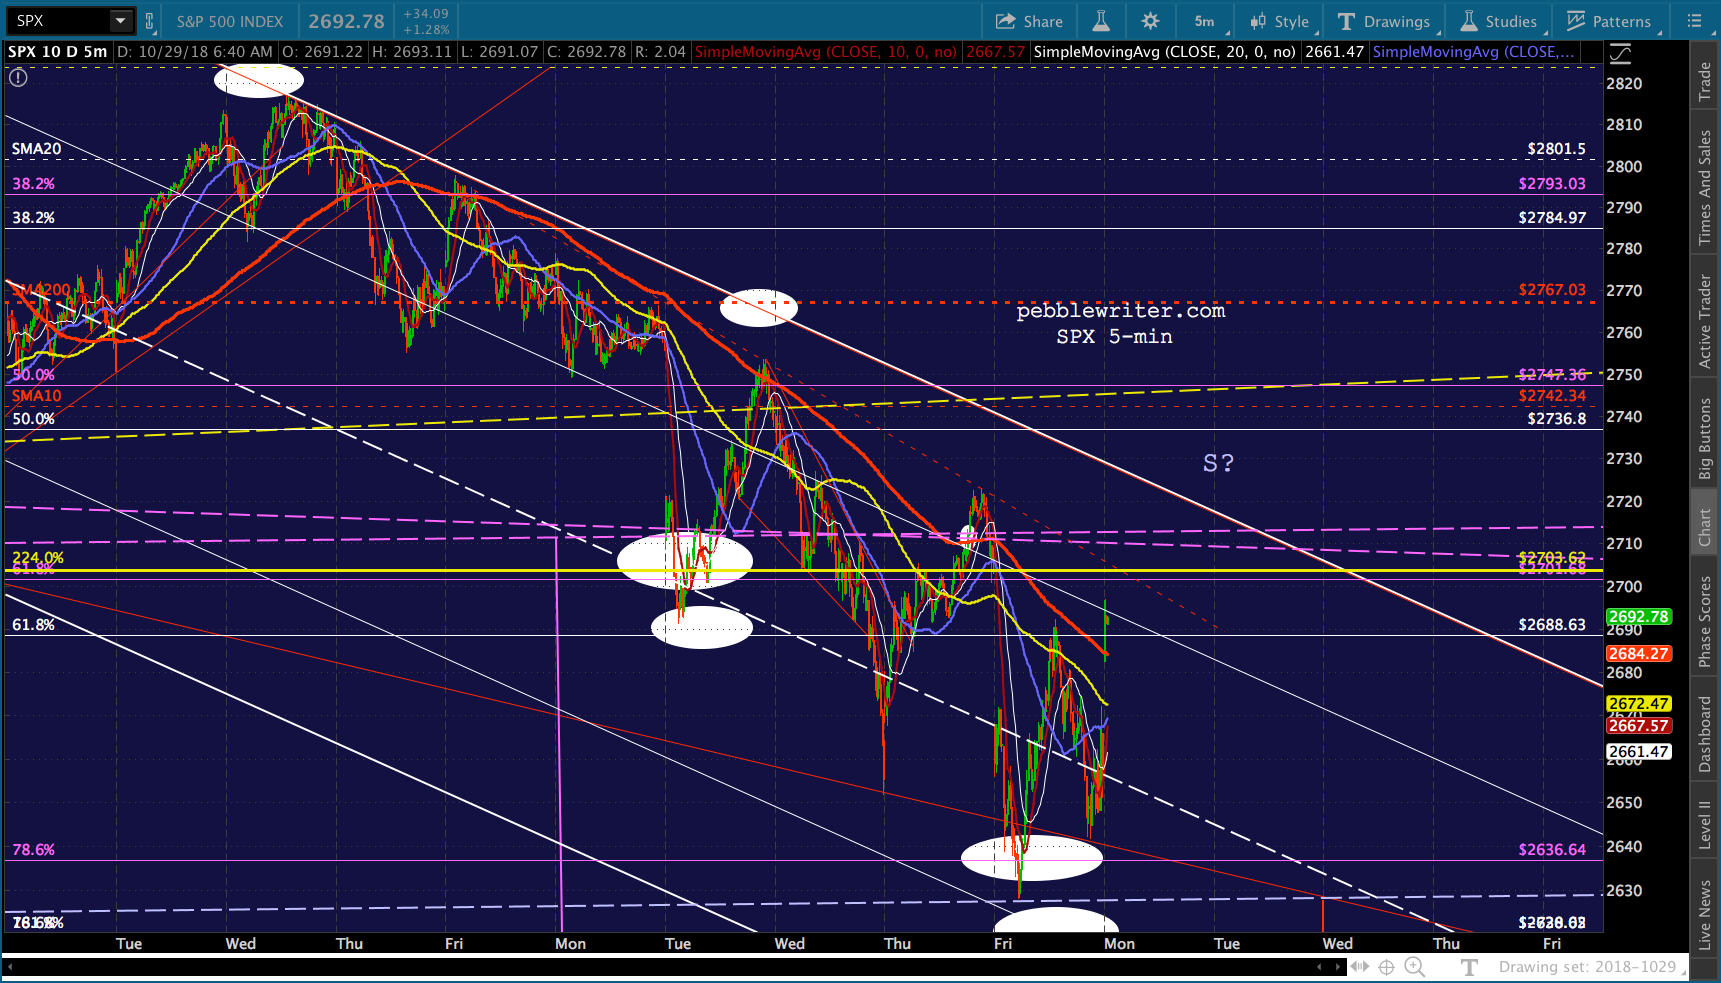
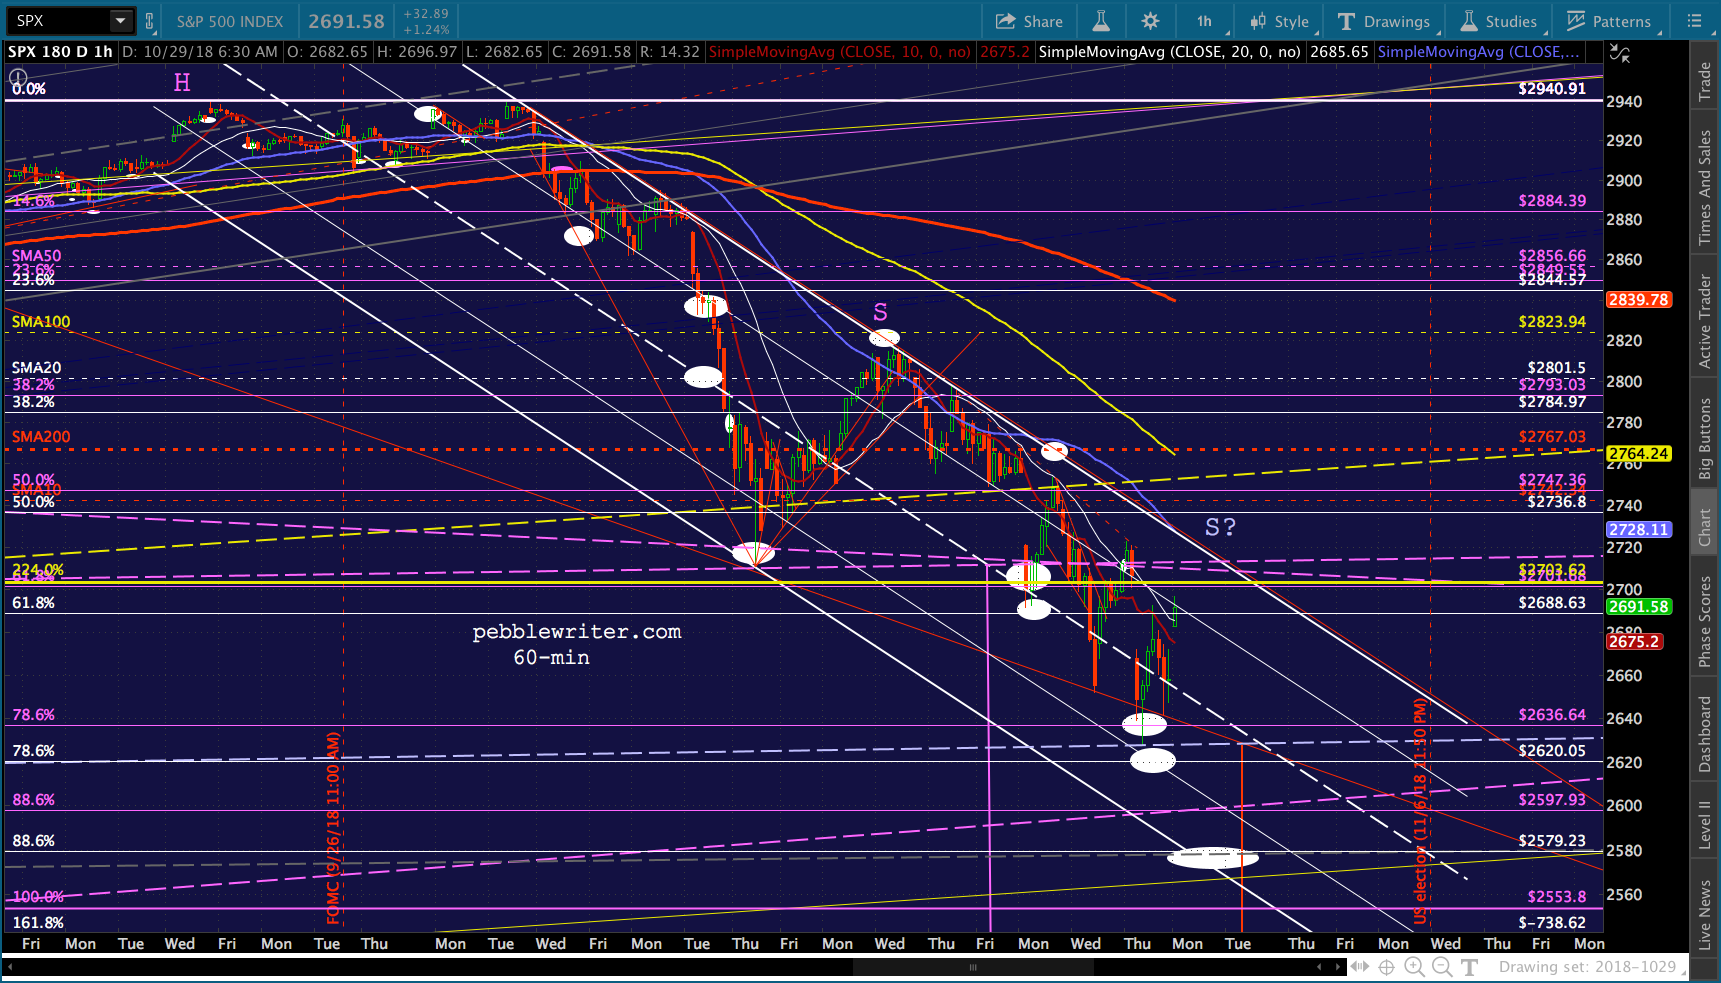
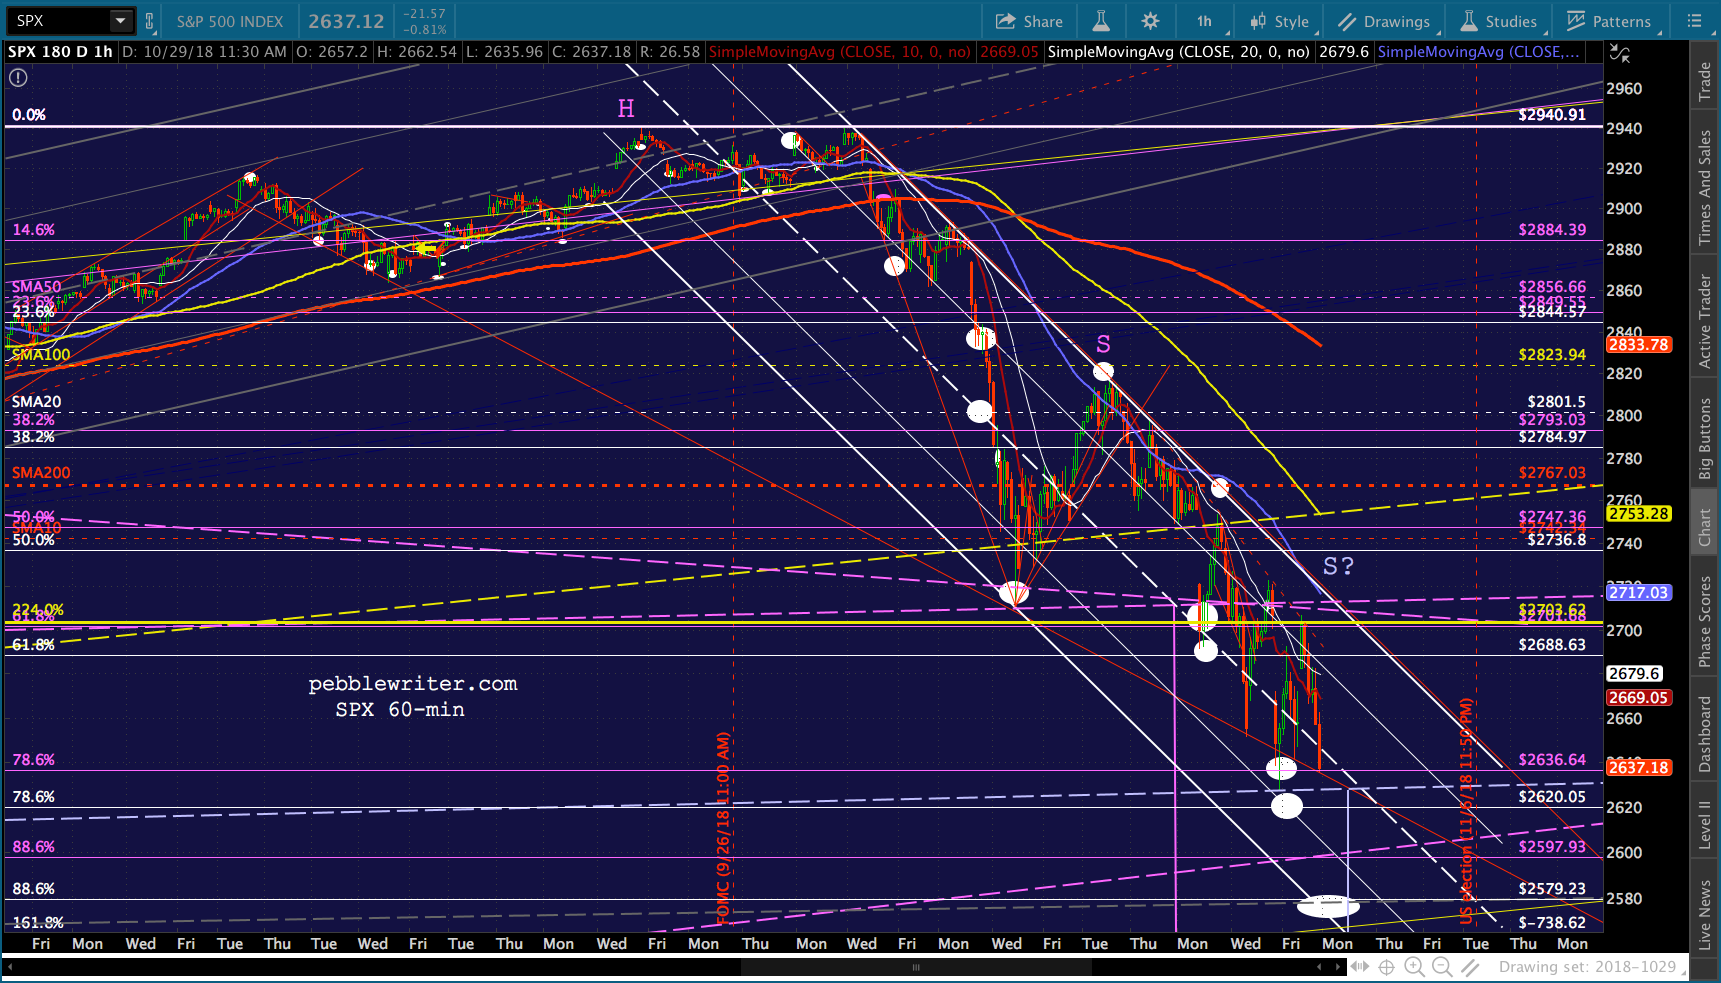
SPX bounced right in between the two .786 retracements we had identified Friday – leaving it either on the road to recovery or in the midst of forming a right shoulder in a Head & Shoulder pattern.
Again, we should keep an eye on VIX – which is threatening to break down after an extended rally. continued for members…
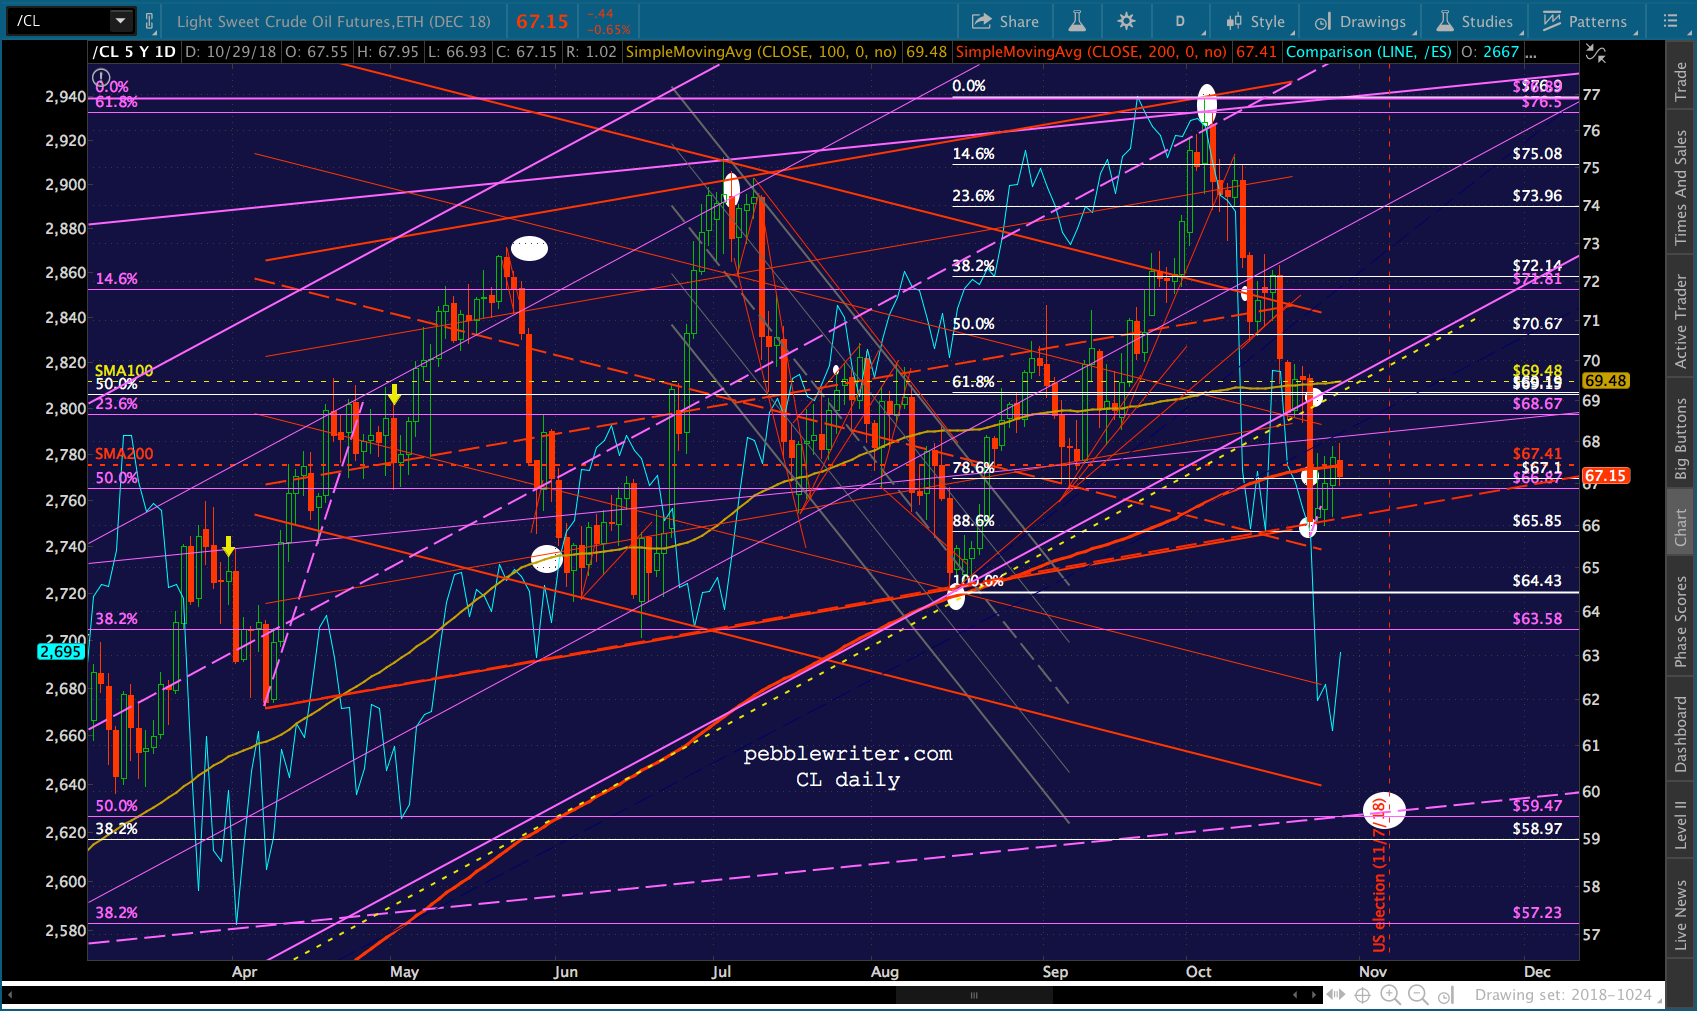
CL and RB are also making noises about a recovery — with CL again threatening to push above its SMA200.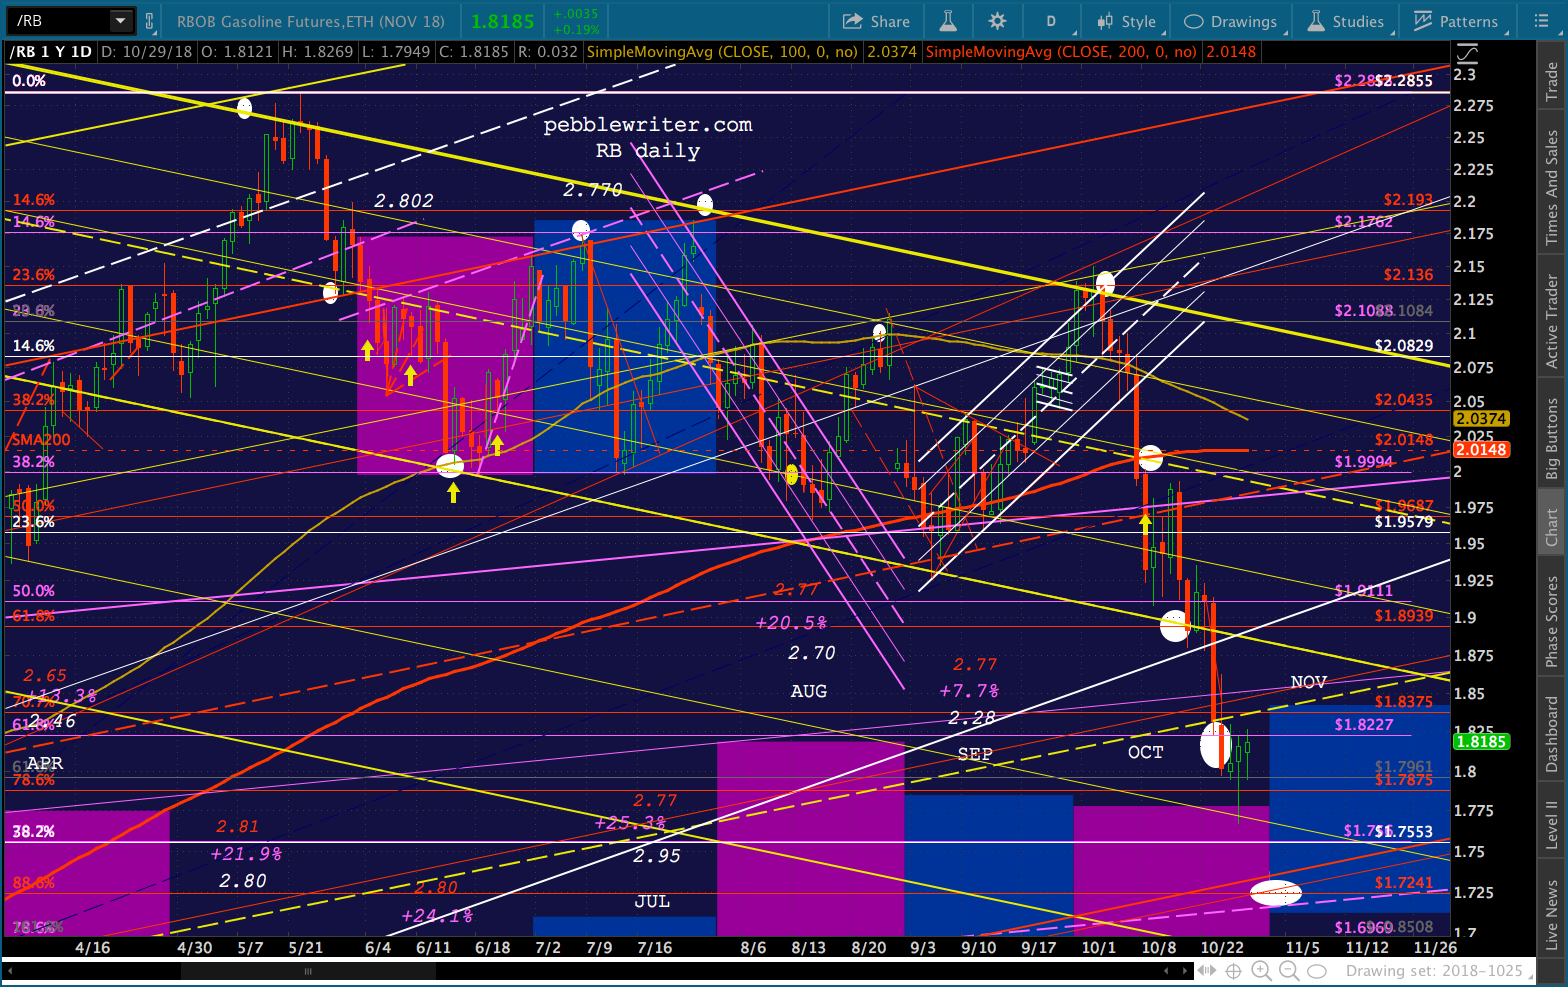
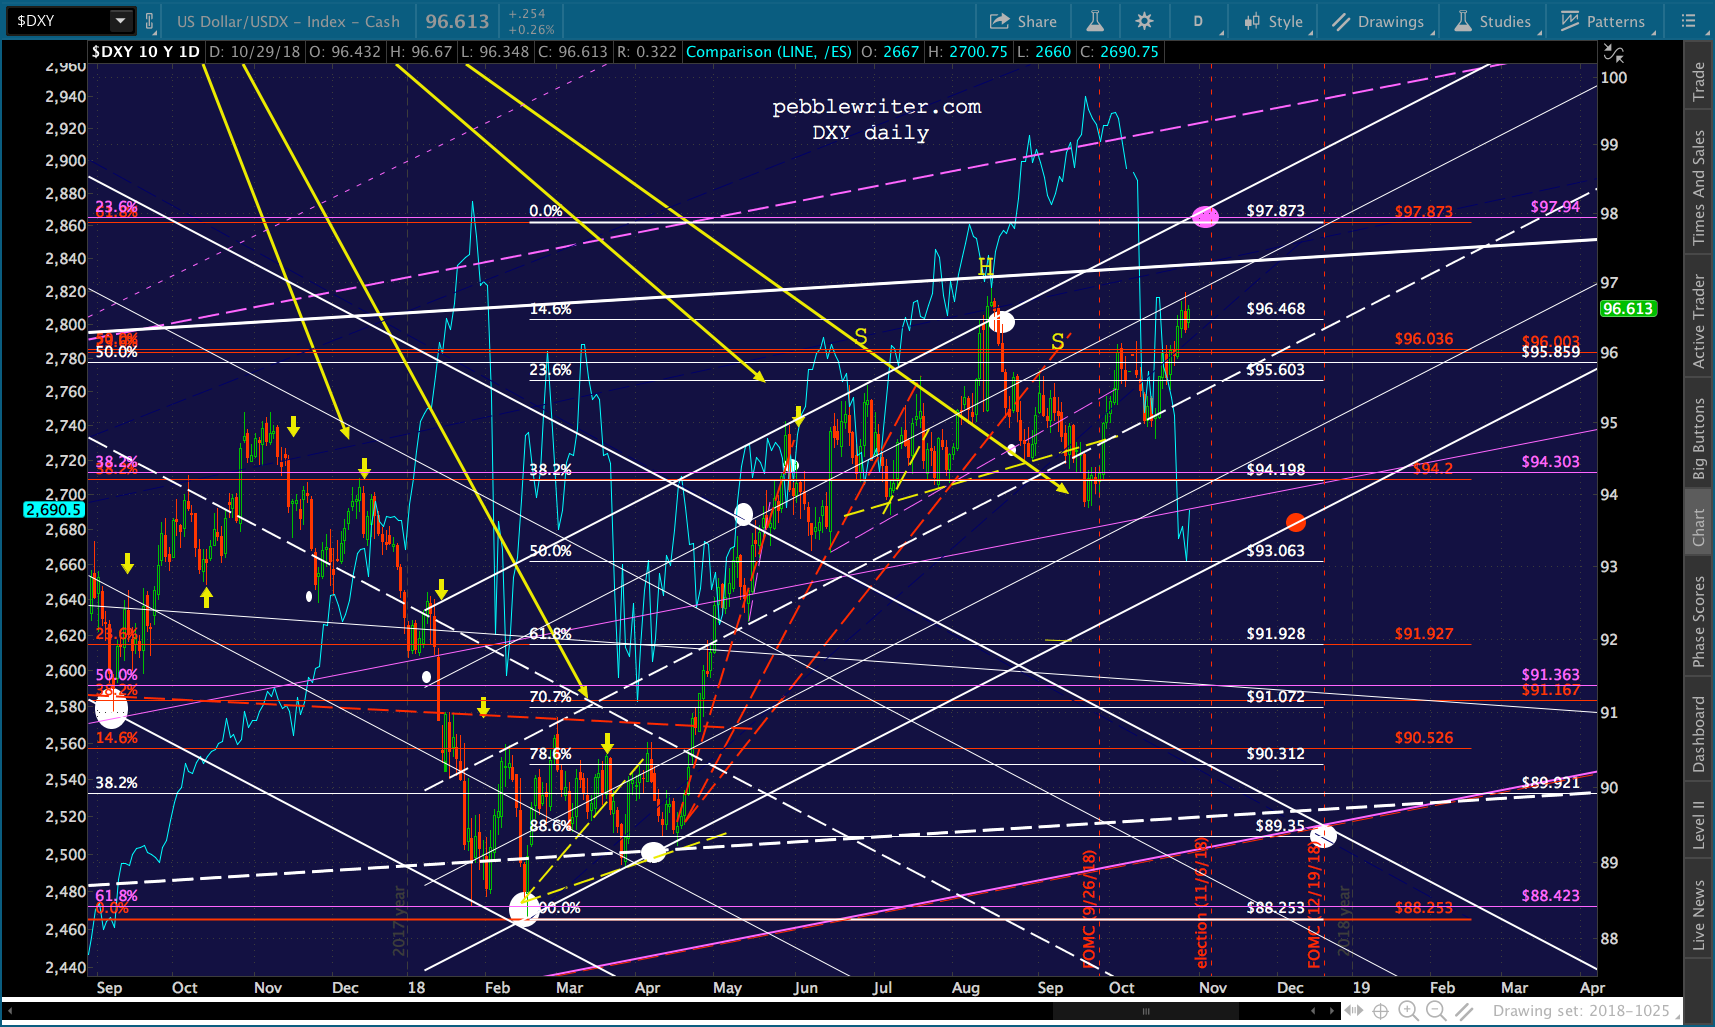
 Futures are also getting some help from USDJPY, which backtested its SMA100 again but still looks susceptible to me.

 SPX and ES have already completed one H&S Pattern targeting 2479. This is potentially the right shoulder of a second, larger one targeting 2310.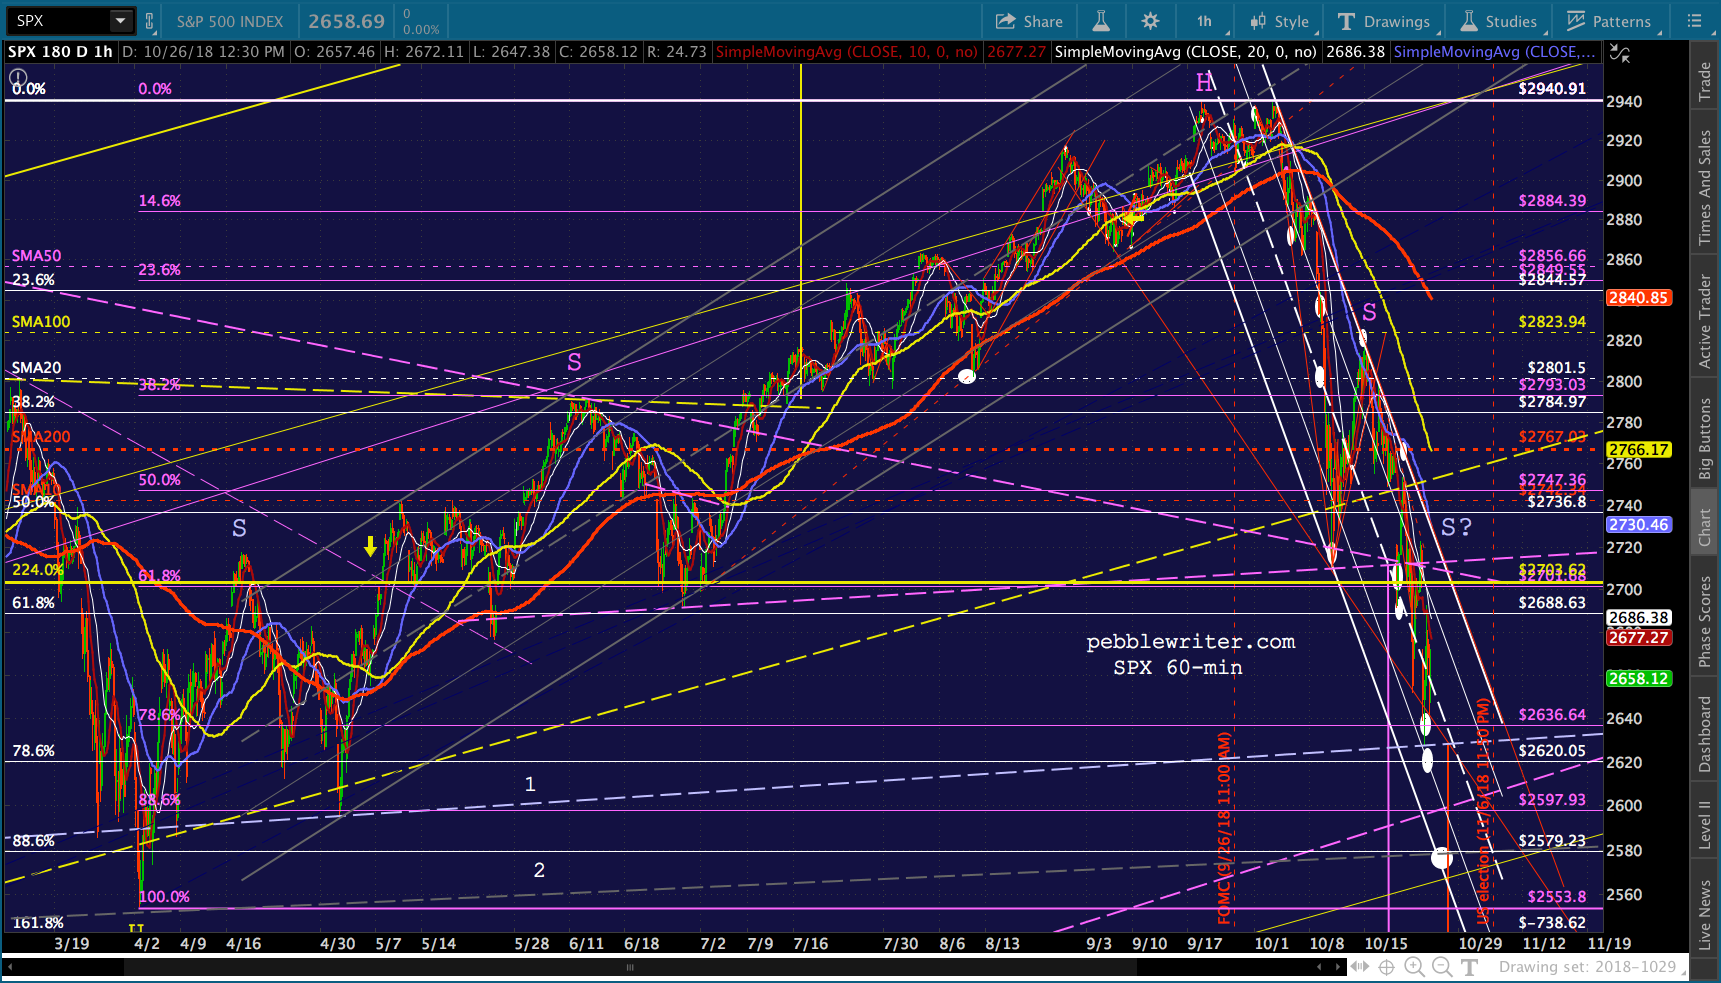
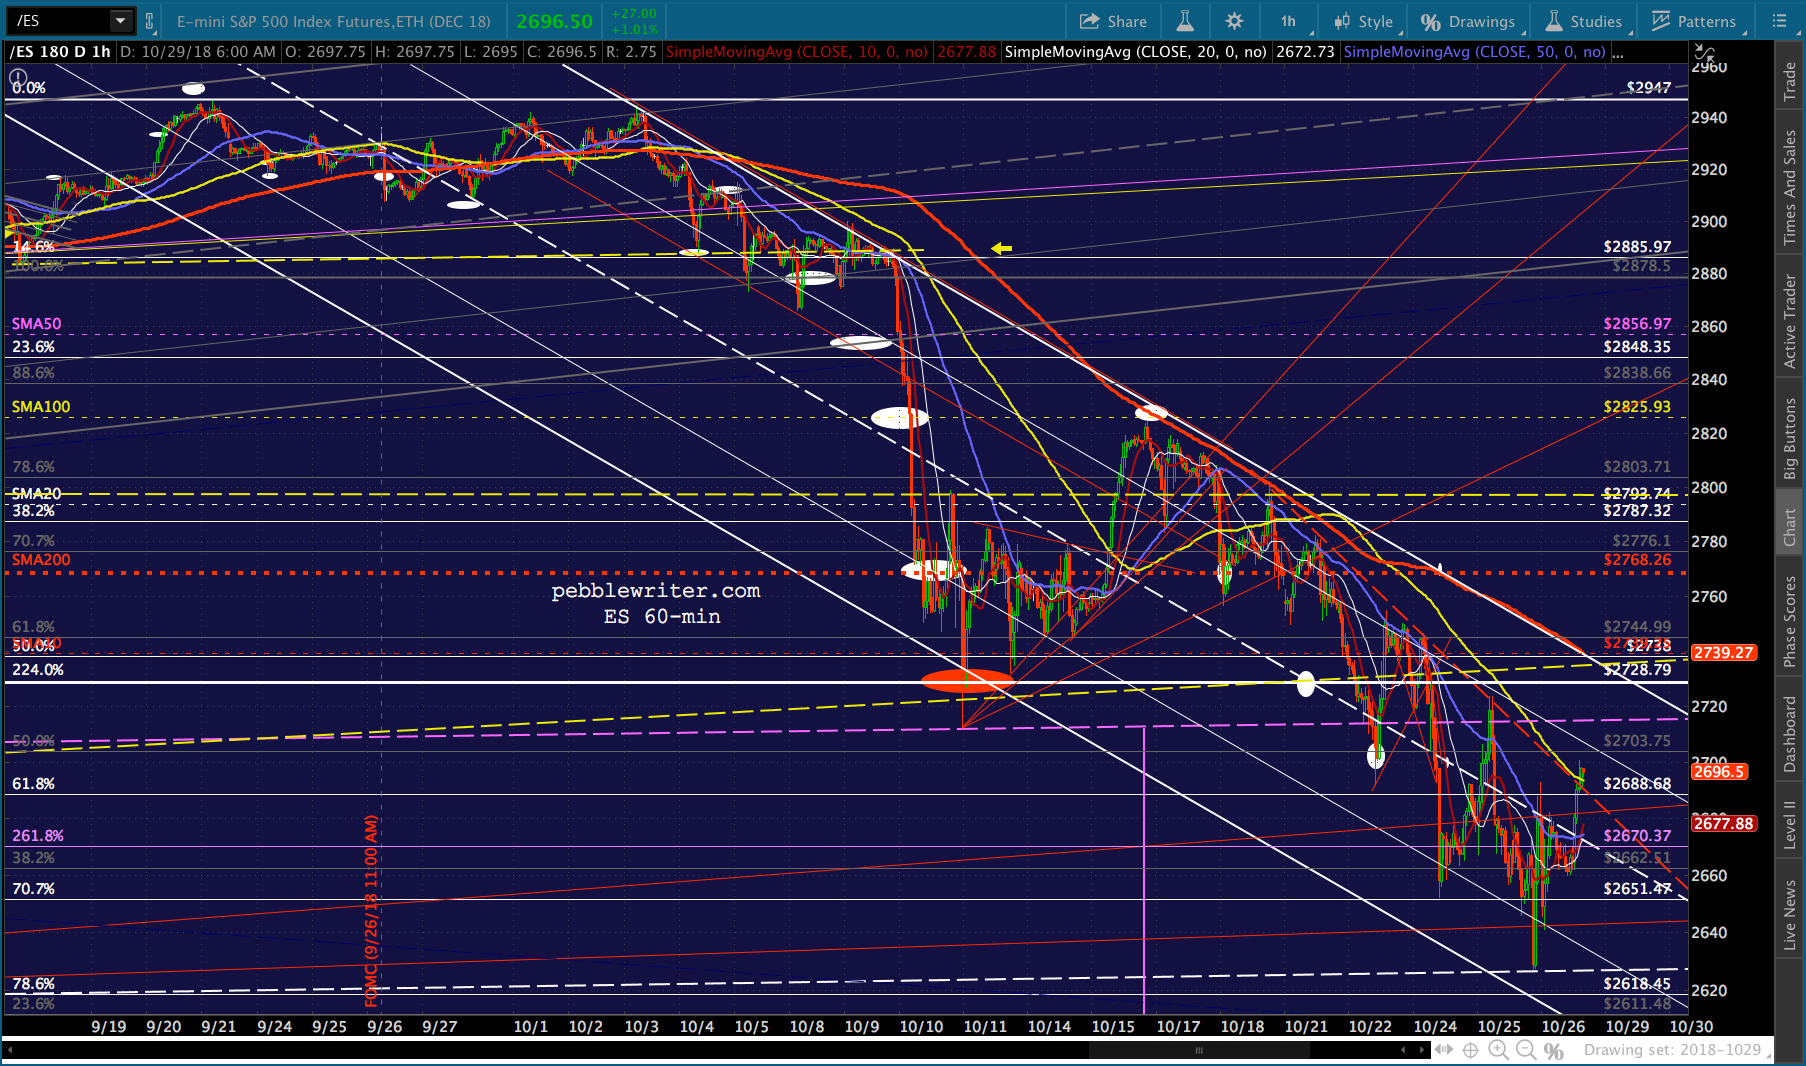 As we discussed on Friday, today’s bounce takes SPX dangerously close to recovery territory.
I wouldn’t get too focused on a new H&S pattern. It would take a pretty sizeable bounce to get a right shoulder together — and, I don’t think TPTB would want to deal with 2703 yet again unless they’re ready to keep SPX above it.
SPX is now within 6-7 points of the important Fib and is stalling. Note that VIX hasn’t broken down and USDJPY hasn’t broken out.
So, I think this is probably the end of the bounce and a safe place to revert to short — with an alert at the red TL where it intersects with the 2.24 at 2704ish. Confirmation would be a breakdown by VIX below, say, 22.60 and a breakout by USDJPY above 113.
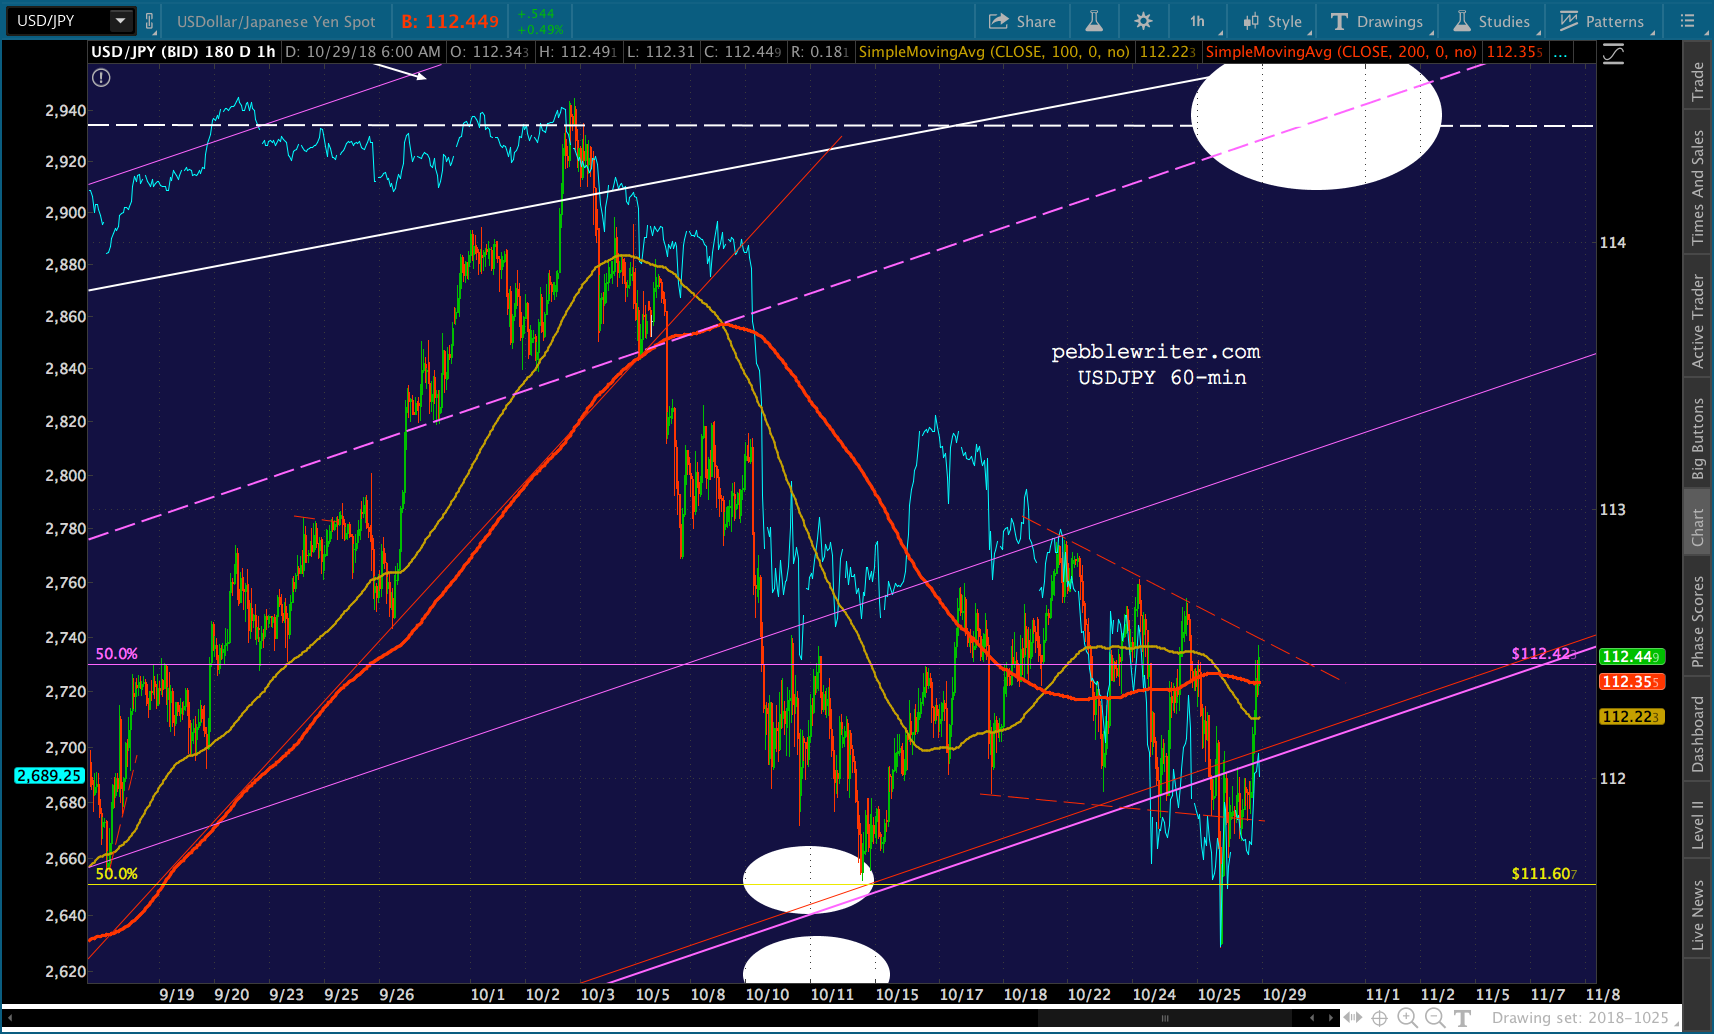
 Note that COMP hasn’t come close to breaking out and is probably setting up a falling wedge targeting our downside target
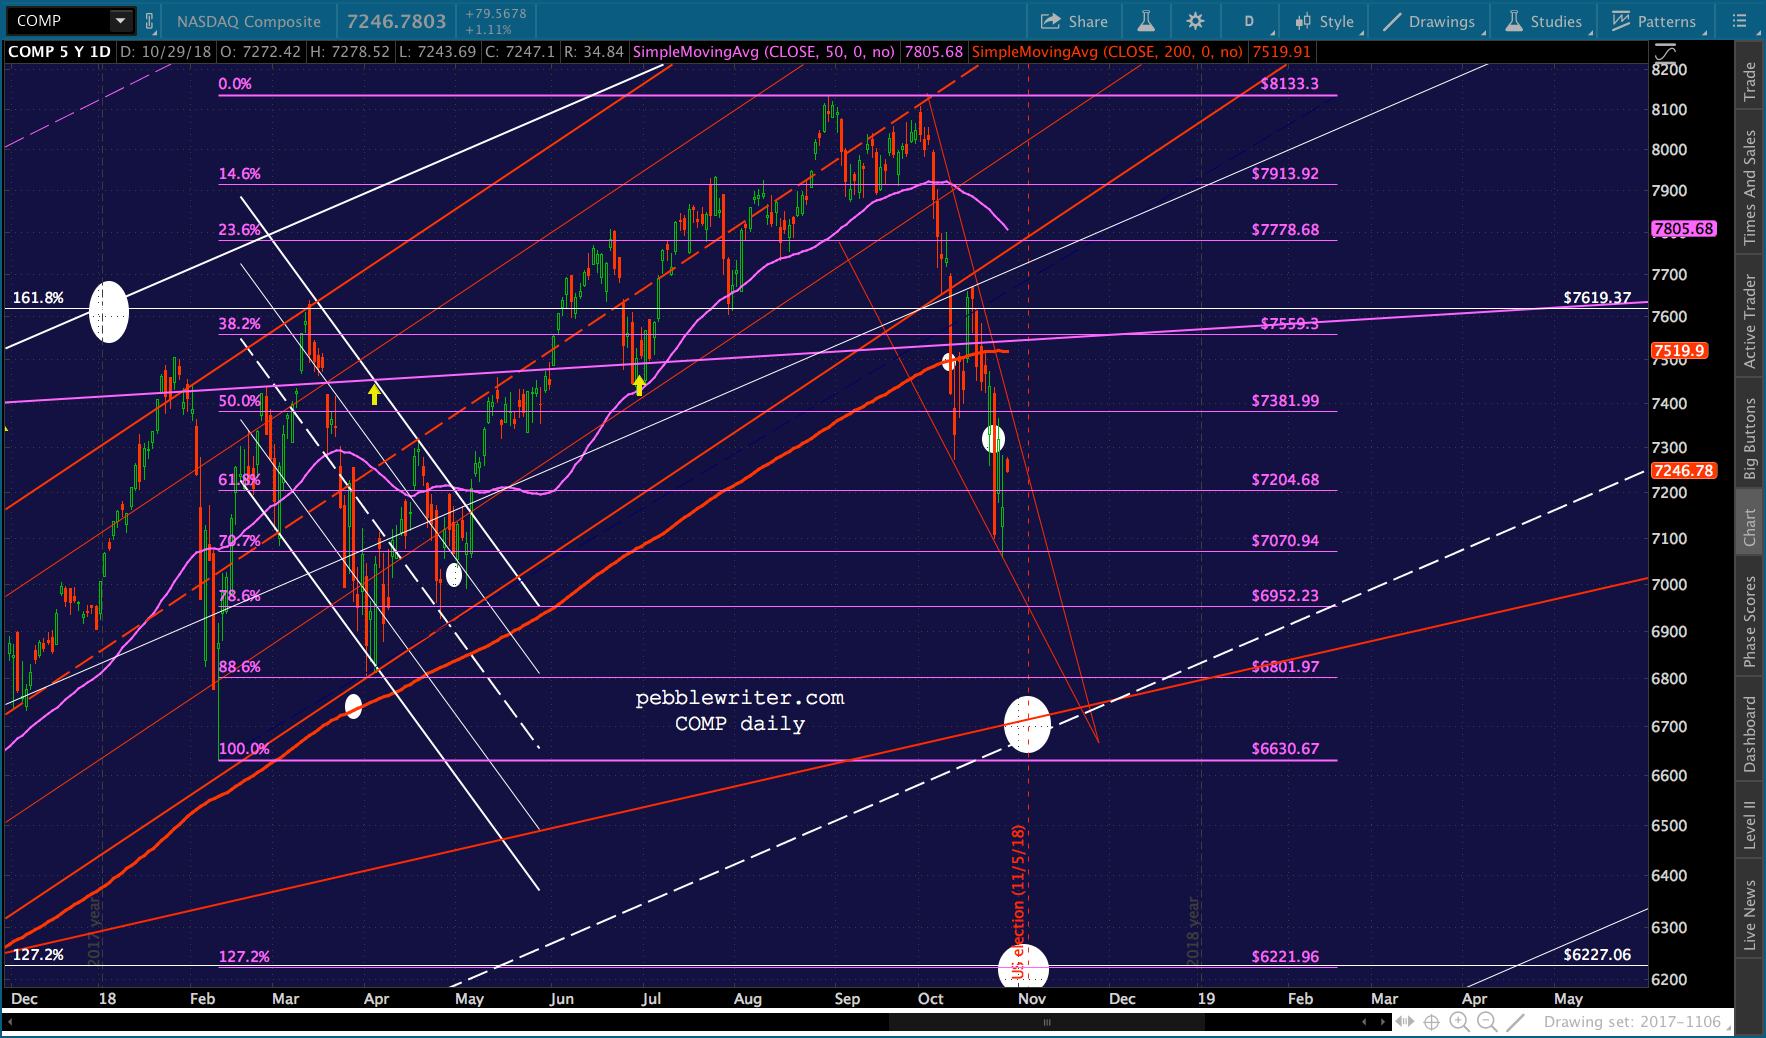 More later…
UPDATE: 3:11 PM
SPX is now just 6-7 points away from completing the larger H&S Pattern targeting 2310.
 The bigger picture…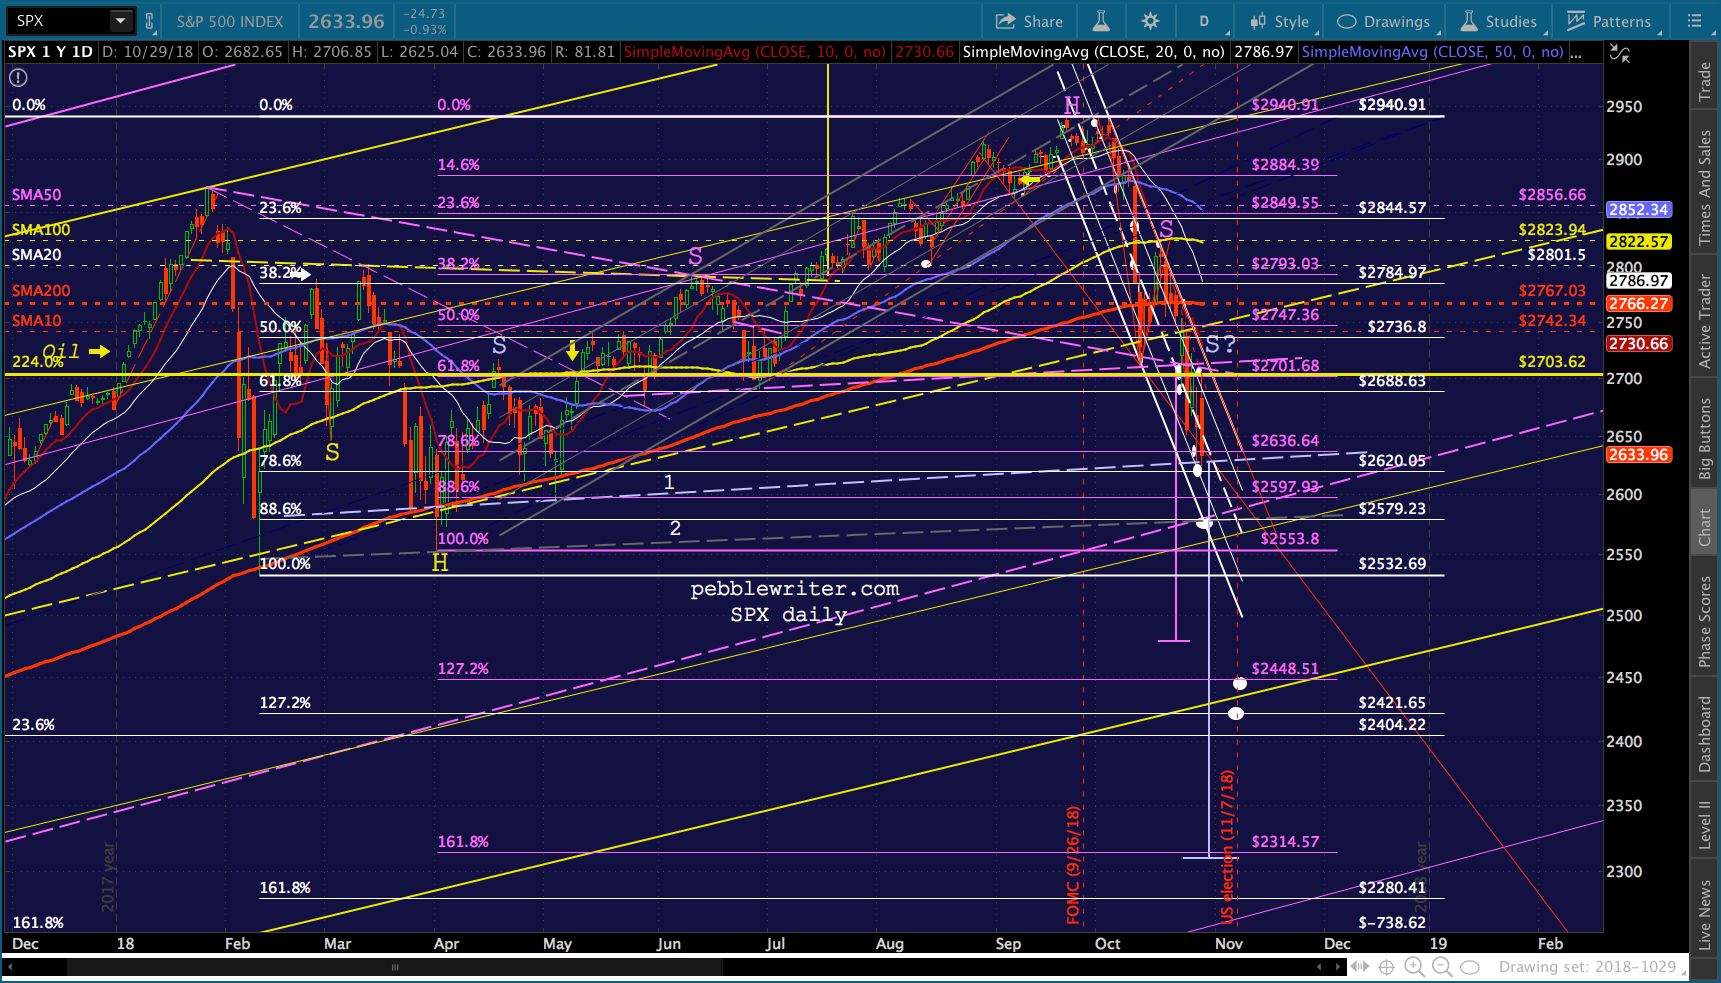
Comments
8 responses to “Charts I’m Watching: Oct 29, 2018”
Great job! Your expertise is paying off well this year! As we enter a high volatility trading environment over the next few years, I feel sorry for anyone not using your service.
Thanks, Tim. It’s a heck of a lot easier when every little dip isn’t “fixed” by central bankers and friends.
Hello, a few weeks ago, you suggested that the selloff might have something to do with the mid term election. Do you still assume it is the case? Thanks!
That was highly subjective off the cuff, tin-foil hat speculation. Having said that, where is the rescue that would ordinarily kicked in at the SMA200 or the 2.24 Fib? For whatever the reason, TPTB ain’t rescuing. I can’t think of a more logical reason than the midterms. But, I’m not sure it matters from the standpoint of forecasting. Just looking for the most accurate targets.
2310? that must be the next HnS
Correct. See the daily chart in the 3:11 update
I agree with your other subscribers, lucky to look over your shoulders (pun intended)!
Thanks, Michael. Big fan of puns…keep them coming.