

Algos took their Sunday night ramp and ran with it yesterday. Unlike last week’s breakout, ES was careful this time to break out of and backtest the falling red channel – thanks largely to a 26% plunge in VIX. While all the attention is on stocks, we should note that currencies continue to play an important role in supporting them. Notably, USDJPY reached our next upside target and EURUSD is nearing our next downside target.
 Today, we’ll take a look at next steps.
continued for members…First, a quick peek at stocks. If ES can push back above the dashed red line, it still has potential to tag its 3.618 up near 4000.
 However, this would mean a breakout for SPX – which already came within 6 points of its 3.618. So, bears should be rooting for a breakdown here or at least ES’ tag to come in the after-hours.
 SPX’s chart looks much less bullish – especially if it remains below 3917.
 VIX still controls much of the odds of that happening. Note that we now have a bullish (bearish for stocks) 10/20 cross again.
 On the bond front, TNX continues to moderate…
 …while the 2s10s continues to sound alarm bells.
 Oil and gas have gained slightly on the day, but are still well below their recent highs. Note that CL has completed its once a month backtest of its SMA20. This is an important test.
 On to currencies… We’ll start with USDJPY. Note that it in reaching the red channel top this morning, it is back to the place where it was on Jan 16, 2020. At that time, stocks were making new all-time highs – also with steady help from USDJPY.
Here’s the big picture showing the red flag pattern/channel from 2014. The bottom is very ragged at best, but the top was very well formed until Feb 2020. In this closeup, note that USDJPY fell back from its January 2020 test of the red channel top, but came back for another test around Feb 12. It bumped along for a week, finally breaking out very conspicuously on Feb 19 (the yellow arrow.) In so doing, it reached the top of its rising white channel – a natural place for a reversal.
 SPX had already broken above the red TL marking its previous highs, but it was well below its white channel top as it went into year end. USDJPY’s Jan move was designed to help keep it rising, but the Feb breakout was not successful.
On Feb 19, SPX peaked at a slightly higher all-time high and began its 35% plunge. USDJPY’s 6-day breakout had failed spectacularly. It fell 9.8% over the next two weeks before finally stabilizing at the bottom of what would become its new falling purple channel. Note this was also an .886 retracement of the 19% rise from Jul 2016 to Dec 2016.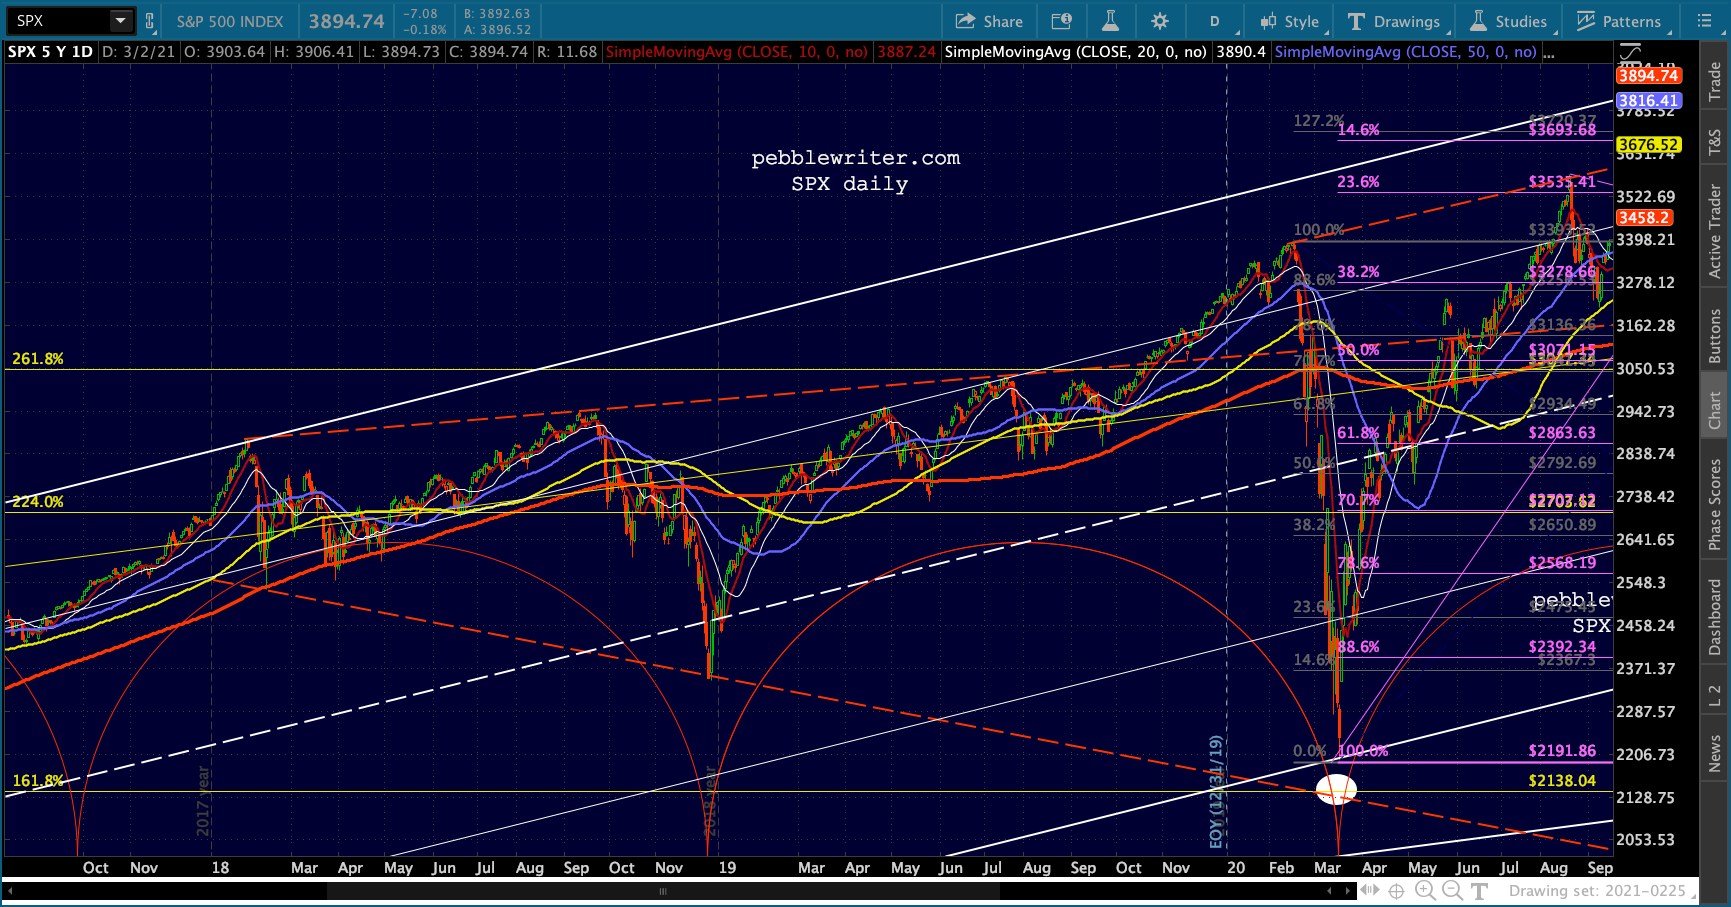 In its crash, USDJPY broke back into the red channel and then broke down from it – reiterating its outsized influence on stocks.
It bottomed on Mar 9 and gained 10.4% in the next 10 sessions as part of the equity rescue effort – reentering the rising white channel and even breaking out of the falling red channel again.
 This time the breakout lasted only 6 sessions, but by the time it peaked on Mar 23 SPX had got the message as well as support from other quarters, and USDJPY was allowed to break back into its red channel where, except for a two-day Jun 5 breakout to boost SPX back above its red TL…
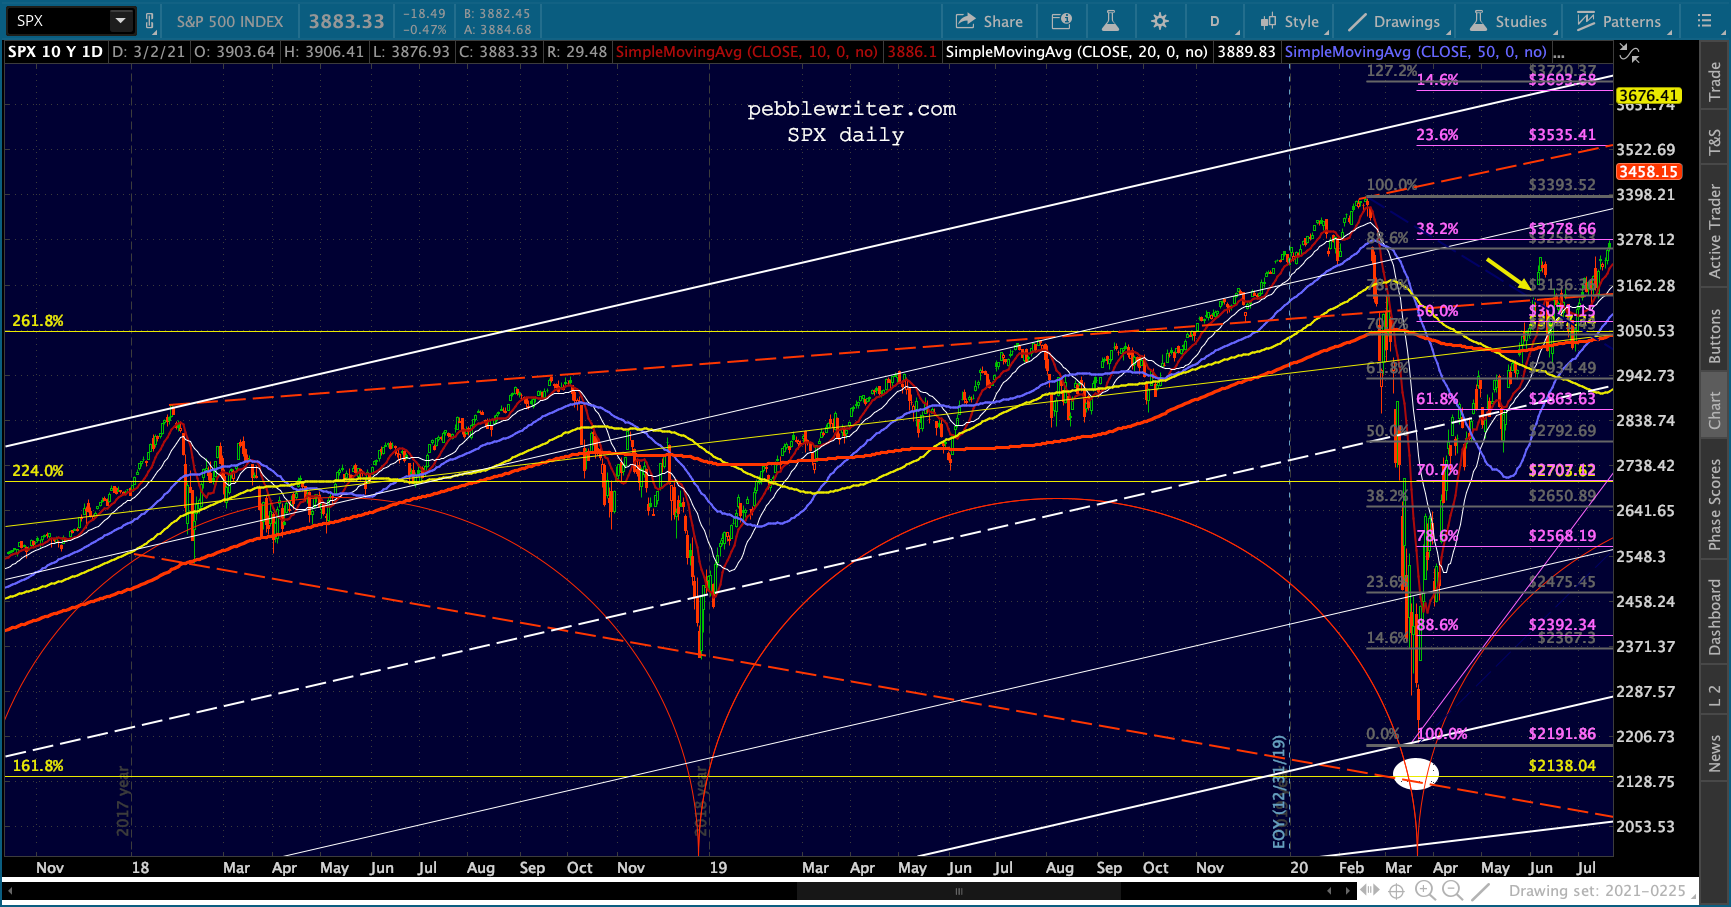 …it has remained. Until now.
 CL and VIX kept SPX on the rise once it had broken back above that TL and the 2.618. This allowed USDJPY to gently decline until Jan 5, 2021 when it came within a few pennies of the red .886 at 102.37.
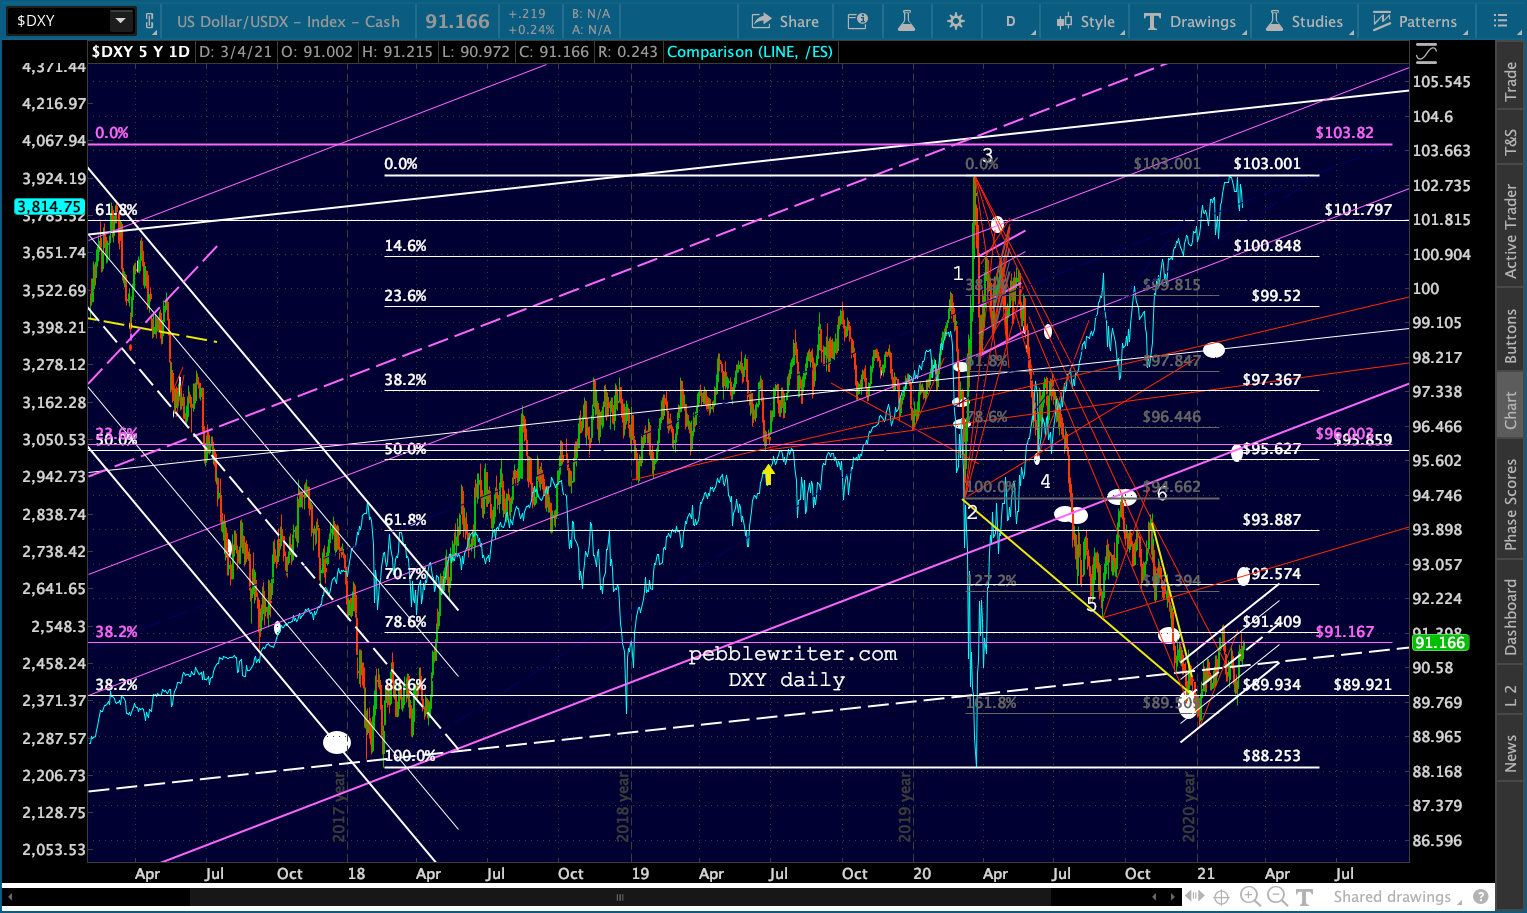
This also marked the low for DXY, which had begun a strong negative correlation with stocks last March. After the intial sympathetic selloff (“gee, USD-based assets are underperforming”), DXY spiked higher as the correction turned into a crash (“get me the hell out of everything except cash!!!”) The new rule for algos, then, was that if the USD was coming back to earth and rates were normalizing, it must be good for stocks. It was all part of the reflation narrative. For quite a while, the falling USD (DXY) was sensed as being equity positive.
When DXY finally reached our downside targets – the midline of the rising white channel and .886 Fib, we sensed the drop was over. It was.
 While it’s entirely possible DXY could still break down and go for the purple .618 or .786, I noted when it reached that white channel midline that equities were starting to act a little unsure of themselves.
In fact, it was a combination of several things: noticeably higher interest rates, the USDJPY having reached important Fib support, and the thought of the rug being pulled out from under the dollar.
The most important factor though, again, was SPX’s need for a boost. It had reached a new TL of resistance (the yellow arrow below) and needed USDJPY to get it over the hump.
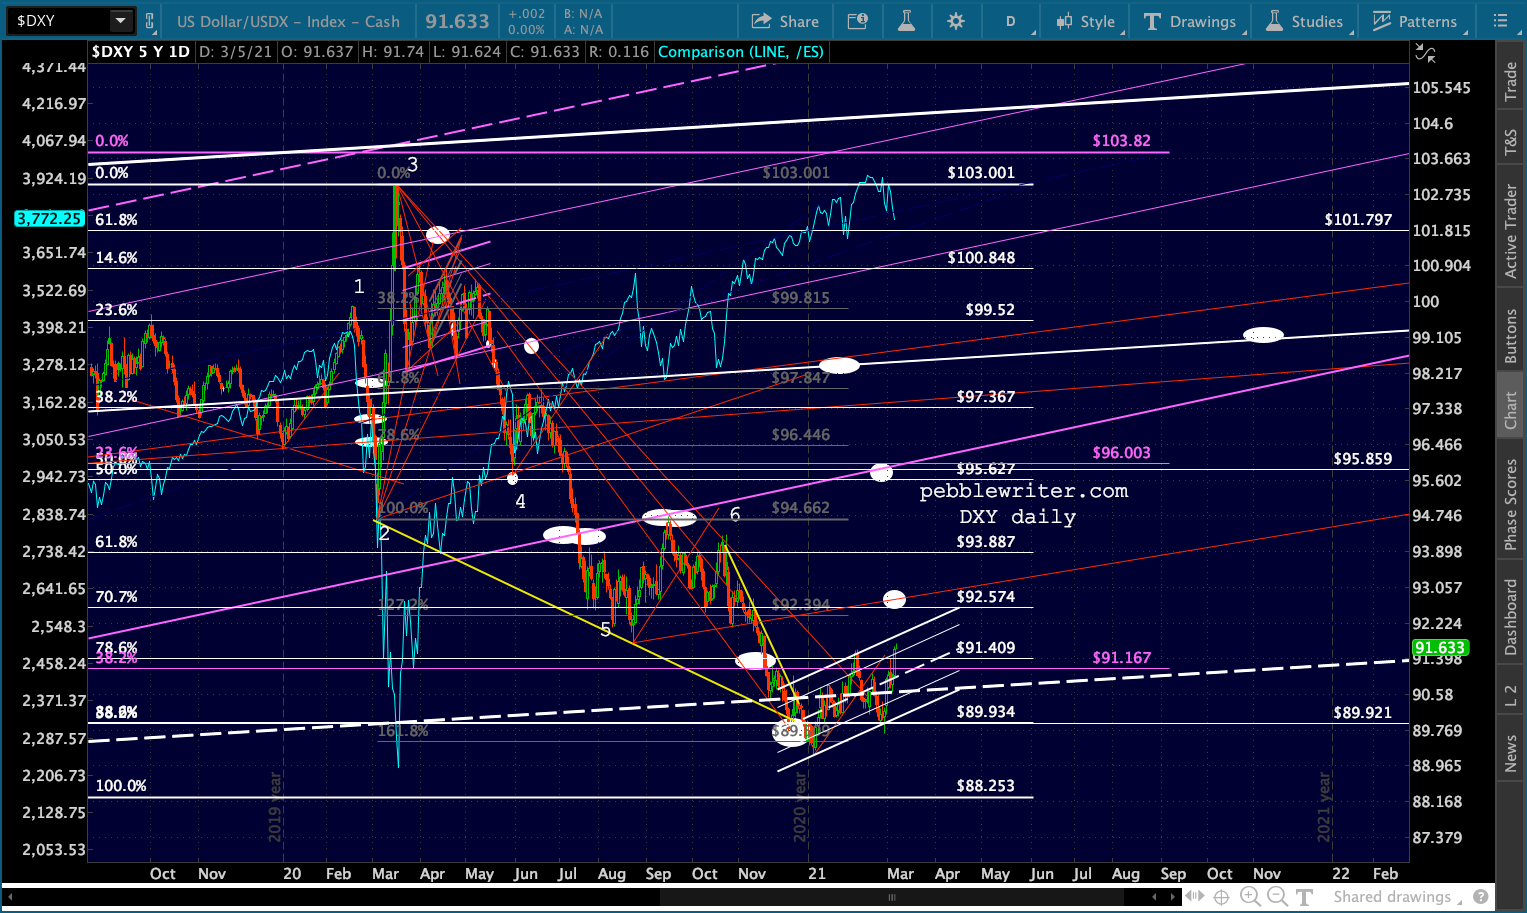
 Here’s a closeup with the arrow pointing at Jan 4…
 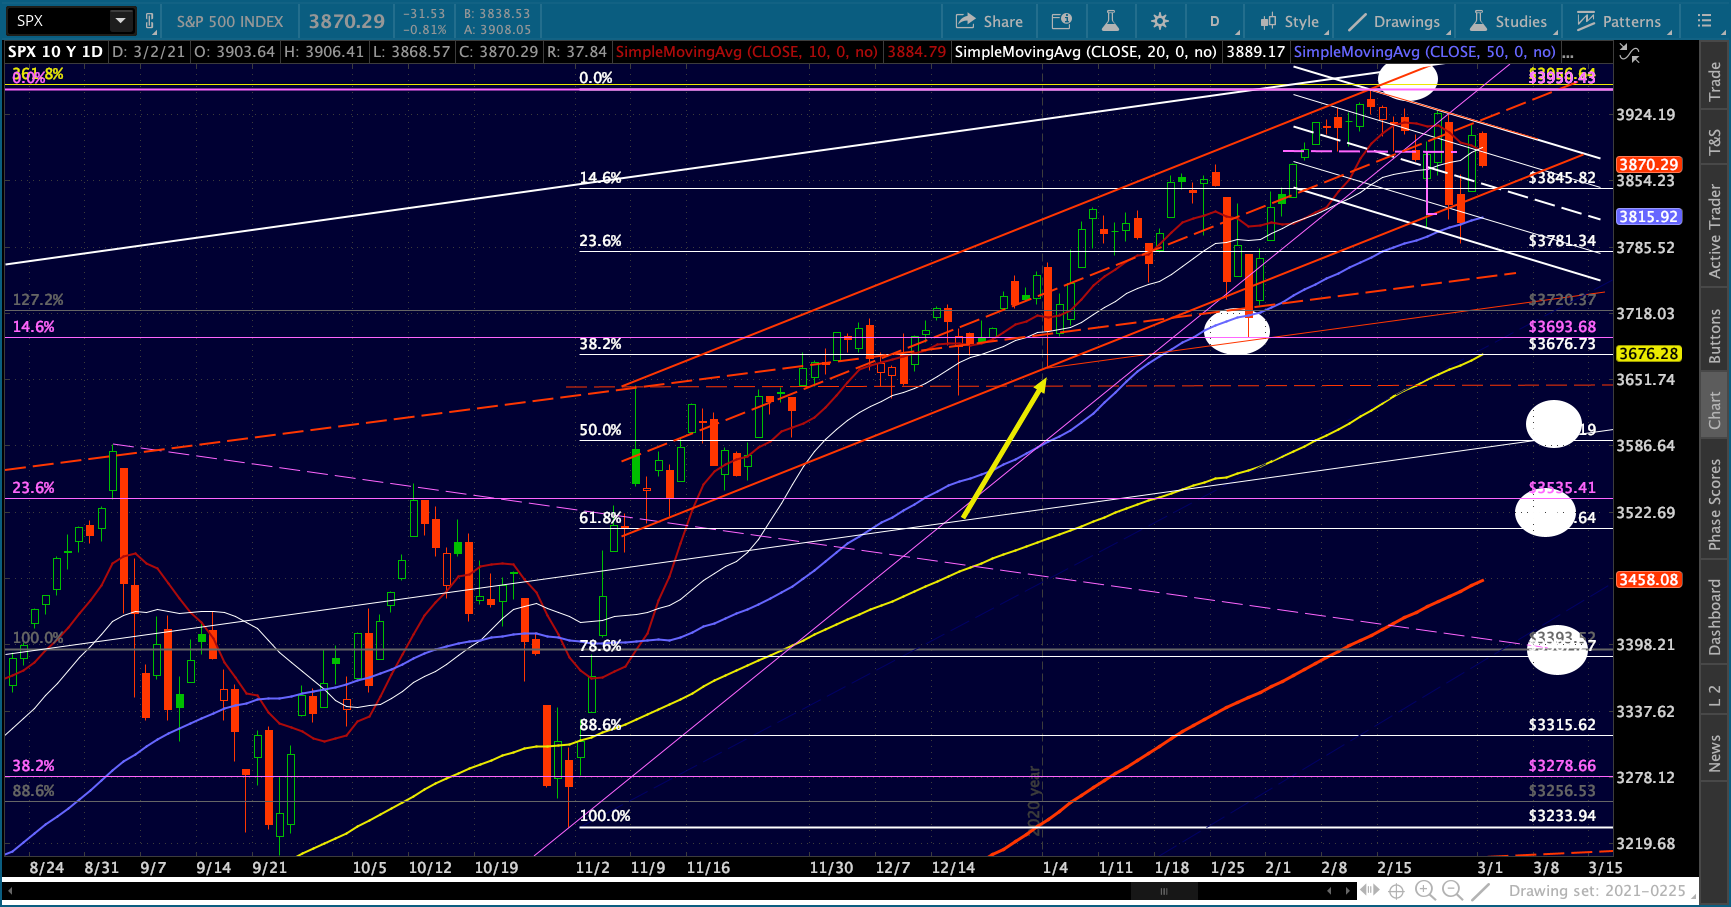 …which was the day before USDJPY bottomed and began its latest push via the rising white channel which brought it back to the red channel top.
 As expected, DXY has made little progress since then – going mostly sideways. This brings us to the euro.
The big picture: The weekly chart shows a huge rising white channel with EURUSD and SPX generally positively correlated (with exceptions) that accounts for its lows but is a bit of a mess otherwise. There’s also an alternative rising yellow channel that makes gobs of sense because of where its midline (also the neckline of a huge H&S) lies. The problem with the yellow channel, of course, is that it implies another tag of its bottom at some point. I wondered around the end of 2016 whether the white channel would break down and we’d get a tag of the yellow channel bottom at the purple .886 and falling red channel bottom sometime between 2016-2020.
We did see new lows and a near breakdown on election night 2016, but a massive rescue was needed when futures plunged 4.5% in a few hours. The spike higher in USDJPY (yellow arrow below) did the job…
 …but it took some fancy footwork to make sure that the USD’s spike didn’t throw DXY out of whack. This meant periodic resets of EURUSD to keep things in balance. The series of small, rising white channels in EURUSD did the job.
  The third of them, however, didn’t break down the same way. Instead, it broke out past the falling red channel line and lasted twice as long as the preceding two. Why?
Very simply, DXY was breaking out of its rising white channel. It even popped above the .618 for about a month at the tail end of 2016. EURUSD’s extended rise (dollar weakness) brought it back down under control.  Remember, this was a critical time for the stock market. SPX had reversed at its 1.618 Fib resistance, backtested its 1.272 over and over, broke out back above the 1.618…then failed to hold it all over again. It was crucial for the bulls for SPX to regain the 1.618 and never look back.
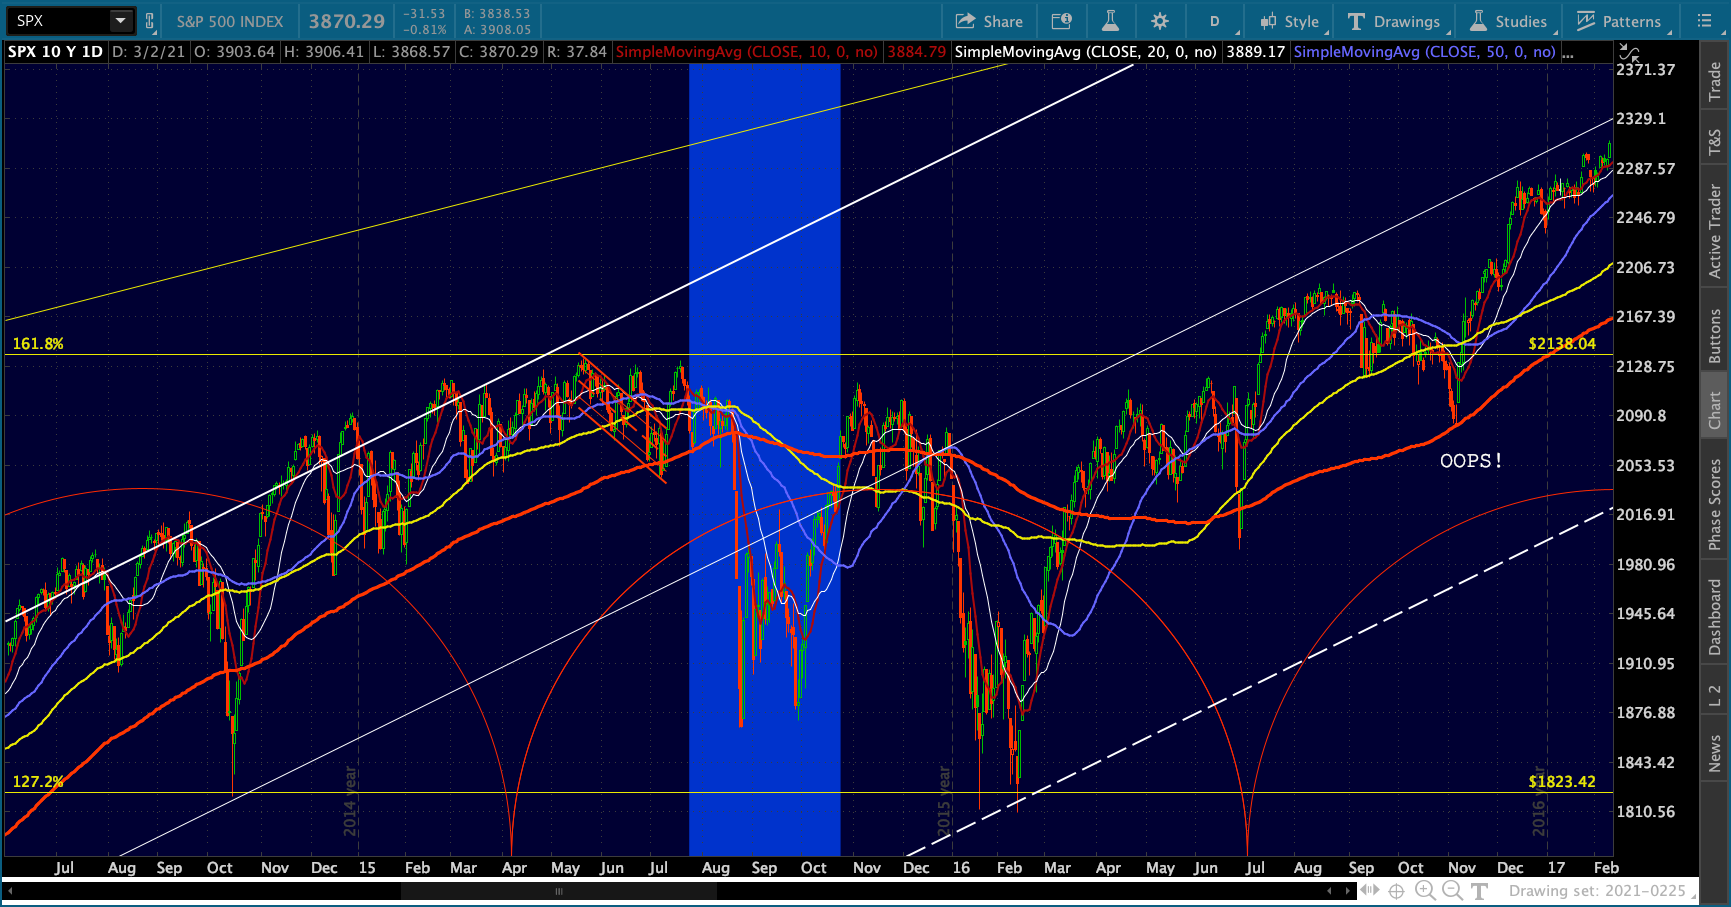 As mentioned above, the USDJPY’s spike did the trick, but had to be offset by EURUSD to prevent DXY from breaking out. I’d love to have been a fly on the wall at those Fed meetings where the plan was laid out. I guarantee you there were some anxious moments. But, it worked.
Back to EURUSD… The first two small white channels were generally supportive of stocks.  So, when the third channel came along in the wake of the 2016 election, the decision was apparently made to let it run. The weakening USDJPY wasn’t an issue as CL was on the rise and VIX had entered a period of sharp, steady decline.
EURUSD’s rise would last more than a year, finally topping out on Feb 16, 2018 – the anniversary of CL and SPX’s Feb 16, 2016 bottom. Importantly, EURUSD also tagged the top of the falling red channel and backtested the yellow channel midline/neckline (after a strong reversal at the red channel’s .786 line.)
This also precisely marked DXY’s important 88.25 bottom (also on Feb 16, 2018) and white channel midline.
 It was time to find out whether a rising USD (falling EURUSD) was consistent with higher stock prices. We didn’t have to wait long at all.
DXY’s bottom came within 2 weeks of SPX’s Jan 2018 peak and 11.8% correction to test its SMA200. After a huge bounce, it dropped back down and closed below its SMA200.
It wasn’t done. EURUSD’s rising white channel broke down – which wasn’t that big a deal. But, when EURUSD backtested the broken white channel on Sep 24, 2018, it confirmed SPX’s high (one day prior) and ushered in SPX’s -20% plunge. In other words, it wasn’t so much that EURUSD was dropping that hurt stocks. It was the realization that EURUSD had finished rising.
Not only would the USDJPY stop weakening, but it was prepared to strengthen quite a bit – again, a reflection of the fear which had entered the market.
We could go around and around all day, talking about how the move in one currency pair influenced stocks or another pair. But, the bottom line for traders is “what’s next?”
I think today’s close made it pretty clear. With stocks in trouble, USDJPY will do its best to stave off any additional equity weakness. This means breaking out of the falling red channel, at least in the short run.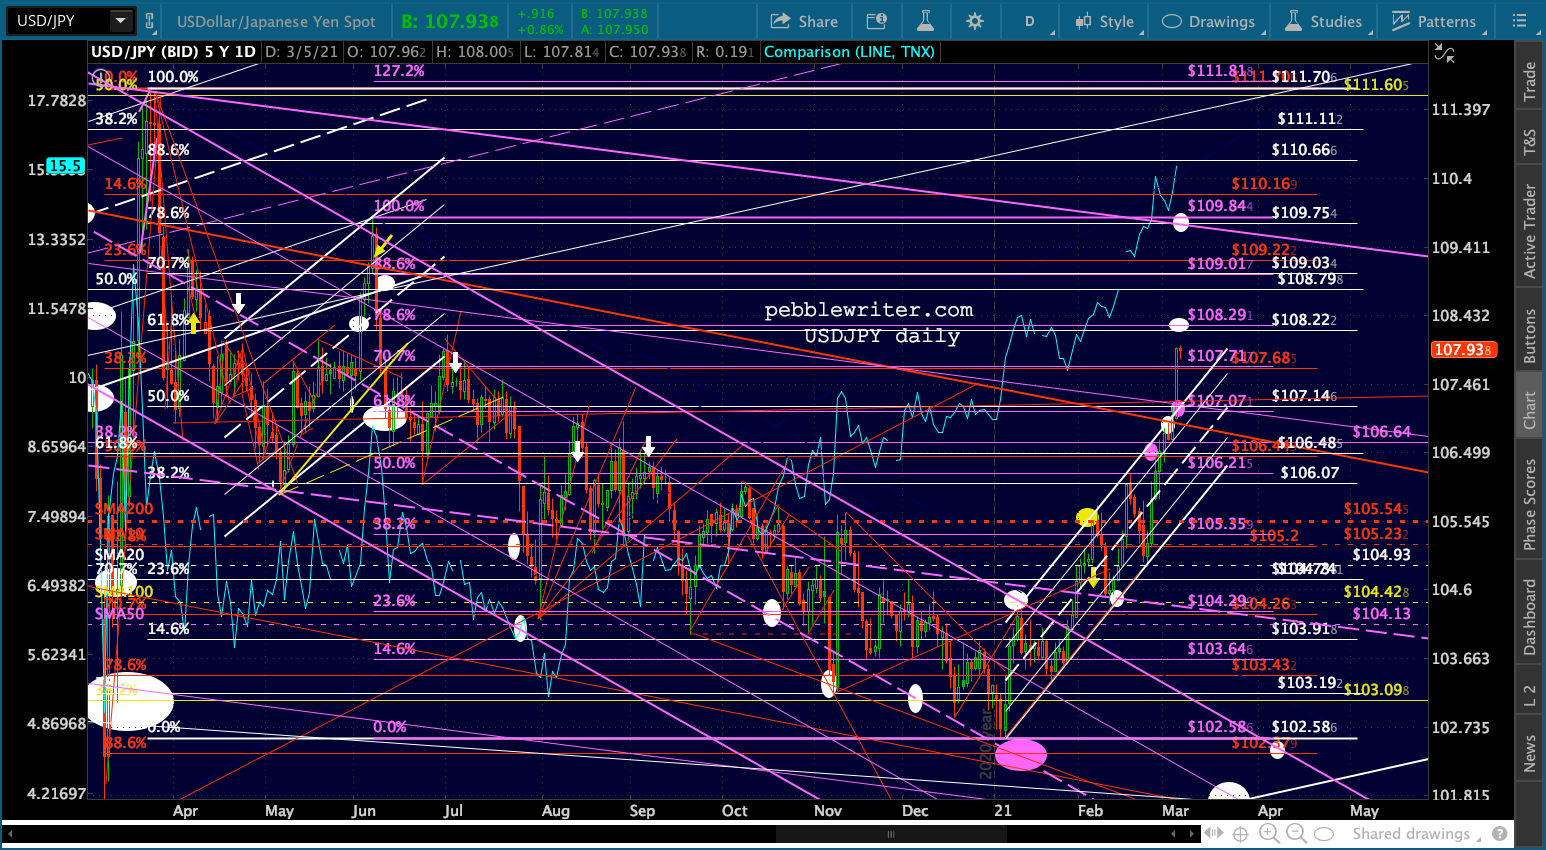 The next most interesting target to the upside is just above at the white .618 at 108.22. But, with enough momentum, USDJPY clearly has potential up to the top of the falling purple channel at 109.84. Remember, this is dollar strength , so it will be important to watch for signs of a reversal as we come up on the next higher fibs.
The only problem with continuing yen weakness is the oil/gas market. Since oil is priced in USD, a cheaper yen in a rising oil price environment is hard for the Japanese to handle. As bad as the YoY price rise and resulting spike in CPI and interest rates will be in USD, imagine how a plunging JPY could make things much worse – at least the Japanese.
What are the chances that CPI and interest rates will remain at appealing levels through April if energy prices remain the same and the price of oil shoots up 179%?
EURUSD is behaving exactly as expected following its red channel breakout. It has backtested its SMA100 and will soon backtest its SMA200. The only question is whether or not the SMA200 will hold. DXY is too hard to call. It has helped stocks and it has hurt stocks. It has risen during times of equity stress and it has fallen. My sense is that it will ultimately backtest the broken purple channel, currently around 95.86. It could get there in a jiffy if stocks plunged over the next couple of weeks.
 I’ll post more tomorrow when I’m a little fresher. For now, the expectation is that USDJPY will be higher and EURUSD will be lower over the next 6 weeks – assuming that oil/gas tumble as expected.
More later.