WTI has reached our 200-day moving average target posted last month. This is a very significant move which, unfortunately, didn’t happen soon enough to affect June CPI or PPI.
Long-time readers know that I’ve been harping on inflation for a long time. The reason is simple: math.
Annual “headline” CPI, which is the one we all fret about, is based on the year-over-year increase in prices – which is why I started worry about inflation in March 2020 after oil and gas prices cratered.
 I did a deep dive on the historical relationship between oil and gas prices and inflation and quickly discovered that the incredibly strong correlation which we began writing about in 2018 was likely to produce some truly scary results.
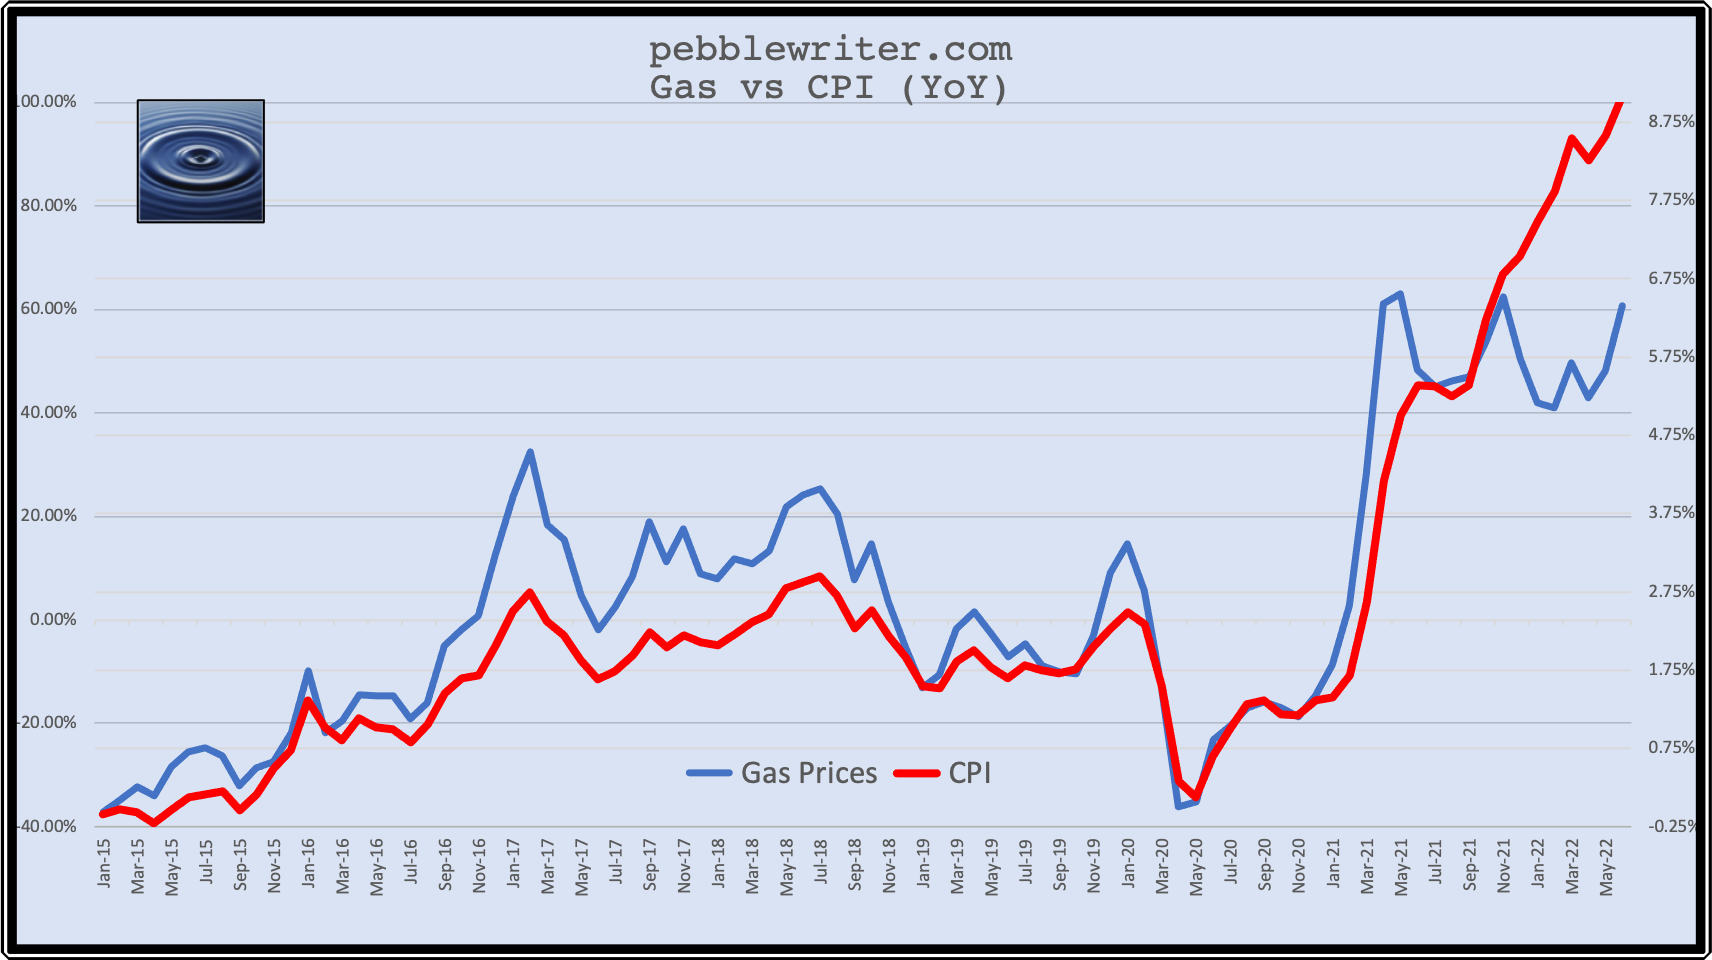
Up until late 2018, falling oil and gas prices had been responsible for CPI generally remaining below 2%. This chart from Jan 15, 2019 [see: The Big Picture] illustrated how every time inflation got a little out of control (over 2%) gas prices cratered enough to bring it back in line.
 Interest rates had risen right along with inflation until October 4, 2018 at which point I called a top in both [see: The 10Y Breaks Out.] The fundamentals didn’t suggest it at all. In fact, more than a few observers questioned my sanity. But, I reasoned that the recent breakout in rates from a 20-yr channel would prompt the usual response: a sharp decline in oil and gas prices as shown above.
 Trump had been tweeting up a storm with no effect…
…until one day the Saudis handed him a gift. Journalist Jamal Khashoggi, a thorn in the side of the Saudi crown prince, was murdered and dismembered at what was obviously the direction of said prince. The world was pissed and MBS went from being the “cool Saudi” to an international pariah overnight. Trump suddenly had leverage. From Coincidences and Consequences:
 Many considered my connecting the dots in this way a bit of a leap, but it was confirmed by Trump himself while being interviewed by Bob Woodward for his book Rage.
 Long story short, oil and gas nosedived – along with stocks – until they both bottomed out in December. CPI, which had been as high as 2.95% a few months prior, had dropped to 1.55% by Jan 2019.
The story might have ended there, with oil and gas generally bouncing around as supply and demand and interest rate goal-seeking dictated, but the coronavirus had other ideas. By the time the dust had settled WTI had plunged below our 20 target and finally bottomed out below 0. This meant that year-over-year deltas would remain negative for quite a while. But, importantly, it also means that beginning in early 2021, year-over-year deltas would start soaring – which they did.
In Mar 2021, we laid out the case for a sharp uptick in inflation and interest rates [see: Big Picture: Oil and Gas] and asked:
Given that interest rates are close to zero and must remain near zero out of necessity and the dramatic increase in oil and gas prices since last April’s crash would result in at least a 40%+ YoY increase and CPI is very positively correlated with YoY increases in gas prices and interest rates are very positively correlated with CPI, will politicians and central bankers allow oil/gas prices to remain at these levels?
At the time, I thought not. CPI had reached 2.6% and the 10Y had reached 1.75%. I thought it a likely point for a pause lest CPI pop up over 3.5%.
But, the Fed — which had fallen under the spell of rapidly rising stock and housing prices — decided otherwise. They advised us to ignore what we could see with our own eyes and play along with their “transitory” fantasy.
They doubled down and sold Wall Street on the wonders of the reflation trade (remember when that was a good thing?) A month later, CPI topped 3%. Two months later, it topped 4%. Tuesday, we learned that has now reached 9.1% – seemingly out of control.
Many blame President Biden, arguing that his energy policies are responsible for the rise in oil prices and, thus, inflation. While it’s true that WTI rose from 53 to 93 in the first year of Biden’s presidency, the YoY delta in gas prices had peaked at 62% in Nov 2021 and was rapidly declining. By Feb 2022, it had fallen to 41% – historically commensurate with CPI around 5%.
It didn’t play out that way for four primary reasons:
- Putin invaded Ukraine
- energy inflation spilled over into most other categories
- the Fed was inexplicably still pumping $120 billion into the markets every month
- a shortage of journalists willing to be chopped up into little pieces by a Saudi despot
Reasons 2-4 might indeed have been transitory. We’ll never know. But, it was Putin’s invasion of Ukraine that spoiled the Fed’s plans. Instead of reversing at a very logical Fibonacci level which coincided with the top of an obvious price channel, CL popped up and tagged a target on Mar 7 that we hadn’t expected to be reached until the end of the year.
 Had prices even stabilized at January’s levels, inflation likely would have fallen as the YoY delta fell back to under 20%.
 Even if prices had continued to rise at the 1.73% per month average seen in the first year of Biden’s presidency, it seems likely that CPI would have fallen.
 Take away the Fed’s profligate QE and Putin’s monumental miscalculation and we might never have seen 6%. Instead, we’ve got this.
 The Fed is finally on the case, raising interest rates and trimming back their balance sheet. But, it’s hard to know how large a decline in stock values they can stomach before at least signaling a pause.
It’s also difficult to know how deep a recession to expect. I believe we’re already in one. But, how far will the economy fall? Various sentiment surveys and the Atlanta Fed’s research indicate that the decline is gaining momentum.
Will it spill over into real estate as in 2008-2009? Will rapid wage inflation morph into rising unemployment prints? I think so, but suspect the Fed will blink at some point. The first test will likely be when stocks decline to pre-COVID levels – about 30% from the January highs.
Last, I’ve no clue when/if/how the war in Ukraine will end – just that it will eventually will. But, God knows how much damage will be done in the interim. Europe is in for a very tough 2022, with inflation spiraling higher thanks to surging energy costs, the plunging euro, and no wiggle room in a slowing economy to preemptively raise rates.
A broader war with Russia seems increasingly near-fetched. If they’re really lucky, they’ll merely experience a quarter or two of stagflation. If not, we could be looking at Great Financial Crisis II, with bank failures and spiraling interest rates thrown in for good measure.
And, don’t think for a moment that it wouldn’t affect the US. The Fed is gambling on a soft landing with nearly full employment. But, it never seems to work out that way, does it? And, would we even want that?
A soft landing would probably mean energy prices never get to clear. That the proverbial can gets kicked down the road for the next administration/Congress to not handle. I live in California, where gas prices are still well above $6/gallon. I’m okay paying that if it means forcing Putin to back down. It might even accelerate the development of alternative energy so my grandchildren will inherit a planet worth living in.
But, I’m well aware that I’m in the minority. So, the guys behind the curtain are going to need to come up with some pretty fancy footwork: a plan that keeps energy prices falling, inflation back under 4% and the 10Y back under 2.5% – all without bringing on a recession that sends stocks down 50% and real estate down 20%.
Personally, I don’t think it’s possible. I think the recession and falling asset prices are not only inevitable, but necessary. It’s also what our analog suggests. To that end, here are our expectations for the very exciting next few days.
continued for members… (more…)