There’s a lot to unpack this morning, as several targets were tagged overnight. USDJPY finally popped up to tag its 200-DMA……which enabled ES to come within 1.43 of our 3076.93 target – the 2.618 Fib extension of the drop between 2007-2009. I thought this was going to happen over the weekend, but better late then never.
It’s been a while since we had a nice pop and drop. Stay tuned.
We would almost always expect a big bounce off SPX’s 200-day moving average. Despite yesterday’s dip below the 200-DMA, the index dutifully crept back above it in time for the close. And, the futures are currently showing an 8-point gain.Yet, if an analog I’ve been watching and our yield curve model are correct, this bounce won’t last. Stocks could be sharply lower by Monday.
We started posting about TSLA a little over a year ago when it dipped below important horizontal support [see: Can Tesla Avoid a Crash?]
We’ve updated the charts multiple times since then, working to stay ahead of Musk’s obvious attempts to manipulate the stock. The harmonic picture has been tricky due to the presence of two Point X’s which produces two different grids – the purple and the white.
TSLA dipped below the white .618 in March (and multiple times afterwards) bolstering the argument for the purple grid. But at times it has appeared that the white grid aligned nicely with channel lines such as this chart from last September which officially triggered a short call at 289 [see: Crypto Carnage] which was reiterated at 291 on April 3 [See: Can TSLA Survive This Crash?] and targeted 202.29.
The Better Late Than Never Department has notified me that TSLA just crashed into 202.29, nearing the completion of this particular leg of its journey.
Given that OPEX is in the rear view mirror and the futures are about to break below support again, we have to wonder whether TSLA is done.continued for members… (more…)
SPX needed about 22 points downside to reach the support of its SMA50, a rising channel bottom, and a falling channel bottom. ES, which finally reached our 2655 target from last week [see FOMC: Endgame] is currently off 30 points. At this rate, SPX will breach its support on the open, especially if USDJPY doesn’t bounce here at its new lows.Is it time for bulls to get nervous?
I was on the road yesterday, so I listened to CNBC on XM while tooling around town. I lost count of how many pundits sounded downright angry about how the market was melting up. “It makes no sense!” they cried, citing countless statistics from plunging retail sales to plunging earnings expectations. Not one of them brought up VIX.In a market where most of the trading is by computers which are merely responding to preprogrammed signals (aka algorithms) it has become quite simple to nudge the market one way or another.
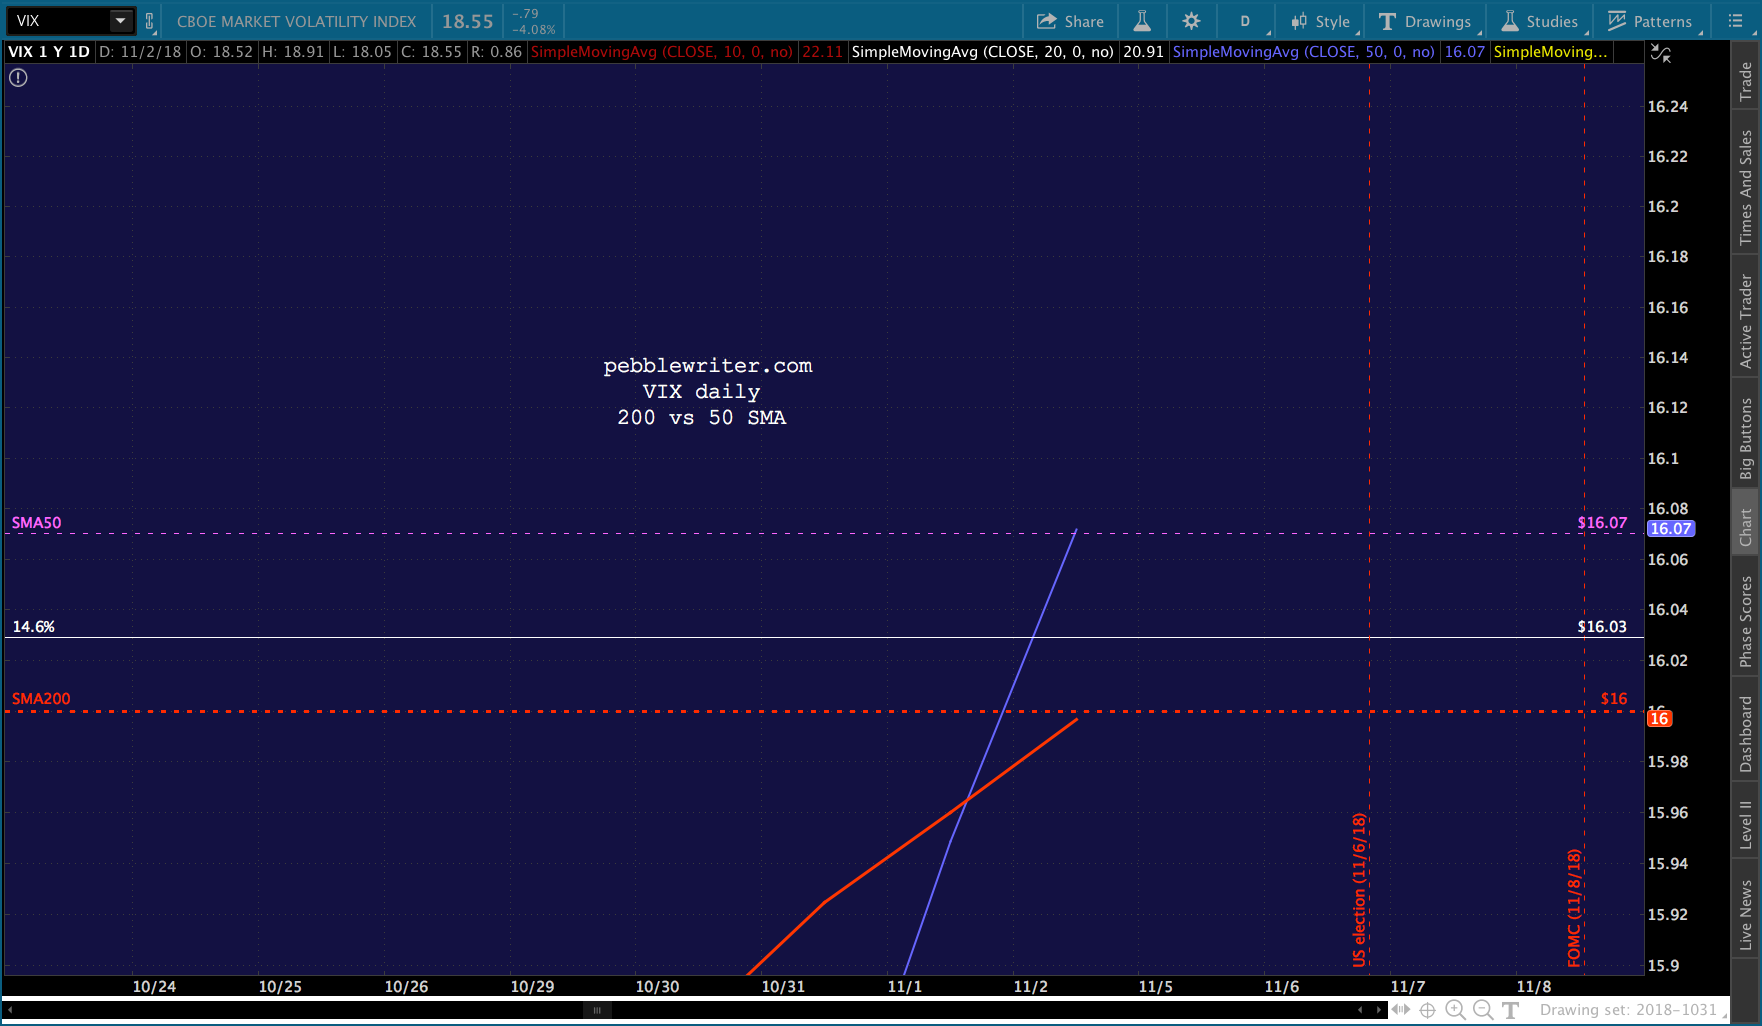
Given that COMP has really struggled to get and stay above its SMA200, VIX is telling the computers to buy. It already got the ball rolling by plunging below its SMA200 and is now reiterating the signal by simply breaking down below the red channel bottom.This is a well-worn trick, illustrated best by the period 2015-2016. Every time SPX needed to get back above its SMA200 (in order to delay the 1823 tag until the channel bottom arrived in Feb 2016)……VIX was there with an assist, dropping below its own SMA200 (the red moving average.) When things got really dicey and a big push was needed, VIX broke down below the well-established trend lines (below in red.)Now that it’s doing the same thing again, and oil and gas, interest rates and currencies are all following suit, the message is unmistakable: buy, machines, buy!
Will the few remaining carbon-based investors also comply?
Yesterday’s setup for the e-minis looked pretty straightforward: a drop through the 200-day moving average and backtest of the 2.24 Fibonacci extension at 2729. Futures had already dropped through the 200-DMA and were heading south when the dismal retail sales data dropped.
I hedged my bet, redrawing our daily downside target to include the 10-DMA — just a few points below the Fib extension.Fifteen minutes into the session, as ES reached 2730.25, the headlines started dribbling in. Fed Governor Lael Brainard publicly commented that QT should end this year, ahead of schedule. Larry Kudlow commented that there was a glitch in the retail sales data. Mnuchin felt all warm and fuzzy about the trade talks.
Faster than you could say “Plunge Protection Team” ES reversed course and SPX closed the day with a gain. But, the move didn’t feel finished. As I wrote at the end of the day:
ES looks likely to test its SMA200 all over again. But, will it make it on down to the 2.24? Its SMA10 will probably be up to 2728 by tomorrow morning, adding additional support.
I guess the market fairies were listening, because that’s exactly what happened overnight. ES dipped to 2729 right as the SMA10 was arriving on the scene, then spurted 27 points higher — breaking out of the falling white channel in the process.The algos are in full support mode at present, though a few charts suggest a pop and drop is in the cards if VIX doesn’t pull off a game changing plunge.
The headlines have been coming fast and furious over the last 24 hours. First, Trump’s tweet yesterday morning regarding trade negotiations with China touched off a rumor, declared false this morning, that a trade deal was imminent. But, SPX soared yesterday anyway.
Then AAPL’s earnings came out. The numbers were underwhelming; and, the company’s announcement that they’d no longer report unit data was very poorly received.
The chart we put up yesterday prior to the close [see: All Eyes on AAPL] showed substantial downside potential… …which after-hours trading is confirming.Then there was this morning’s payrolls data: a 250K increase with a 3.1% increase in average hourly earnings. While no doubt It’s exactly the sort of data the Fed needs to justify further rate increases in the face of the collapse in oil and gas prices — the last piece of the puzzle.
Gasoline has now fallen over 20% since our Oct 3 short call and tagged another downside target yesterday.Oil is off over 16% and just broke beneath horizontal and channel support. To be sure, it will keep October’s CPI low and will delight voters driving to the polls on Tuesday. But, like the employment data, there are repercussions.By the way, I have updated our oil and gas forecasting results, available at the links below.
I hope to post currencies, VIX and gold later today or this weekend.
Futures melted up to backtest the SMA200 early this morning and have since fallen 16 points to the algo-darling SMA5 200. It remains to be seen how the mixed messages being sent up from Washington and Cupertino will play out. But, for now, I’m leaving our targets in place.For the moment, at least, VIX’s 50/200 cross is on again.continued for members… (more…)
It is often said that there are two sides to every story and, somewhere in middle, lies the price of oil. Okay, I paraphrased that just a bit.
But, isn’t it odd that the day after the Saudis threaten $400/barrel oil, Donald Trump suddenly embraces the ludicrous “rogue killers” theory for the death of Washington Post columnist Jamal Khashoggi?
It appears that after days of vehement denials of any involvement, the Saudis suddenly remembered that Khashoggi was, in fact, assassinated and dismembered in their Turkish embassy (Saudi operative: “Oh, yeah…that guy that we chopped up with a bone saw? I had forgotten all about that!)
After a 20-minute conversation, the president who fell in love with Kim Jong-un also came to terms with Saudi King Salman. Was it love? To quote the master of the deal, himself, who knows?
But since Trump is desperate to reverse the rise in gas prices, inflation, and interest rates between now and November 6 (and, to salvage billions in arms sales) don’t be surprised if we get that next leg down in oil prices very soon. Nobody knew the economy could be so complicated!
And, while we’re on the topic of government prevarication, the much-delayed September Treasury Statement was finally released yesterday. Anyone notice something odd about September outlays? Did we really see a plunge in every expense category? Or, maybe, someone decided to massage the numbers just a bit to prevent the report of a $1 trillion deficit. Appearances, again.
Nah…then we’d surely see other efforts to obfuscate the country’s fiscal plight. For instance, they’d never allow charts like this one from the August report.
The same chart in September… (appearances, indeed!)continued for members… (more…)
SPX came within 7 points of our downside target yesterday, getting a midday bounce that couldn’t quite reach the 200-DMA. Futures popped as high as 73 points off the intraday lows, but have since given back about 12 of those points and are perched barely above ES SMA200 at a 28-pt gain in the after-hours.If those gains hold, it still won’t be enough to ramp SPX back above its 200-DMA. What’s more, USDJPY, RB and CL have further to fall, VIX has additional upside potential and DJIA and COMP remain below their 200-DMAs. Despite the after-hours euphoria, stocks aren’t out of the woods just yet.
One economic item which doesn’t usually attract that much attention, but might today: Treasury Budget. The trend hasn’t been very positive lately as witnessed by the widening gap between outlays and receipts.
Export and import prices are also due out (8:30am.) These will get extra scrutiny to see what impact tariffs have had on prices so far. And, Michigan Consumer Sentiment (10am) frequently impacts markets.


 …which enabled ES to come within 1.43 of our 3076.93 target – the 2.618 Fib extension of the drop between 2007-2009. I thought this was going to happen over the weekend, but better late then never.
 It’s been a while since we had a nice pop and drop. Stay tuned.