

I can’t recall the last time we saw such a wide array of expectations regarding the FOMC’s next steps. Like opinions, data has been all over the map. Just this morning, Trump’s latest nominee for the Fed, Stephen Moore, insisted we could have 4% growth with no inflation going forward. Total nonsense, of course.
Futures were off by as much as 7 points overnight before a pop in oil futures brought them back to even. They’re currently off about 2 points — about where we were yesterday morning at this time.
 If the rising wedge and SMA10 break down — likely, as the FOMC is rather boxed in — look for ES to test its rapidly rising SMA50, currently at 2846.50.
 Today, we’ll take a look at the big picture and try to discern what the charts suggest the Fed’s actions might be.
First, a reminder as to where SPX/ES stand. As we discussed yesterday, a drop through 2940 — which it should do on the open — is a signal to short. From there, we have multiple downside targets starting with the SMA10 at 2919, the SMA20 at 2901 and SMA50 and small white channel bottom at 2938.
 If the white channel breaks down, there’s little in the way of support until reaching the SMA200, currently at 2766 and rising slowly, followed by the 2.24 at 2703.62 in late May.
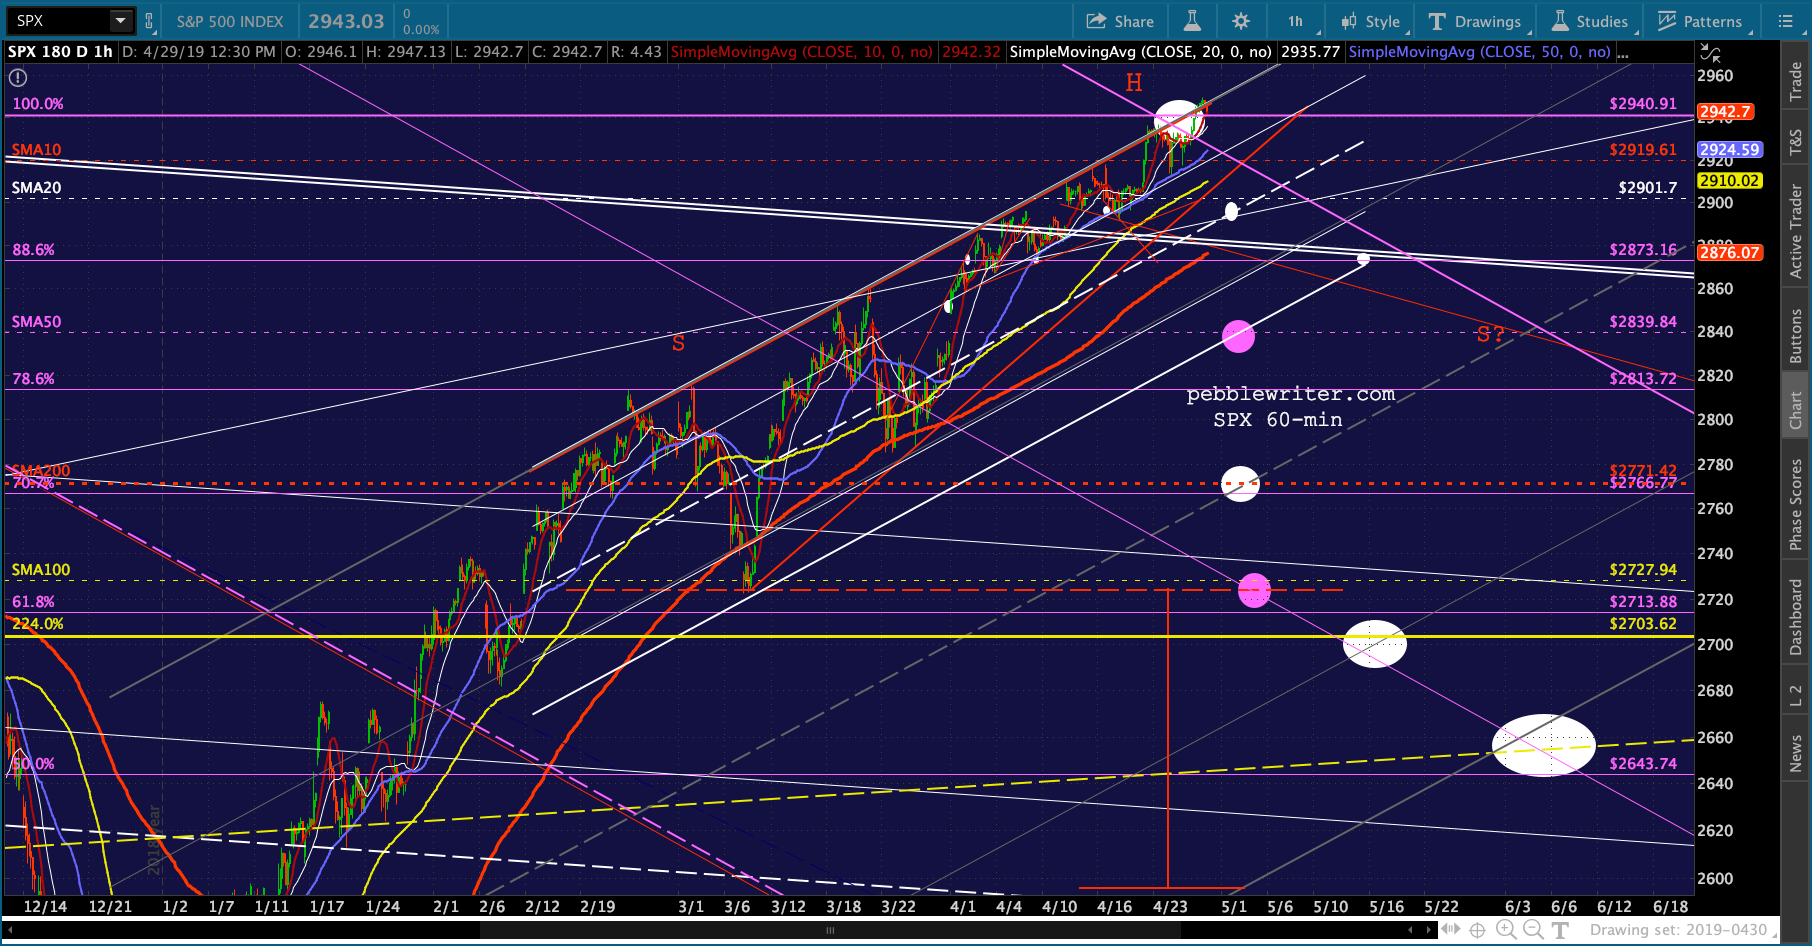
continued for members…
VIX is still angling higher, but not so very far from the channel bottom it bounce off of two weeks ago. The important line in the sand is the TL off the December highs at about 13.28 or so. Note that VIX has remained below the .886 retracement at 13.32 since Apr 11. A pop above the Fib and the TL is what the bears need in order to make any headway.
 The currency front now signals the bears have the momentum. USDJPY is back below its SMA200 and the DXY has dropped back through the important .618.


 As mentioned above, CL and RB are getting a timely bounce this morning. But, CL merely backtested its SMA10 and is now settling lower as we come up on the opening bell.
 RB is an interesting case. The YoY range comparison for May would suggest higher prices in order to have minimal effect on CPI. If prices have indeed topped out here, it would imply that TPTB are trying to keep a lid on CPI, presumably to facilitate dovish Fed action. If it shoots on up to the 2.1-2.3 range, then the hawks are presumably in control.
 The most troubling development for bulls is the shape of the yield curve. The 2s10s has clearly broken out. If the 2Y, which has already completed and backtested a H&S Pattern, breaks down below the purple TL, we could see the 2s10s expand significantly — a prelude to many past equity corrections.


 UPDATE: 2:15 PM
More V-shaped rebound silliness…all thanks to VIX. 
 A close-up:
 The others are behaving themselves. This was almost all VIX.


 I have a lot of charts to finish up relating to the big picture but got hung up on some calls. I’ll have to finish this post tomorrow.
UPDATE: May 1, 10:30 AM
Bottom line, the Fed’s goal is to keep stocks on the rise with acceptably small corrections from time to time but without allowing (especially) mid- to long-term interest rates to increase above current levels for any extended period of time. This means they can permit the occasional pop up to 3% or even higher; but, better to keep them around 2 – 2.5%.
As time goes by and debt increases, this target will need to trend lower as it has in Japan and the EU. As we saw in 2018, they would like to have a higher base from which to lower rates in the event of another financial crisis. But, the stock market puked all over a 3.25% 10Y — so that’s no longer an option.
The trick to keeping interest rates low enough is keeping inflation low enough. Official CPI is a lie concocted to keep annual COL increases manageable and interest rates low. But, even using the official numbers, CPI crept up to just short of 3% last year as oil & gas prices rallied in an effort to keep stocks rising.
  Now that the trend has been broken and rates are declining again, the Fed has some breathing room. But, it has a problem. Because of the way CPI is calculated, it is perenially underreported — causing concern among Fed watchers that inflation is too low and that a more dovish stance is needed. If the expected rate cut isn’t delivered, the natives might just get restless. So, sooner or later, the rate cuts and QE will return.


 This is why I expect that the US will necessarily follow the path of the ECB and BOJ and gradually assume more and more control of the bond market, artificially depressing rates with the oft-heard justification that inflation needs to be higher.
The US chart…
 …vs Japan’s chart.
  Oil and gas will continue to be the go-to tool for affecting inflation. Note that RB is exactly where it was a year ago — the lower left-hand corner of the gray rectangle. Retail gas prices are, too.

![]()
 The only time we’ll see a big drop from any month in 2018 to the same month in 2019 is when there’s a desire to bring CPI down a notch — as in Jan and Feb when the administration was bitching about the Fed not being accommodative enough.
 And, here’s the problem. While the Fed can control interest rates to some extent, the administration has the ability to jawbone and negotiate lower oil and gas prices. In other words, it should ultimately get lower CPI — which would put pressure on the Fed to be move dovish.
I need to take a break to celebrate my better half’s birthday. I’ll finish this up in the morning if not sooner.