Yesterday’s setup for the e-minis looked pretty straightforward: a drop through the 200-day moving average and backtest of the 2.24 Fibonacci extension at 2729. Futures had already dropped through the 200-DMA and were heading south when the dismal retail sales data dropped.
I hedged my bet, redrawing our daily downside target to include the 10-DMA — just a few points below the Fib extension. Fifteen minutes into the session, as ES reached 2730.25, the headlines started dribbling in. Fed Governor Lael Brainard publicly commented that QT should end this year, ahead of schedule. Larry Kudlow commented that there was a glitch in the retail sales data. Mnuchin felt all warm and fuzzy about the trade talks.
Faster than you could say “Plunge Protection Team” ES reversed course and SPX closed the day with a gain. But, the move didn’t feel finished. As I wrote at the end of the day:
ES looks likely to test its SMA200 all over again. But, will it make it on down to the 2.24? Its SMA10 will probably be up to 2728 by tomorrow morning, adding additional support.
I guess the market fairies were listening, because that’s exactly what happened overnight. ES dipped to 2729 right as the SMA10 was arriving on the scene, then spurted 27 points higher — breaking out of the falling white channel in the process. The algos are in full support mode at present, though a few charts suggest a pop and drop is in the cards if VIX doesn’t pull off a game changing plunge.
continued for members…USDJPY, in particular, has backtested the (now) broken purple TL we discussed yesterday.
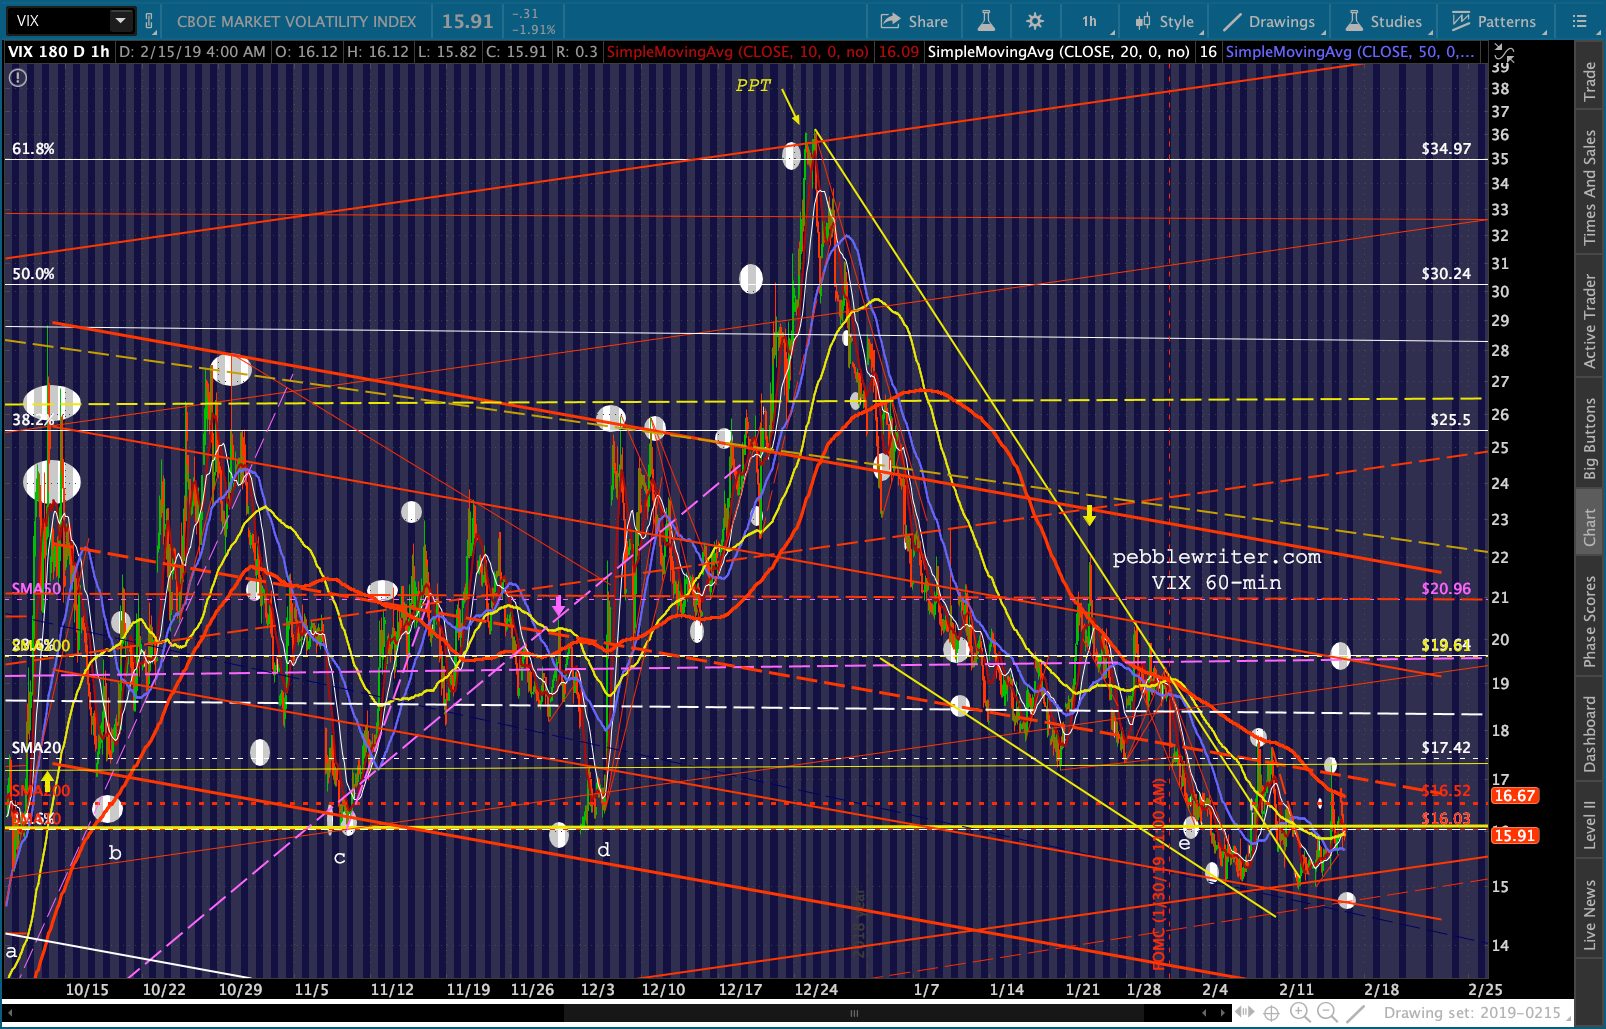
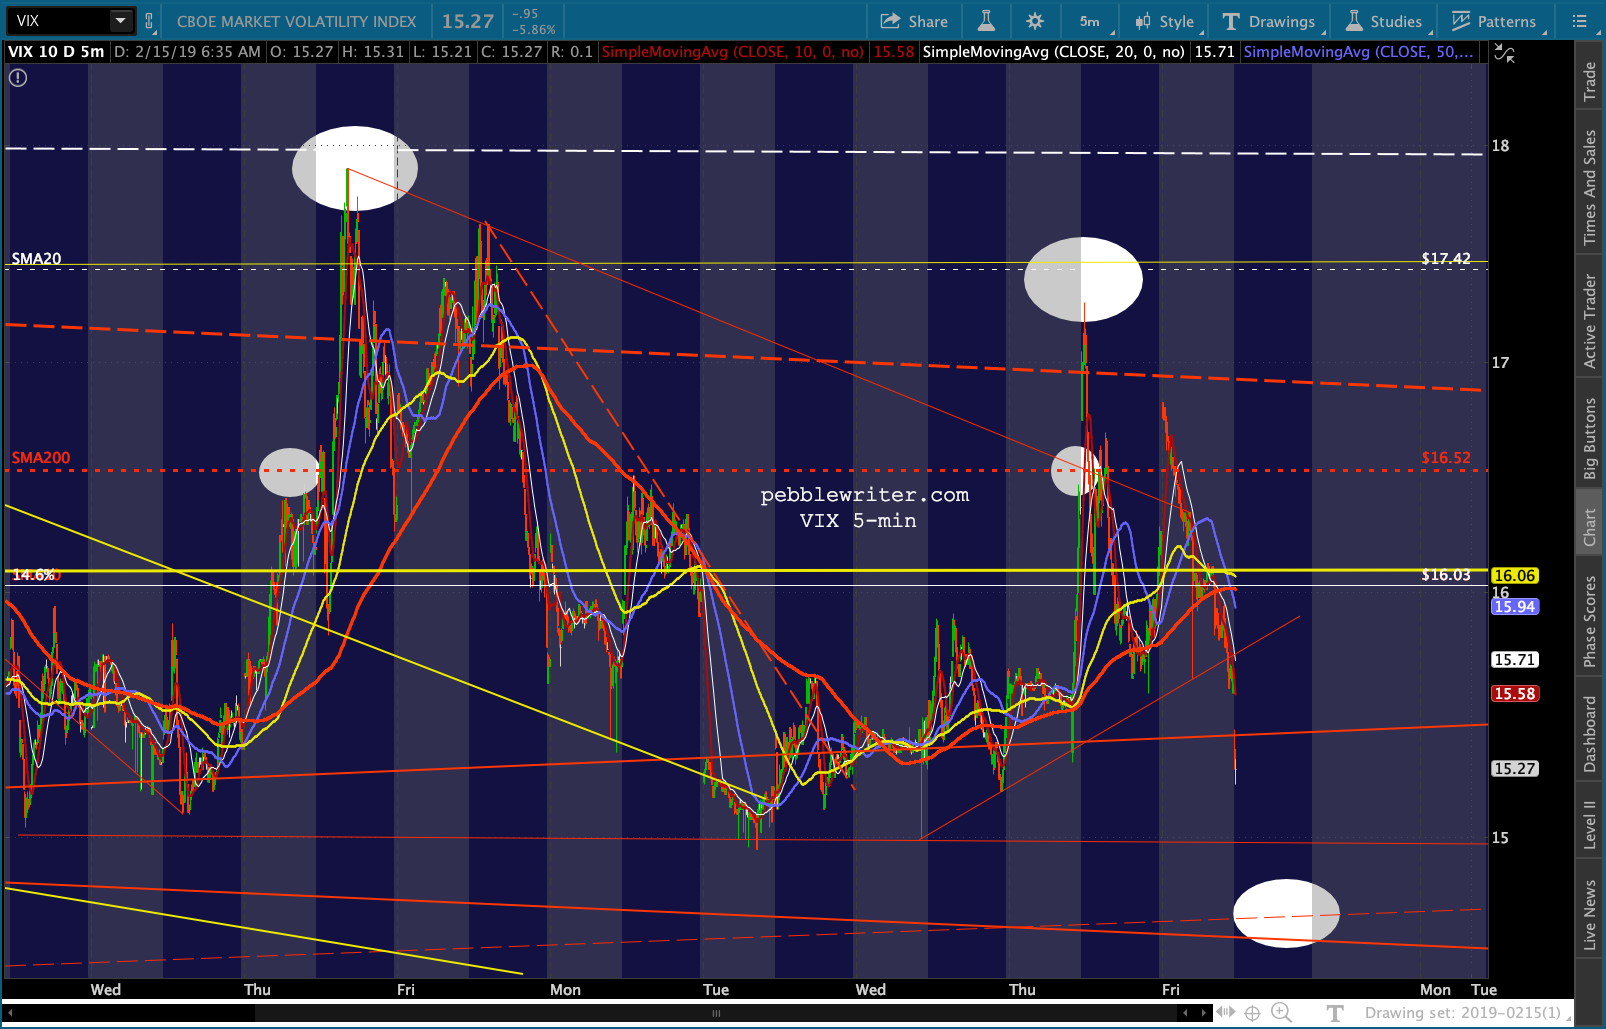
 VIX is headed toward a TL of support which might or might not hold.
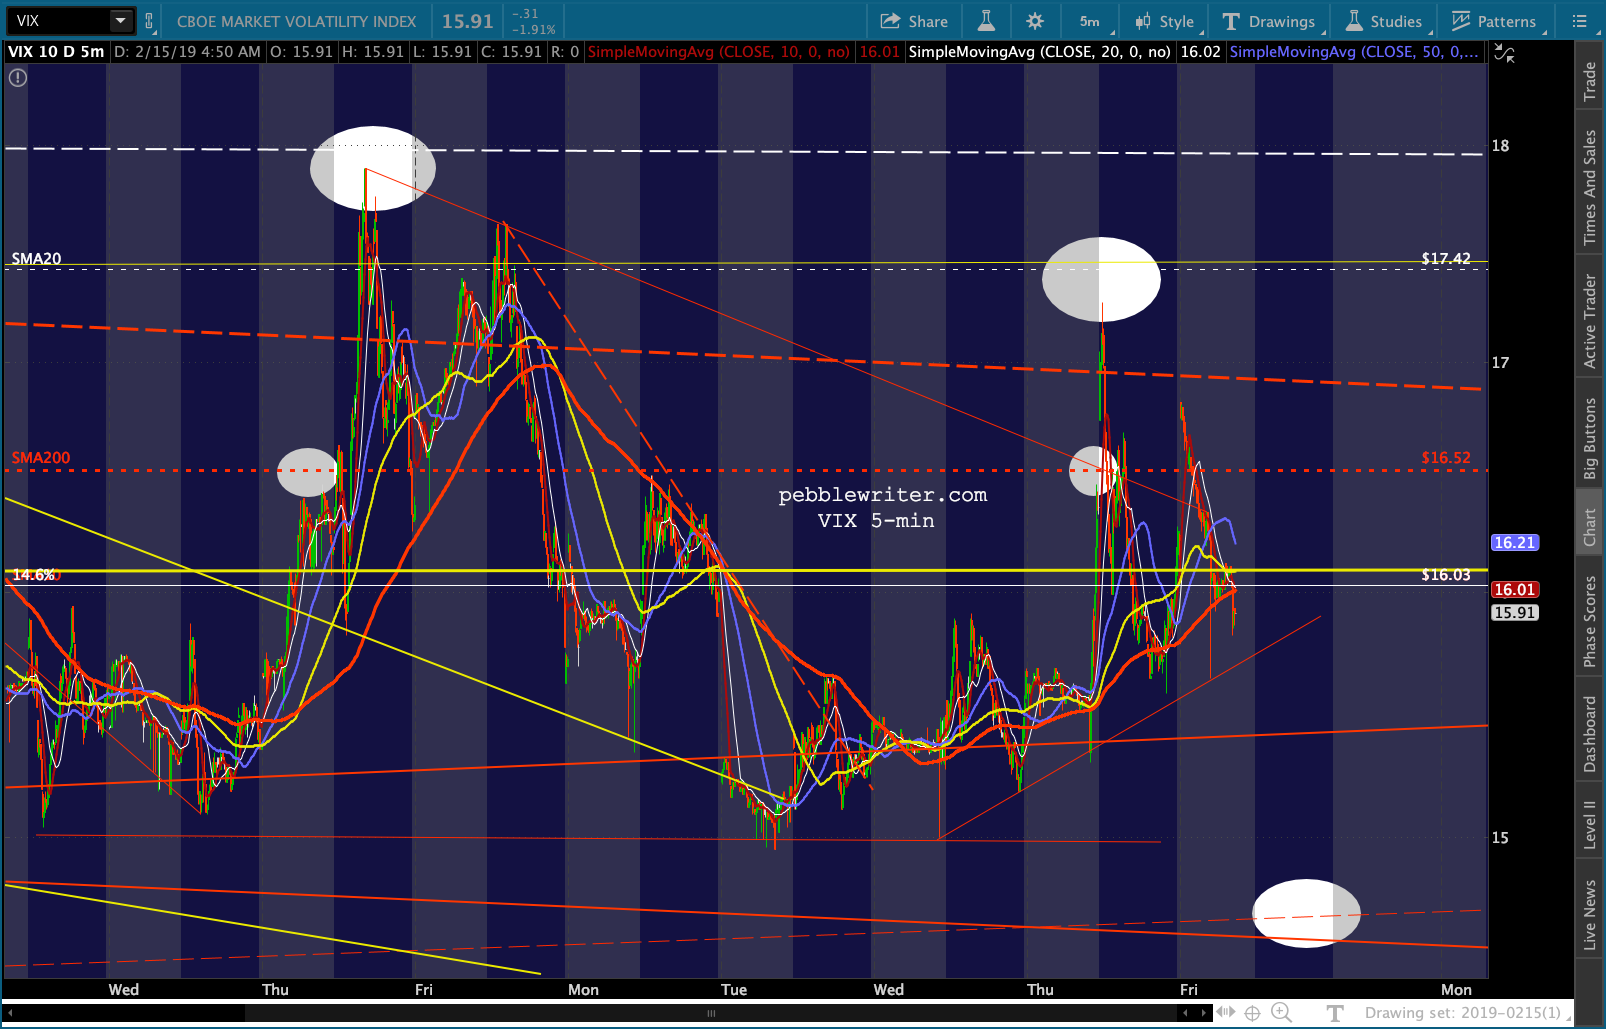
 And, CL and RB are nearing their upside targets.
 Note that we have two targets for RB. The primary one is at 1.5456 — the C=A of the first wave from Dec 24 to Jan 18. The secondary one is 1.5545, the more recent C=A and closer to the approaching SMA100, currently at 1.585.
 Even DXY seems likely to fall back here at the white channel midline and do some backtesting before weighing a run up to 97.873.
 COMP remains a conundrum, not helped at all by the recent earnings misses in tech. Its SMA200 remains untagged at 7463.91. This, I believe, is today’s primary goal for TPTB.
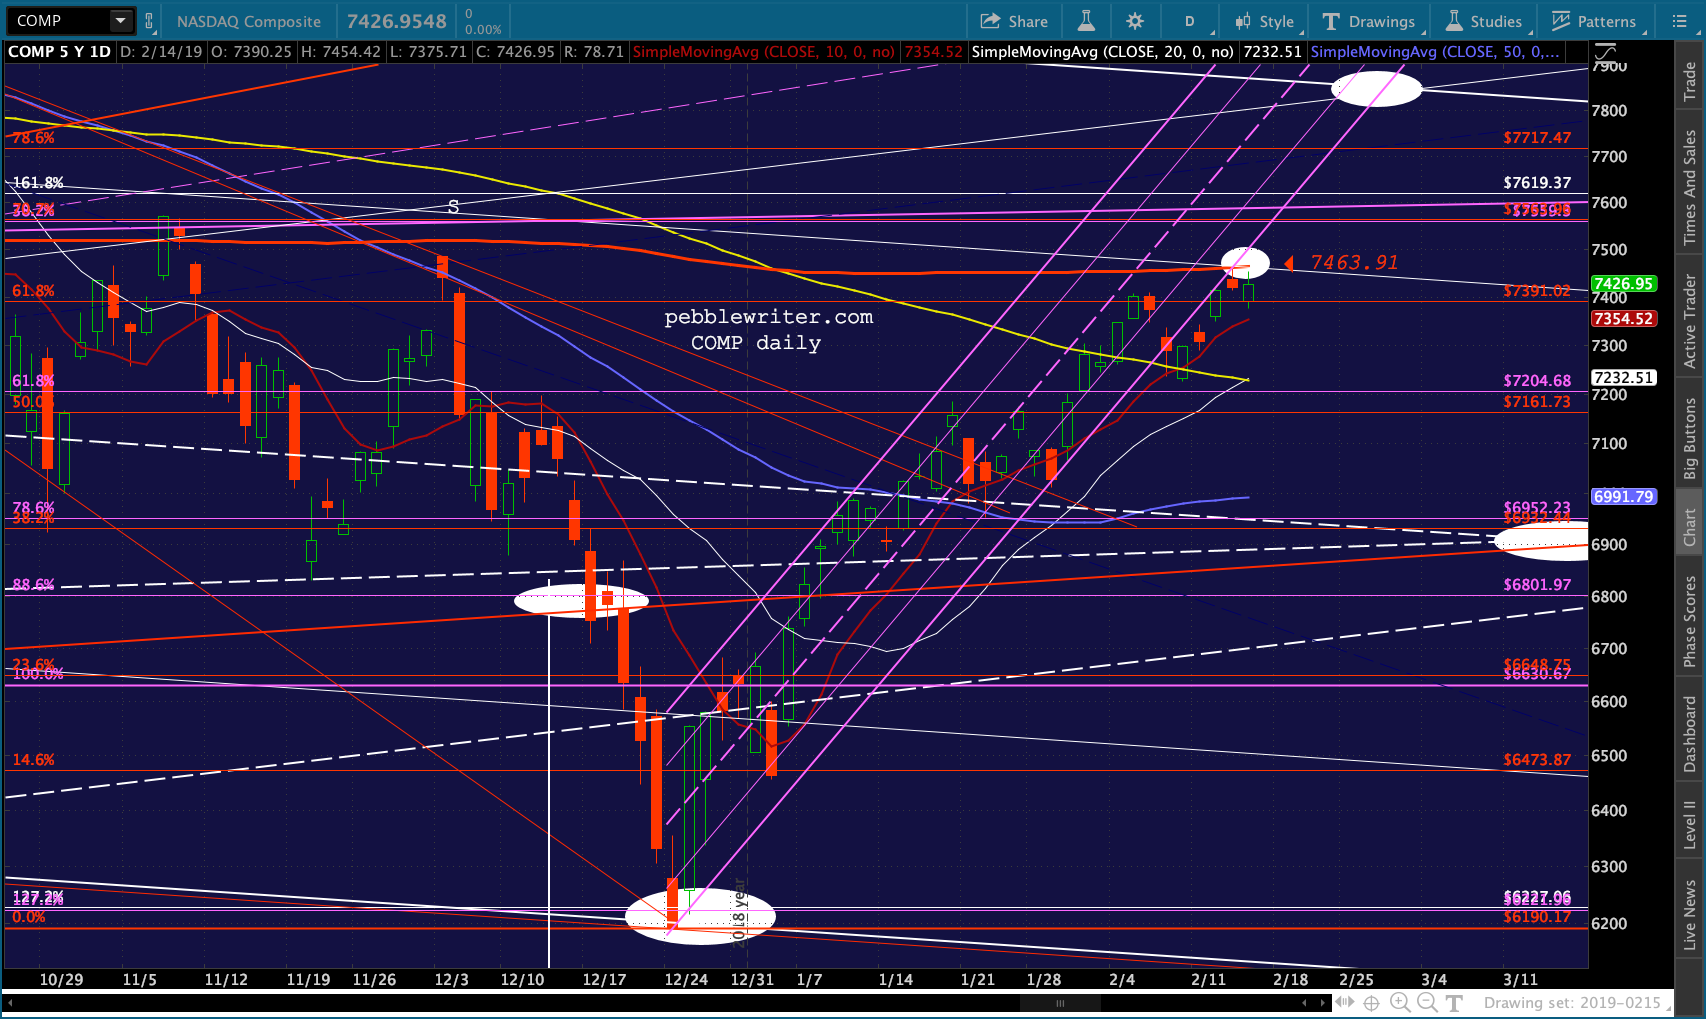 Note that AAPL is back to its channel midline – decision time.
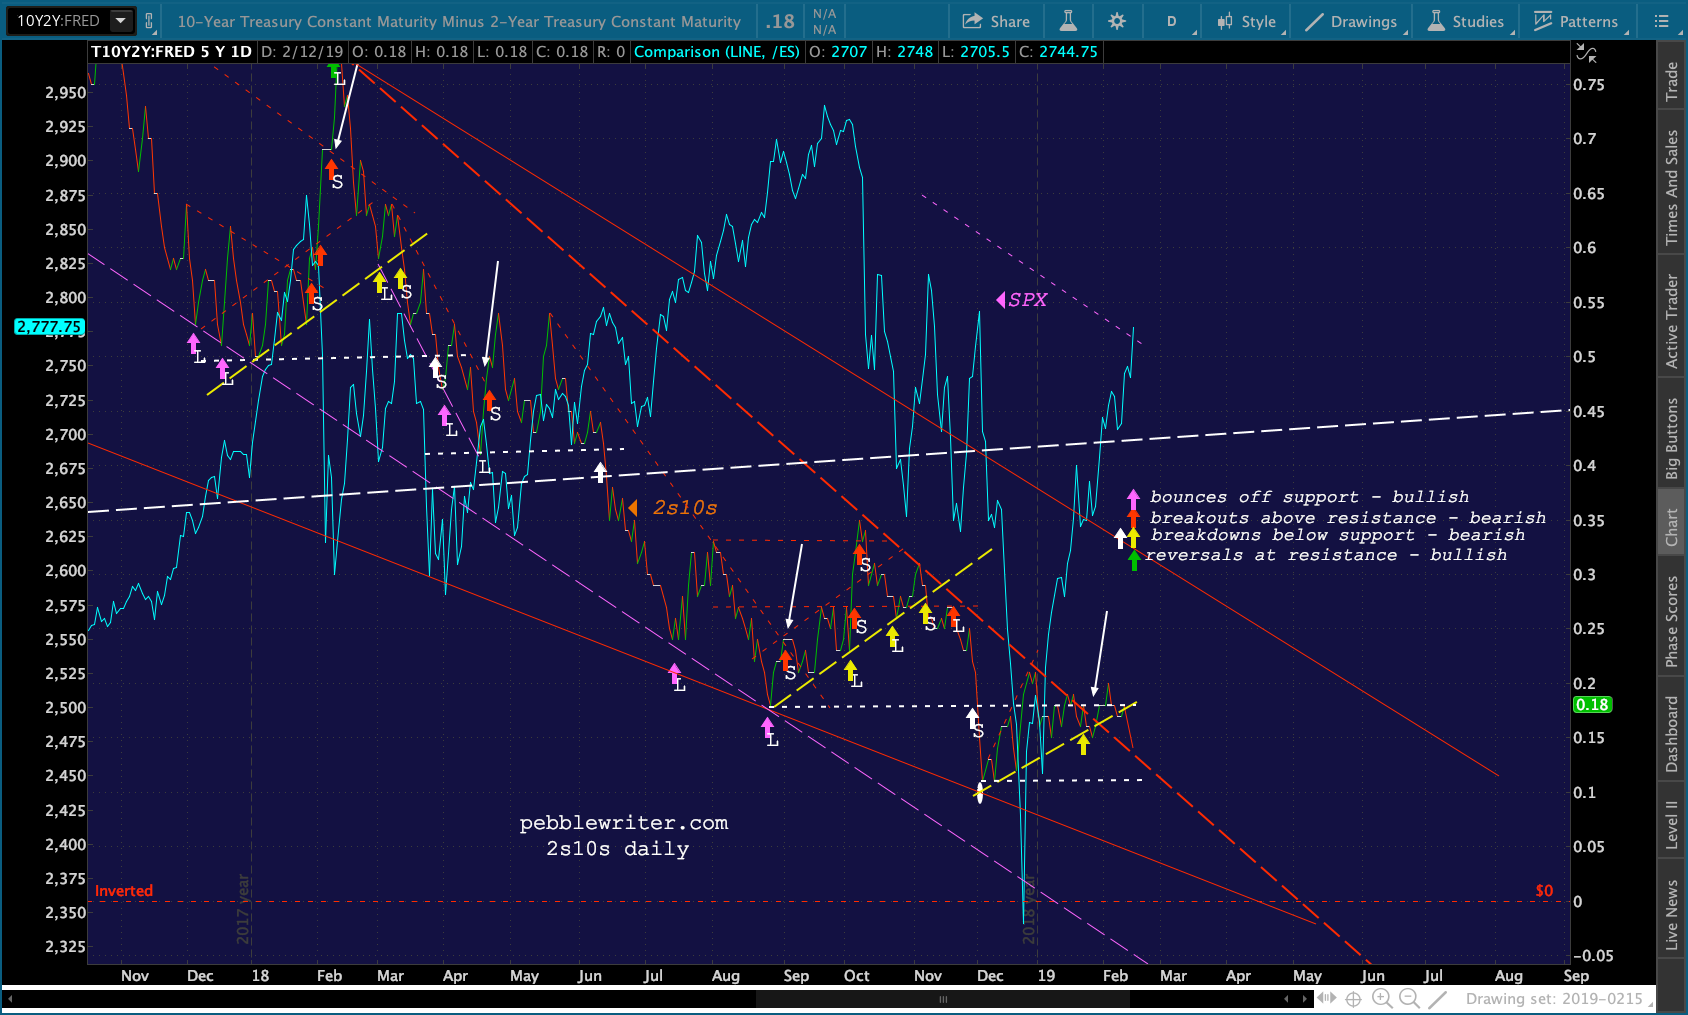
  And, our yield curve model remains resolutely bearish.
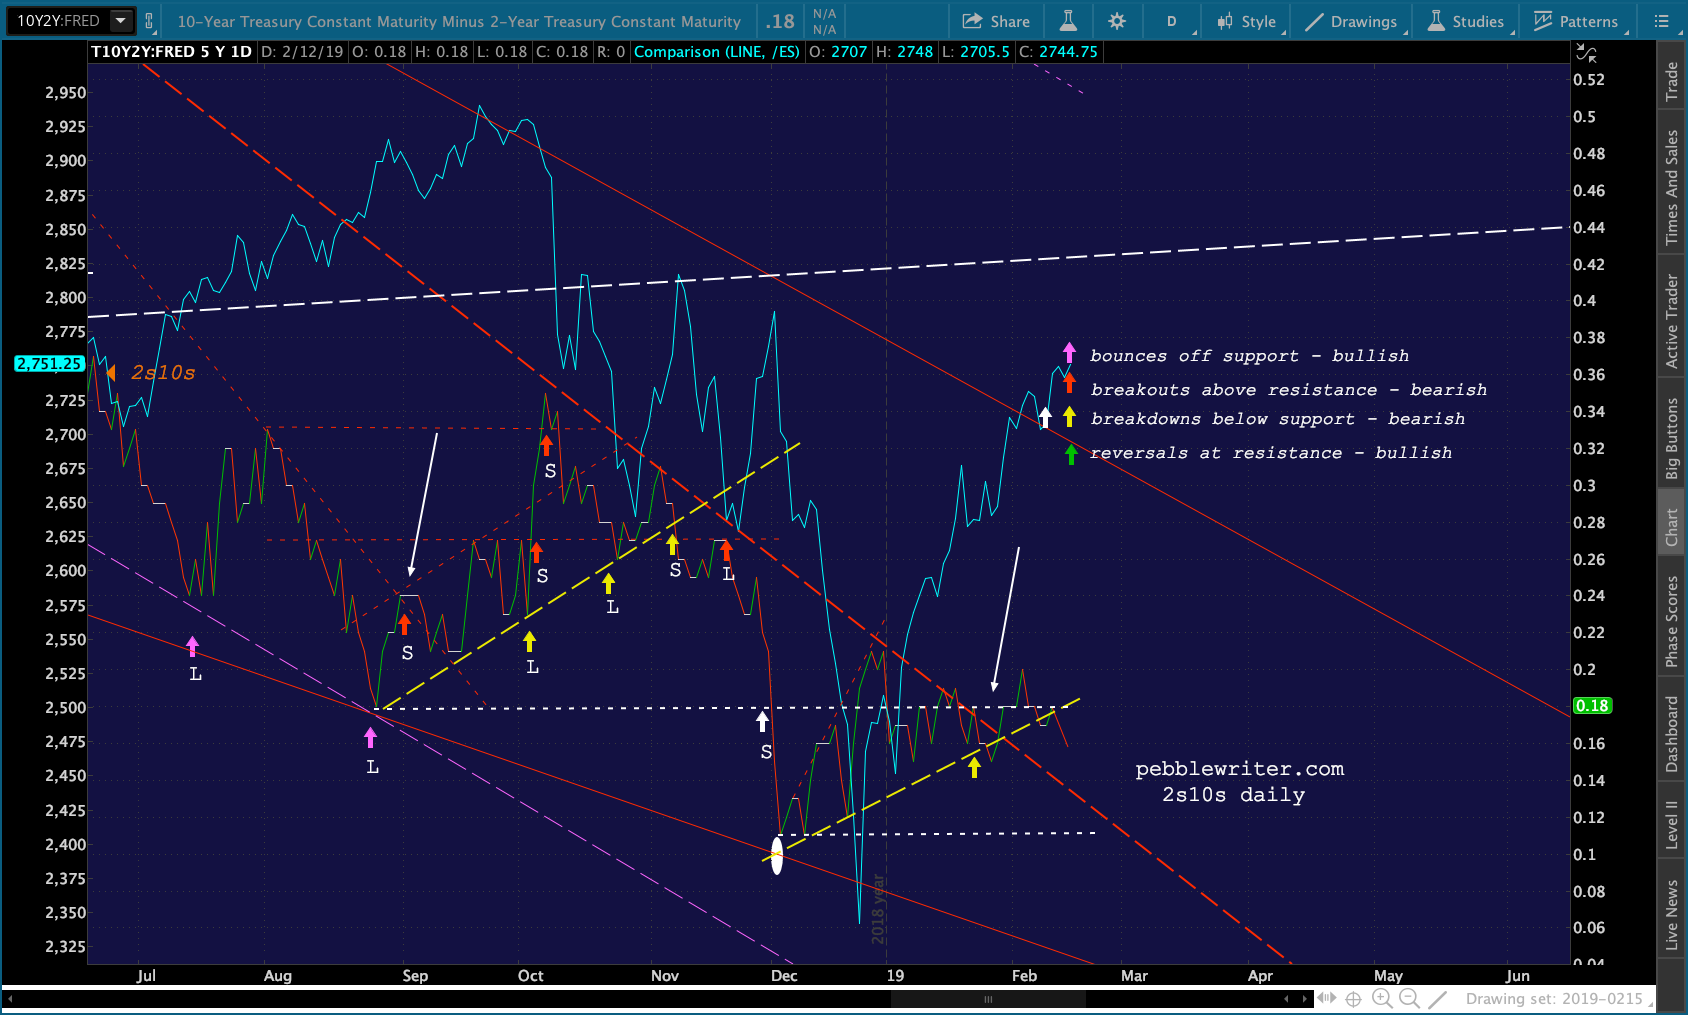


 Put it all together, and we’re still focused on VIX as the potential game changer. If its channel breaks down, we’re likely looking at new highs. Otherwise, batten down the hatches.
 SPX should reach the channel top on the open. If it’s able to keep its momentum going (VIX breaks down) then the next target is the .707 at 2766.77.
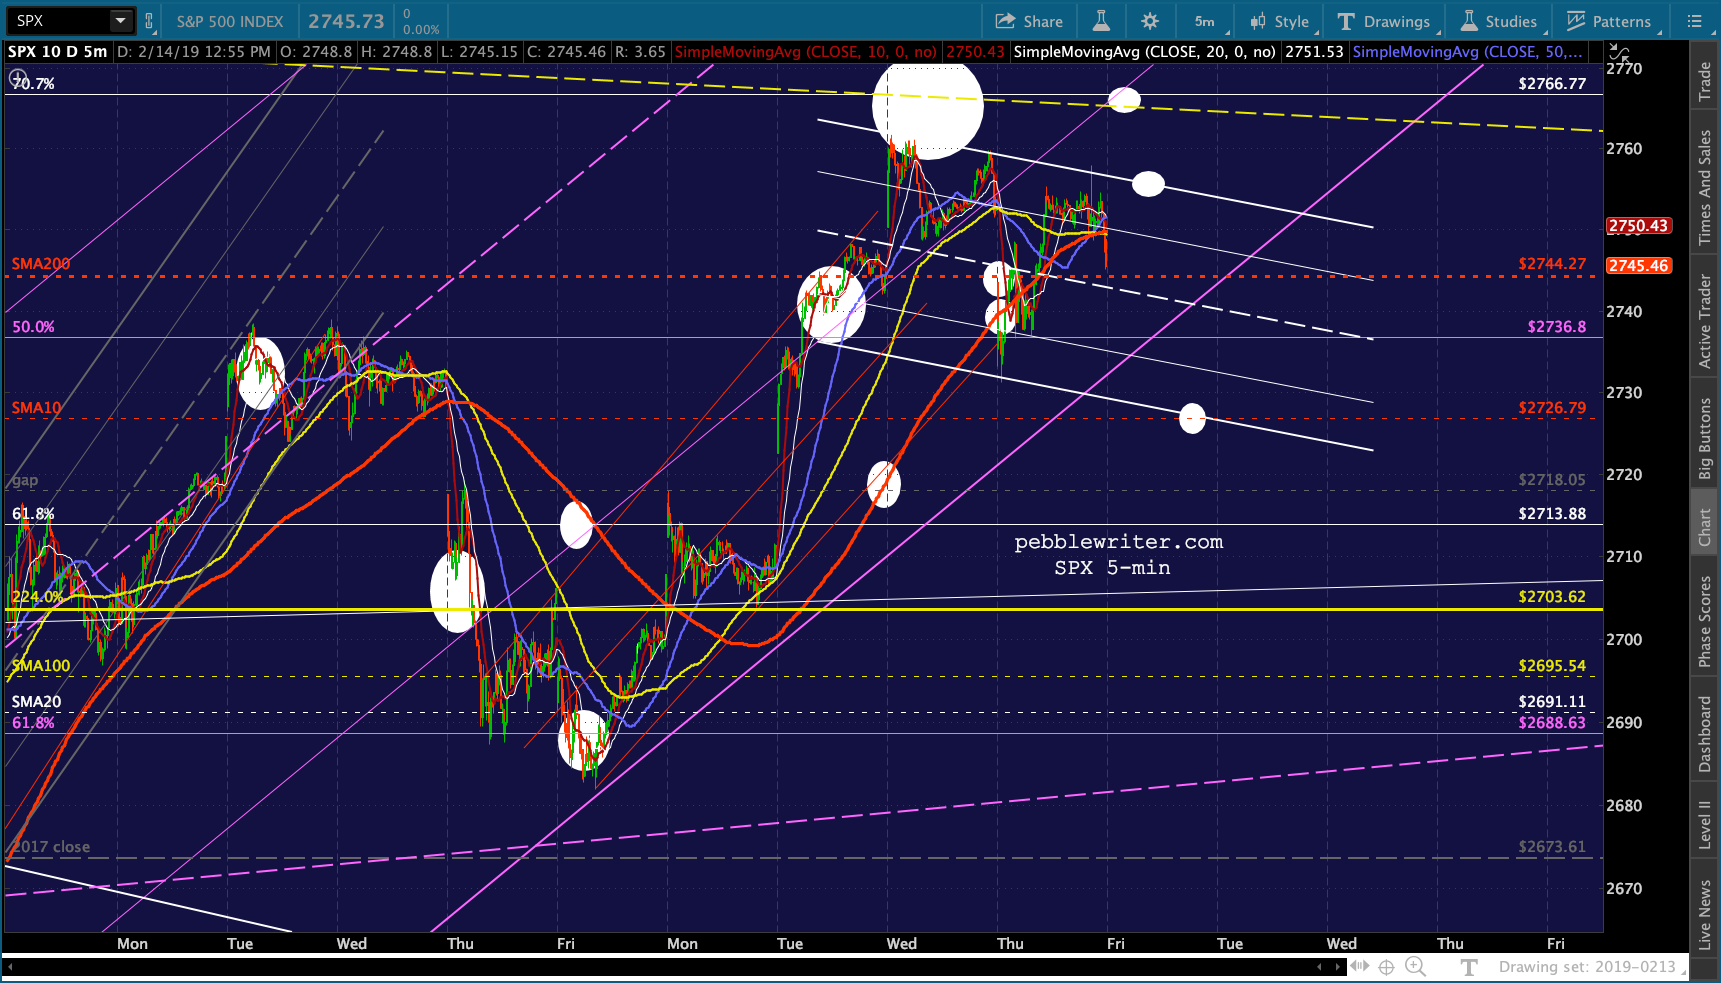 After that, our upside targets are as detailed yesterday.
 But, the key will be VIX and its support at 15.70, 15.00 and, finally, 14.70. A lasting drop below 14.70 means the channel is breaking down and the bulls are back in charge. But, for now at least, my gut tells me a pop and drop is the more likely scenario.
I’d consider shorting when the targets are reached, but with sensible stops in case we get the usual 3-day weekend nonsense.
UPDATE: 9:35 AM
Most of the target were just tagged or are about to be. Decision time all around…


As I mentioned yesterday, I’ll be out for the remainder of the day — though I might have a chance to post before the close this afternoon.
GLTA.
UPDATE: EOD
RB reached 1.5768, surpassing both our wave targets and coming quite close to the SMA100 (1.5855.) In the process, reached the purple channel top and the yellow channel midline, so I’d be comfortable shorting here with stops at the SMA100, currently around 1.58ish.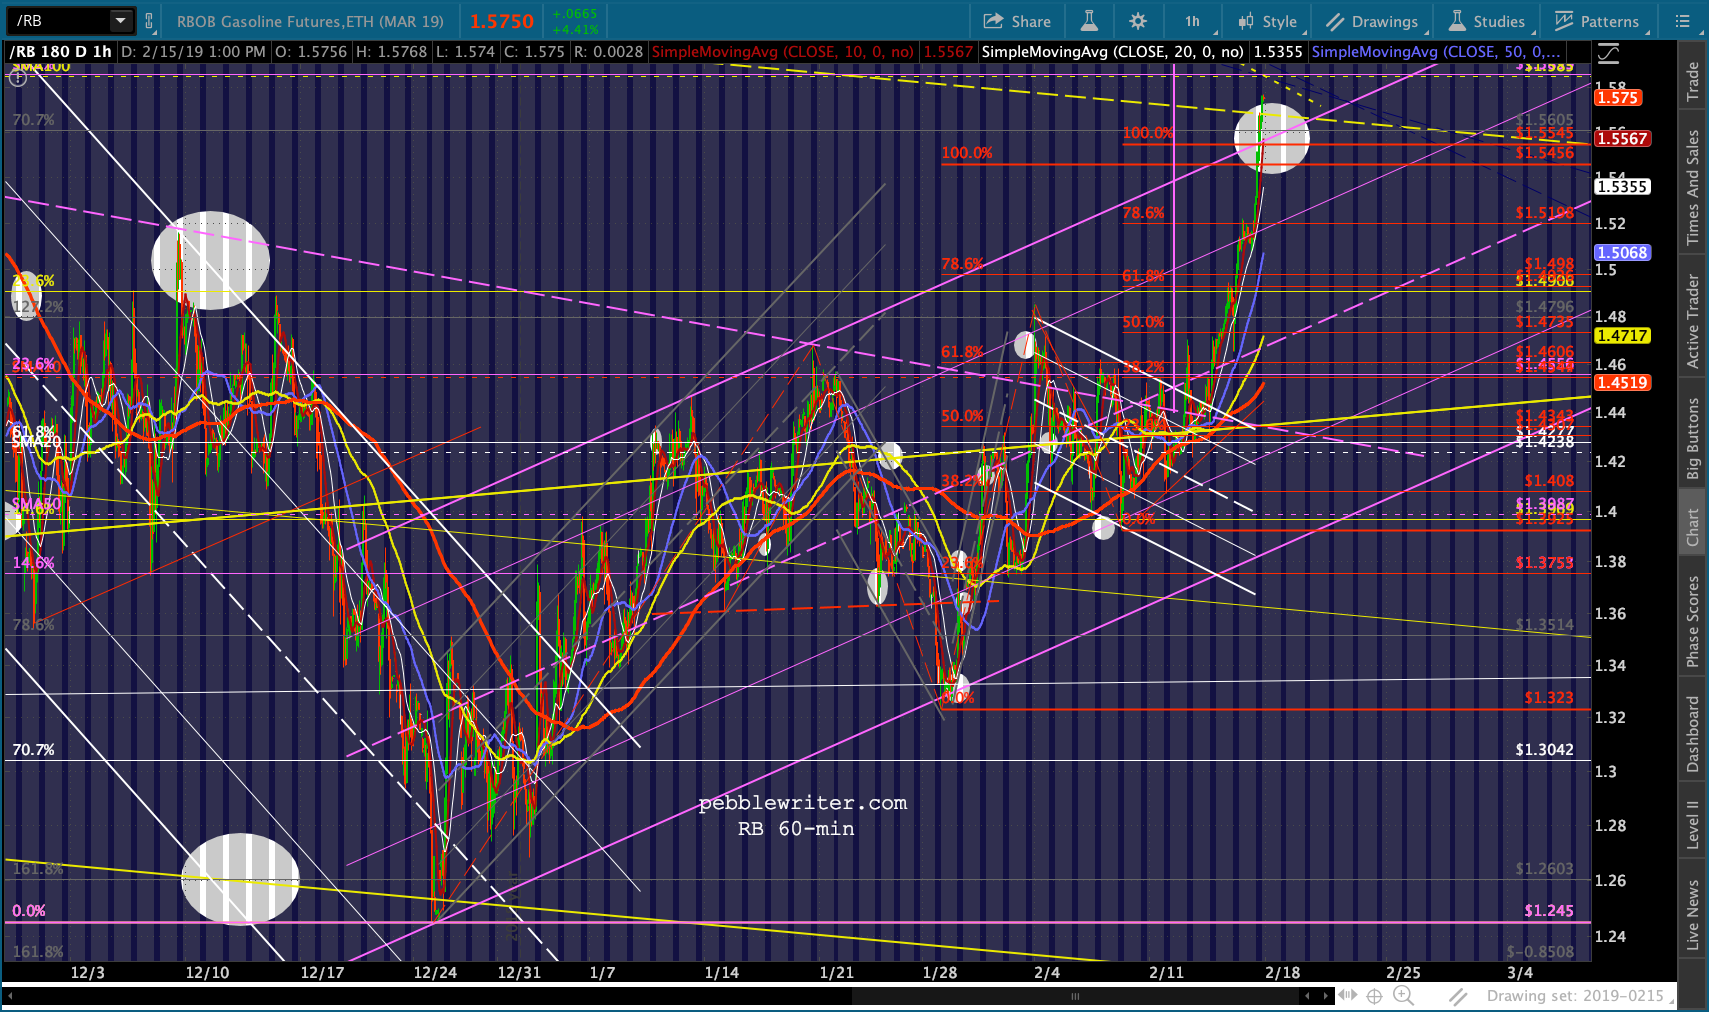 CL probably has a little further to go, with the range of 57.23-57.62 the most likely target.
 COMP closed very slightly above its new SMA200. This might be all it needed to run a bunch of stops. We’ll see what happens over the weekend.
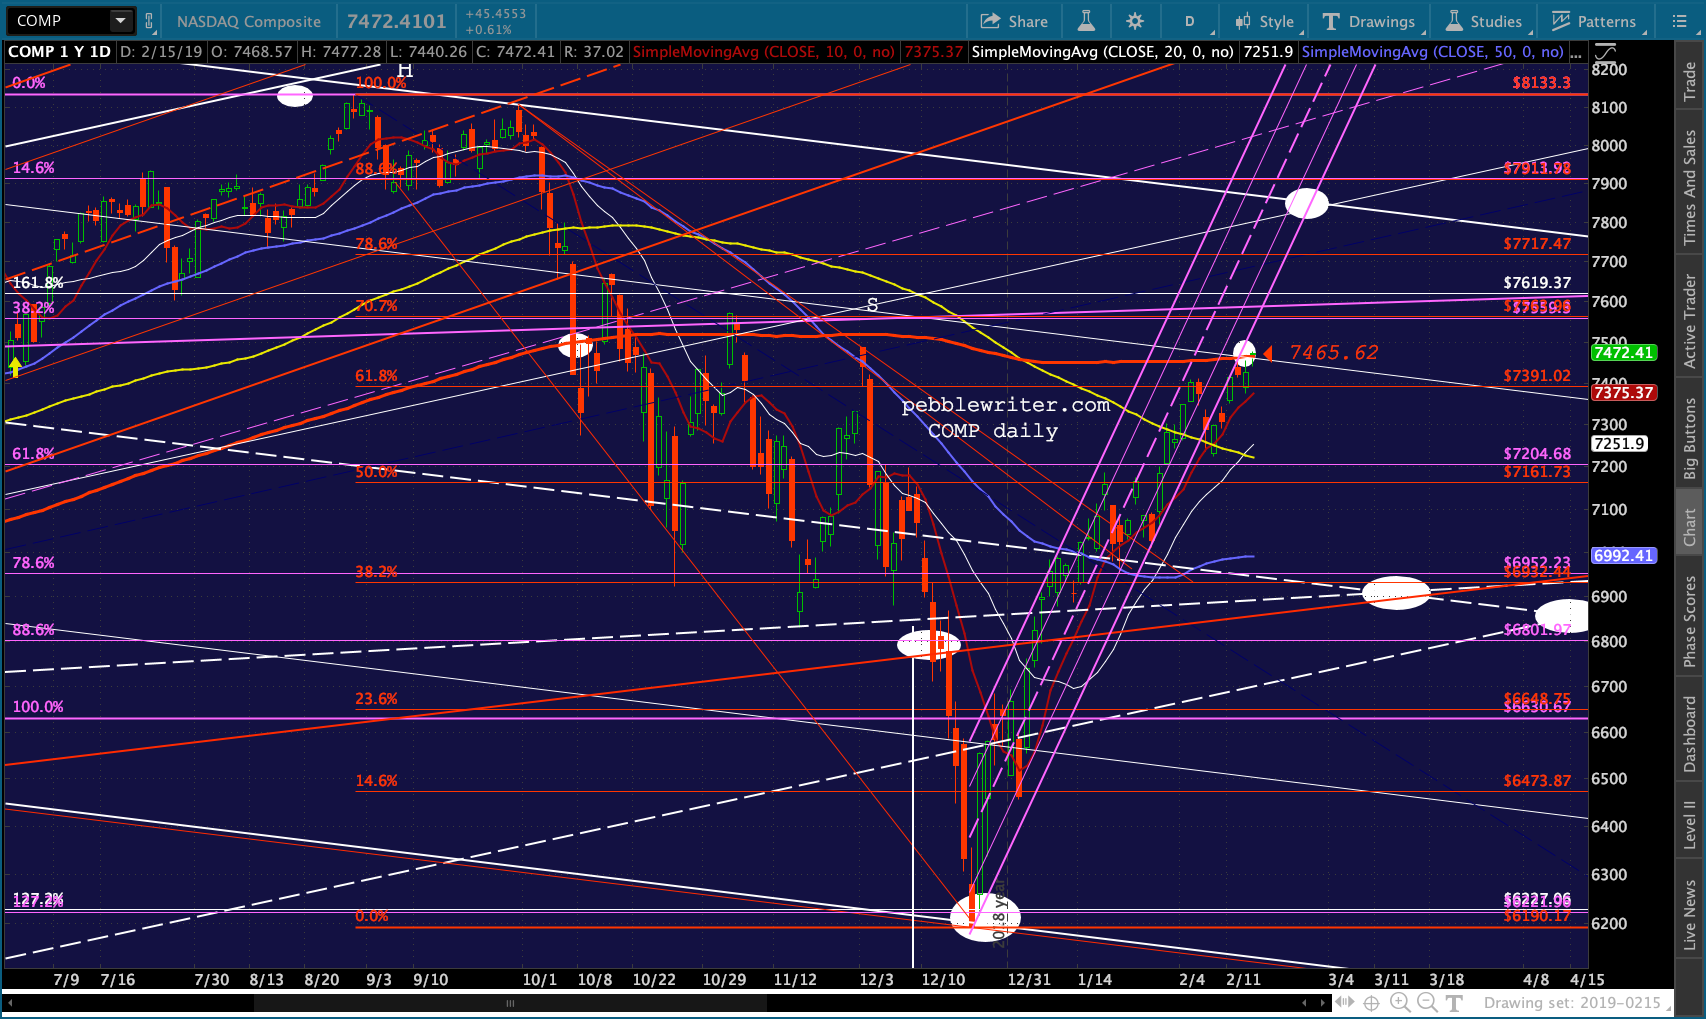
 Likewise, SPX and ES ended in a strange place — about 7-8 points below the next significant resistance.

 The reason there’s so much uncertainty is that VIX stuck its landing. Members will recall this dashed line connects the lows on two prior occasions and is almost precisely the line in the sand between a rebound and a breakdown.
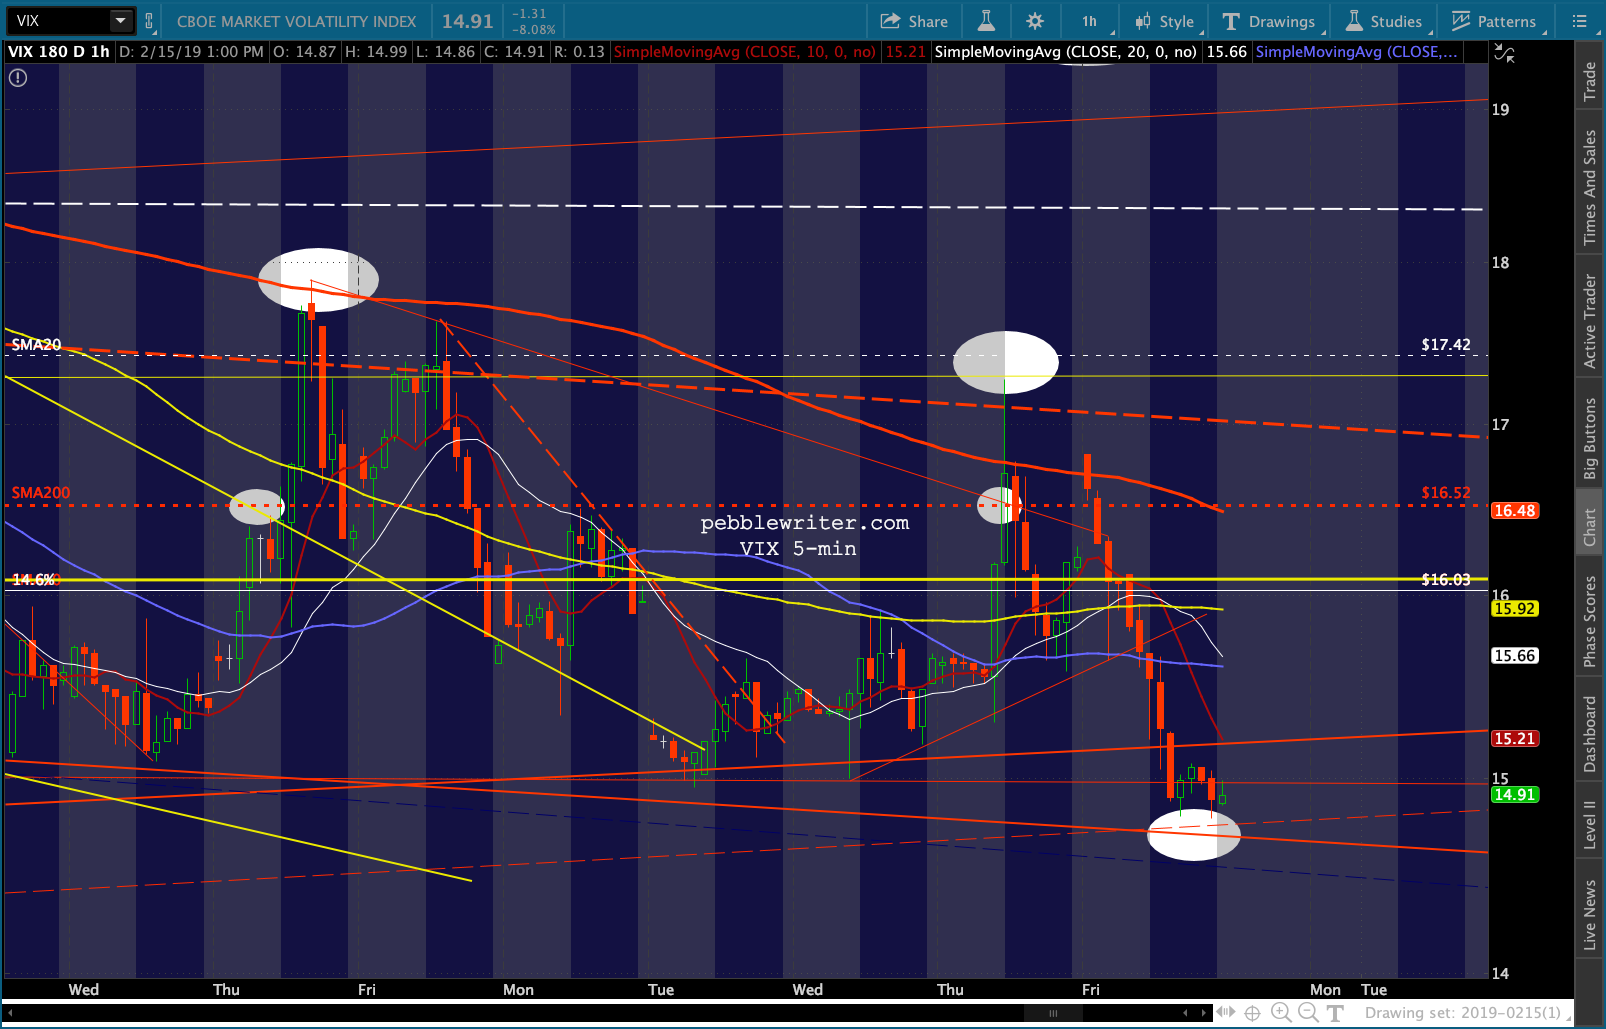 The daily picture shows that a disastrous decline in stocks would have to unfold quickly in order for it to jibe with VIX’s chart.
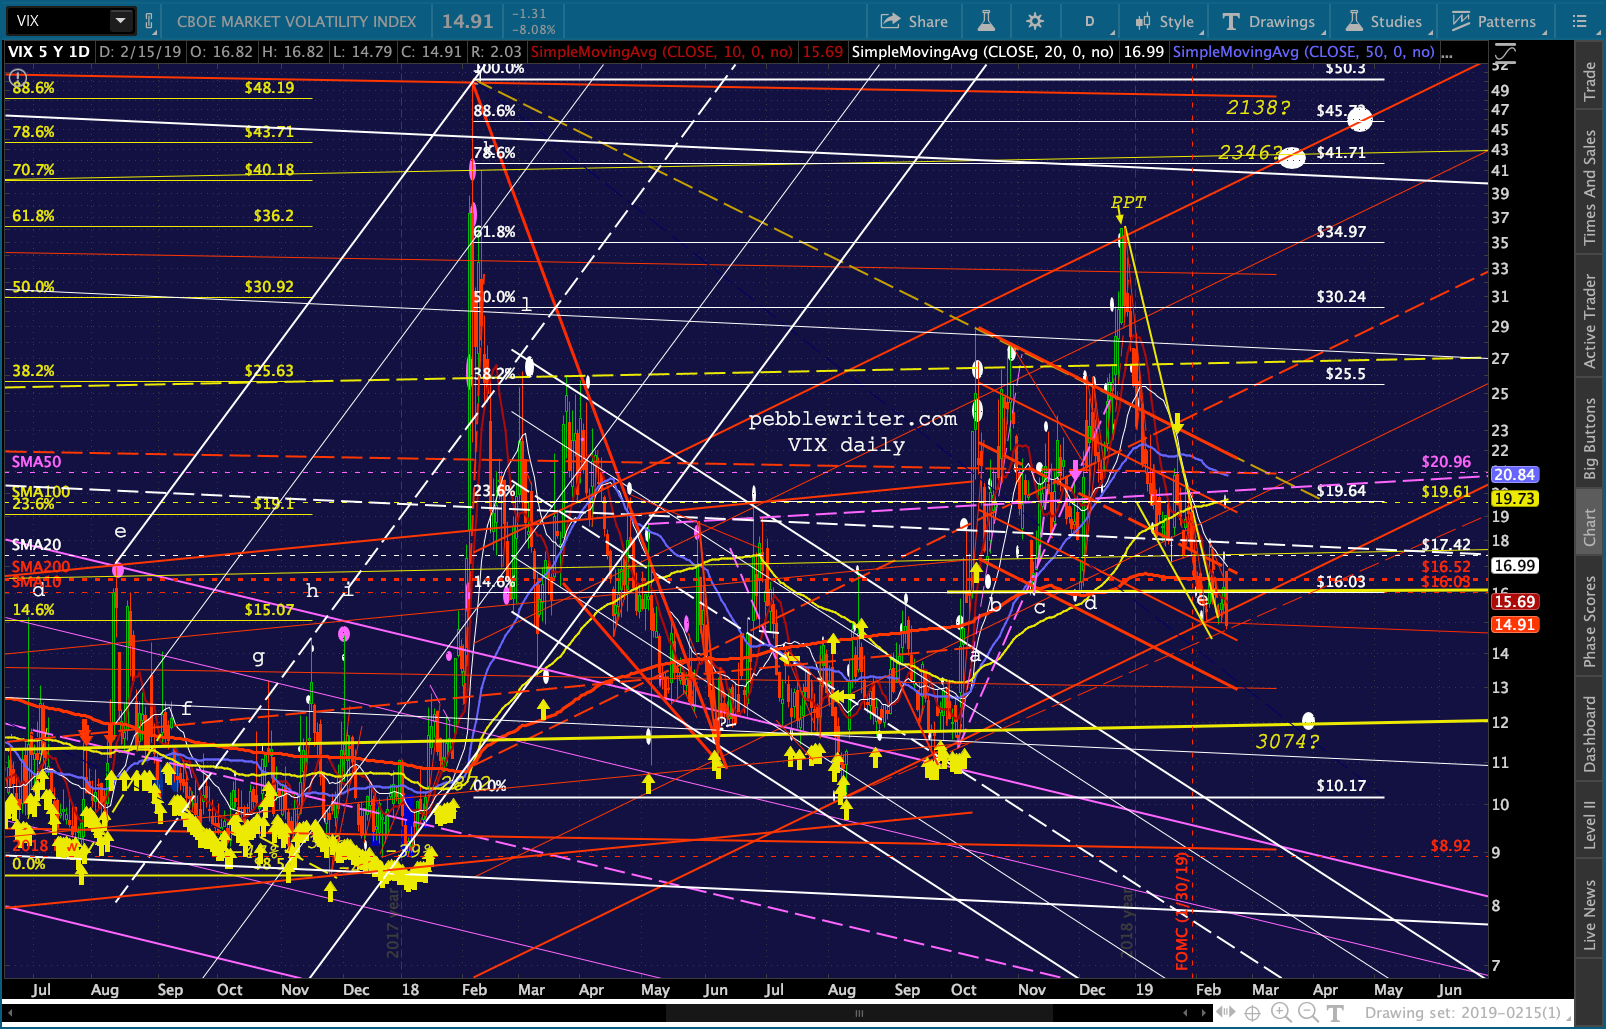 As we’ve discussed, there is also an excellent opportunity for VIX to break down and drive SPX to new highs. Again, we should find out in the next few days.
Last, our yield curve model is still pegged on bearish. It hasn’t let us down yet.