

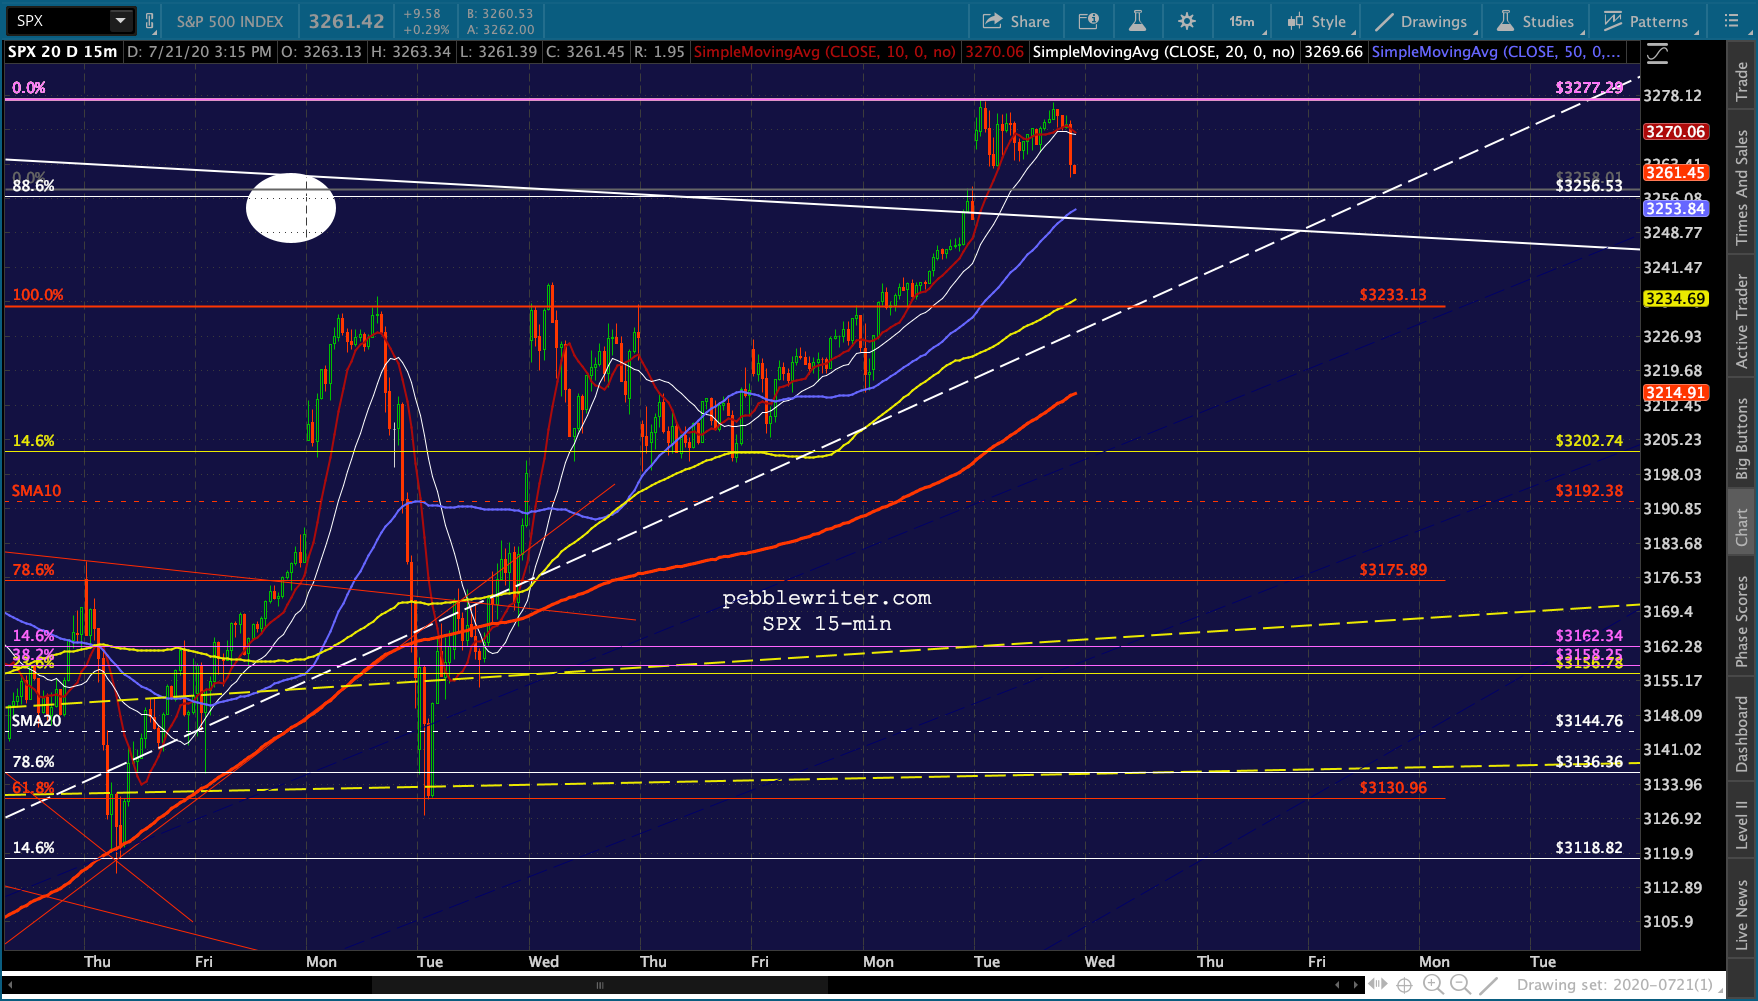
SPX reached our Fibonacci .886 retracement target yesterday. It’s a level I never imagined seeing after stocks reached important support back on March 23. But, then, I never imagined $5 trillion in liquidity – equal to the nation’s Q2 economic output according to the Atlanta Fed – being pumped into the economy in the second quarter.
 We’ve always known there would be a fundamental battle between another round of QE (remember when Powell insisted it wasn’t QE?) and the realities of the worst pandemic in over 100 years, spawning unemployment that would exceed the GFC and deaths in the hundreds of thousands if not millions. But, this market cares little about fundamentals. It cares about liquidity and a steady diet of the right signals being fed to the algos.
Central bankers and governments have delivered on both counts – with WTI having risen $59/barrel and VIX plunging 72% and with liquidity injections purportedly intended to bolster employment which, in many cases, went into stock buybacks.
Nevertheless, here we are. In Harmonics, the .886 Fib represents an 88.6% retracement, or rebound, of a significant drop. It’s typically as large a rebound as you’ll see unless stocks test their former highs (a potential double top) or push past them to new highs. Unfortunately, it’s not always clear cut.
In May 2015, SPX tumbled 12.5% after coming within 3.32 points of our 2138.04 target. By Nov 2, it had retraced 88.6% of those losses, at which point we looked for a pullback. Instead, it spent the next several sessions pushing above the .886, no doubt stopping out plenty of shorts before finally succumbing and making new lows – the 1.272 Fib extension at 1823.42. With the pandemic picking up steam – at least in the US and many lesser developed countries – the fundamental picture is looking iffy at best. The technical picture, on the other hand, is flashing plenty of warning signals. Can we count on it mattering?
continued for members…
A couple of other charts regarding the 2015-2016 correction… Note that the original red channel took a long time to get started. The May highs actually fit the channel midline rather than the top. 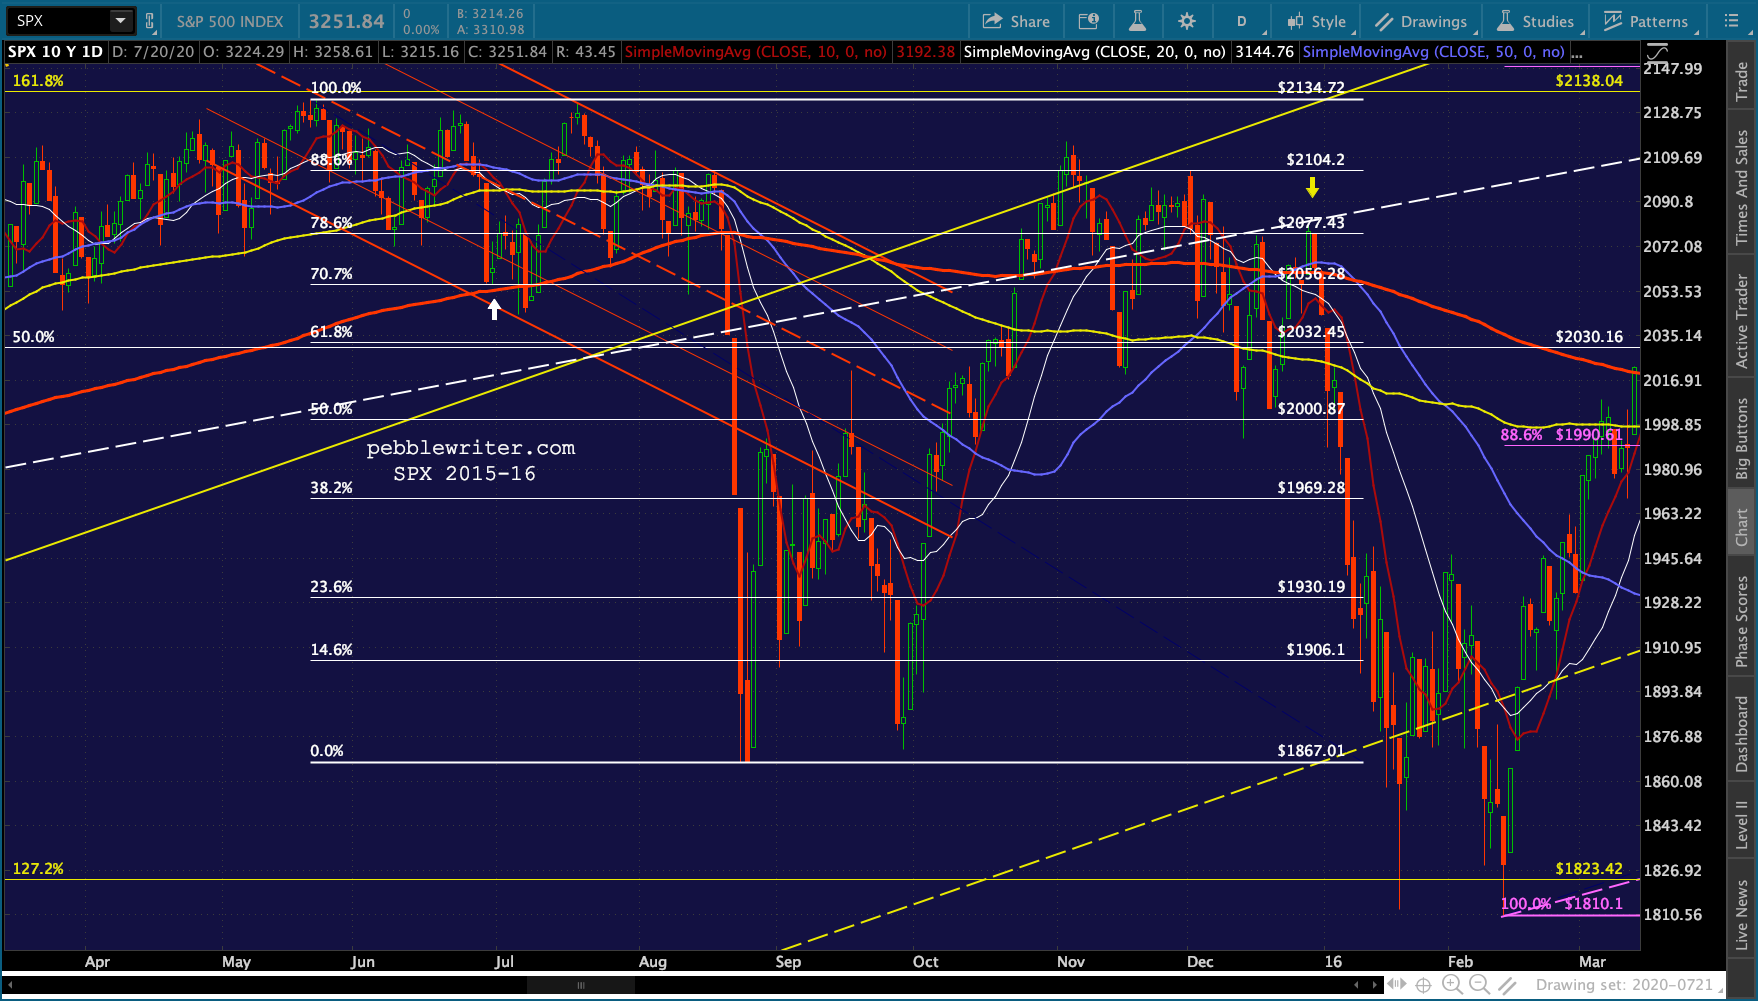 And, once it got started, the channel quickly broke down in favor of a much larger one which accommodated lower lows and higher highs than the red channel could handle. Even the white channel which took its place couldn’t contain the Nov highs.
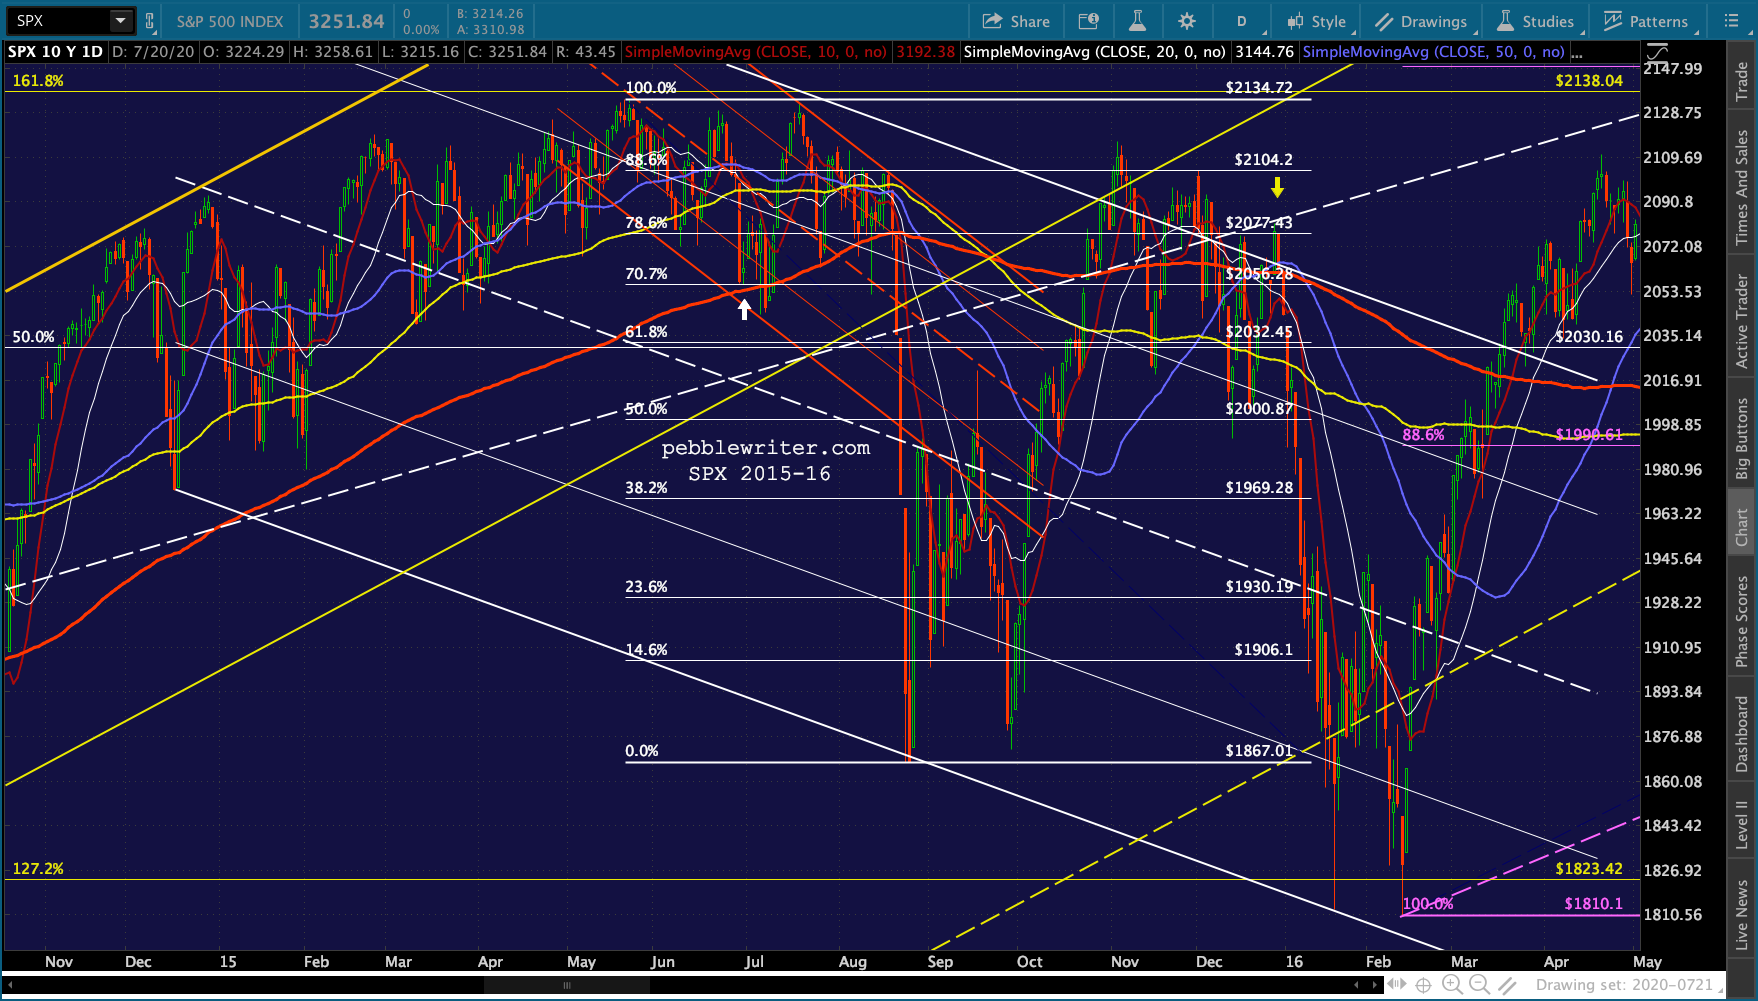 In the end, it was the 1.618 and 1.272 Fibs and the rising yellow channel that mattered. And, as we saw in March, the yellow channel’s breakdown didn’t end up mattering.
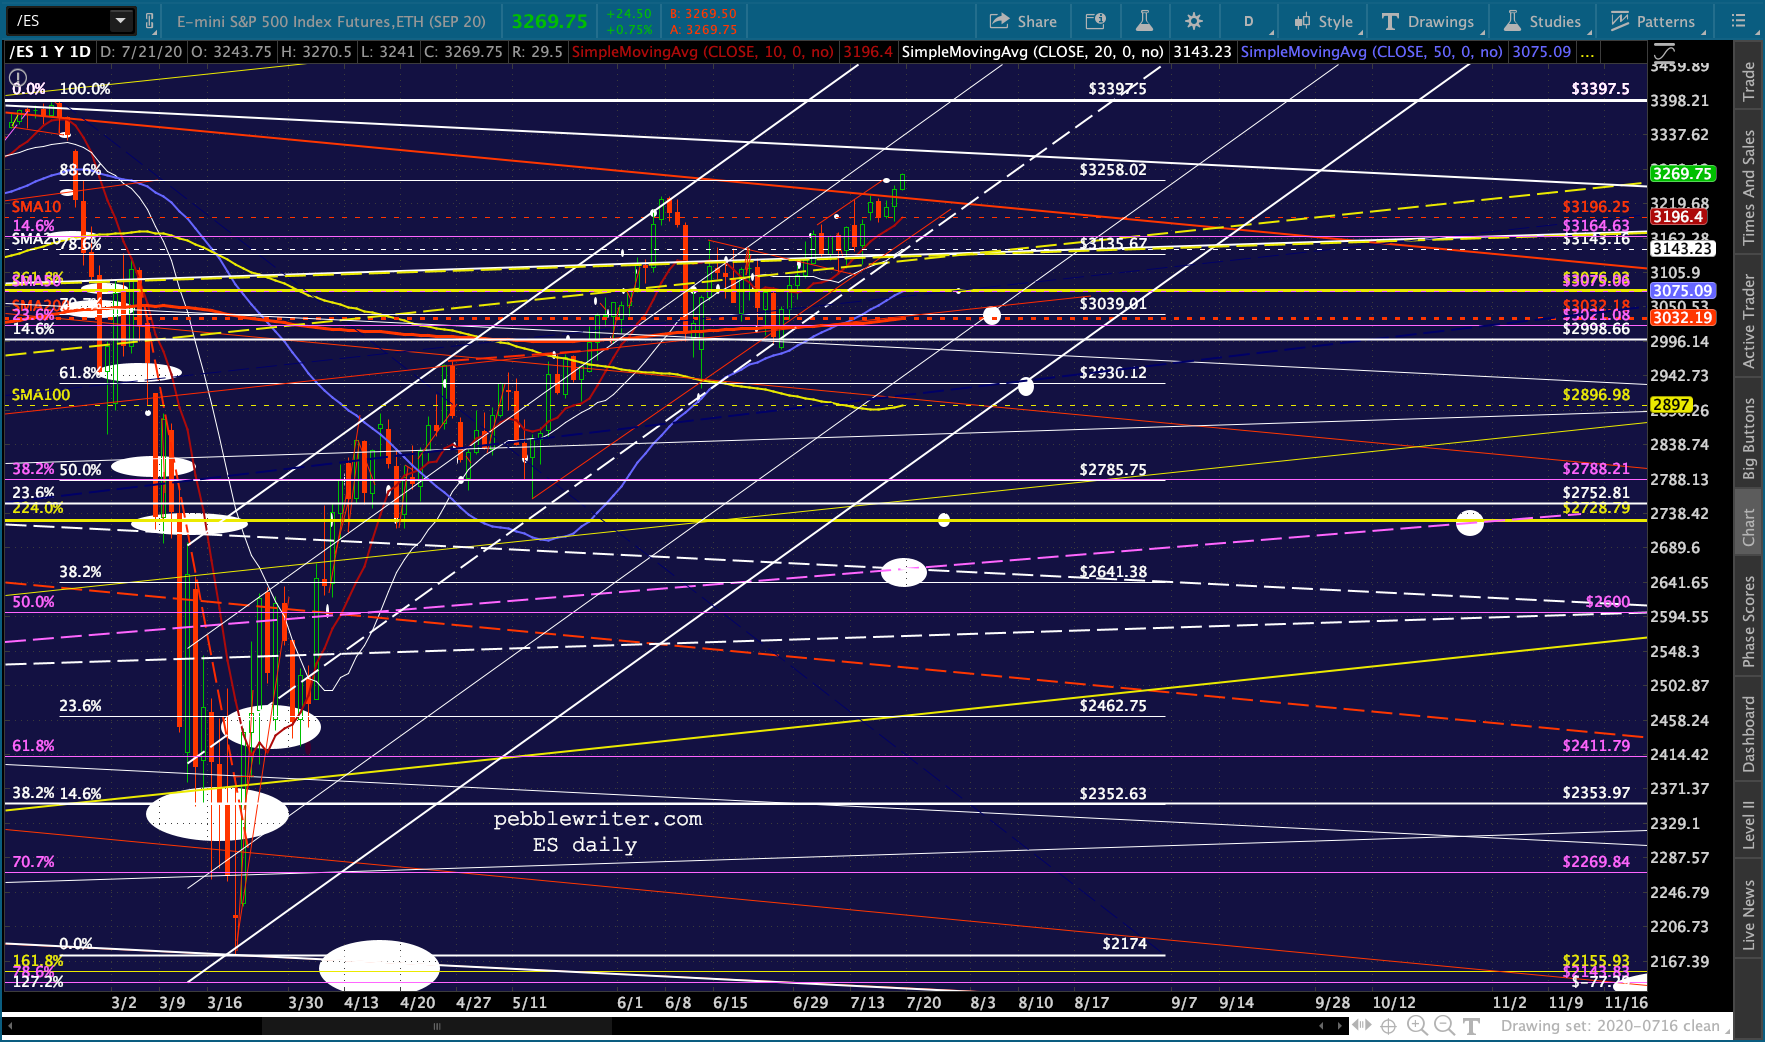
 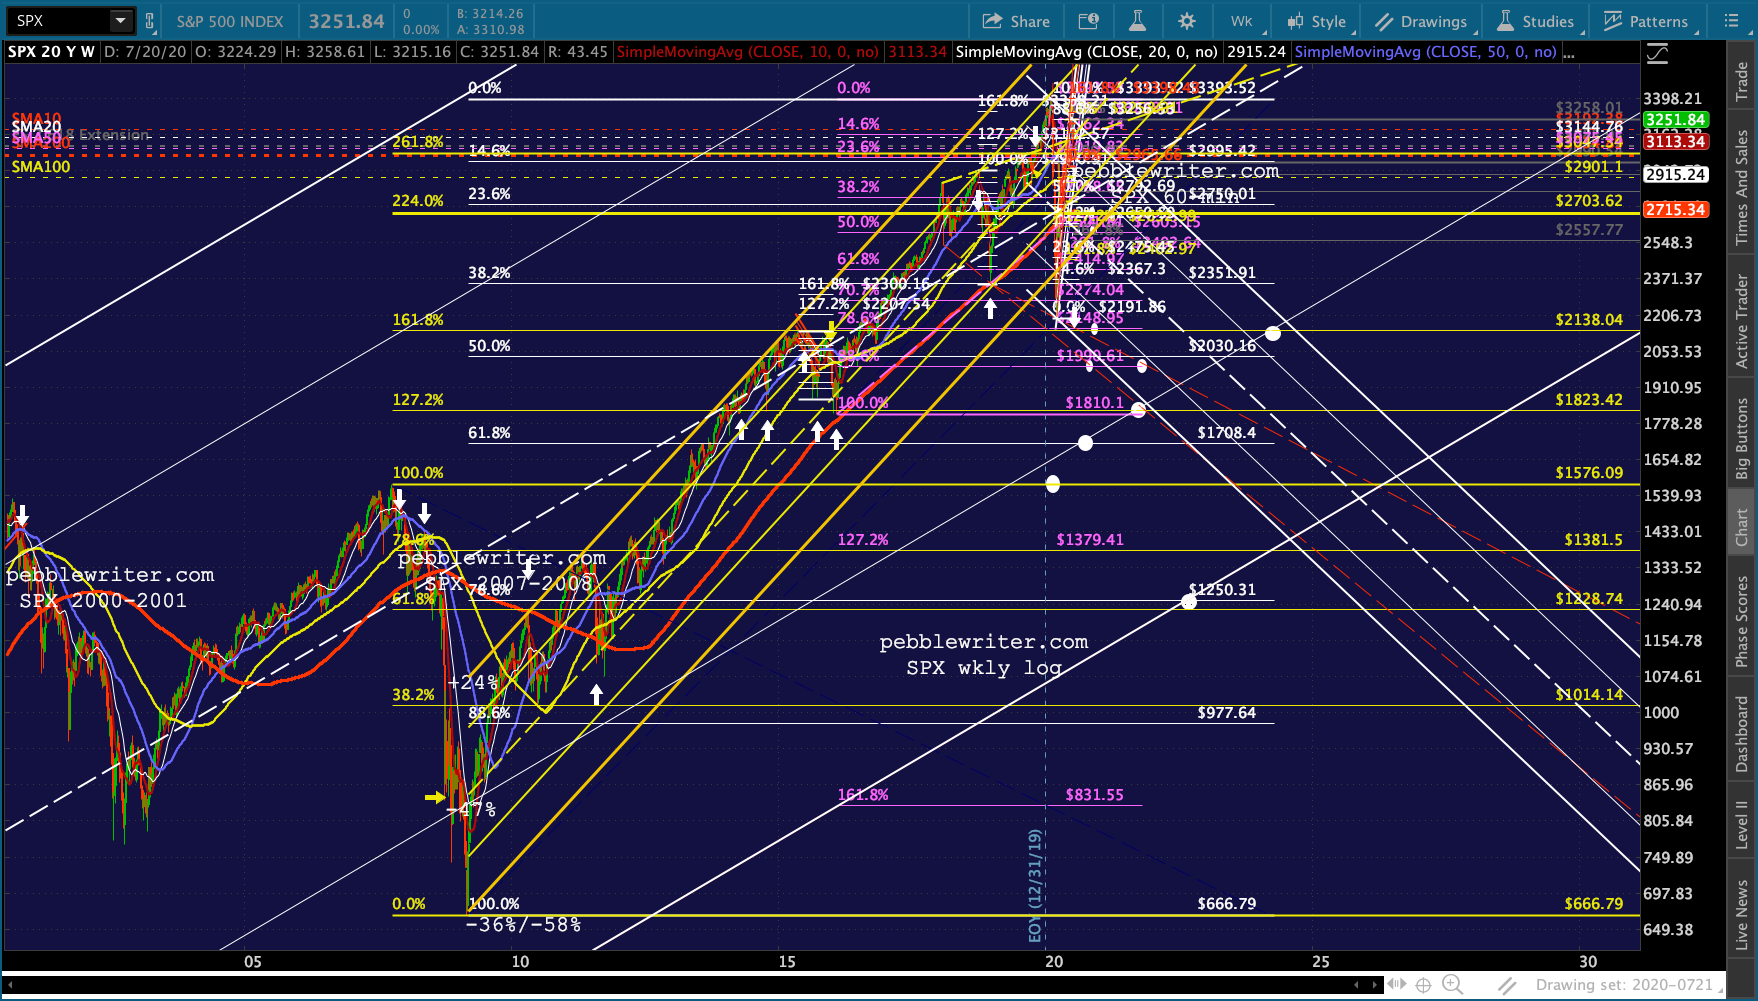 This is why I spend a lot of time playing with potential falling channels such as the white channel below. It fits the .886 we just reached, but its bottom doesn’t really align with much of anything.
  If we make a few adjustments, however, it fits nicely with some 2018-2019 lows and even intersects with the 1.272 Fib extension and rising white channel .236 line at 1823 in November 2021 (if and when the 2.618, 2.24 and 1.618 extensions ever break down.)
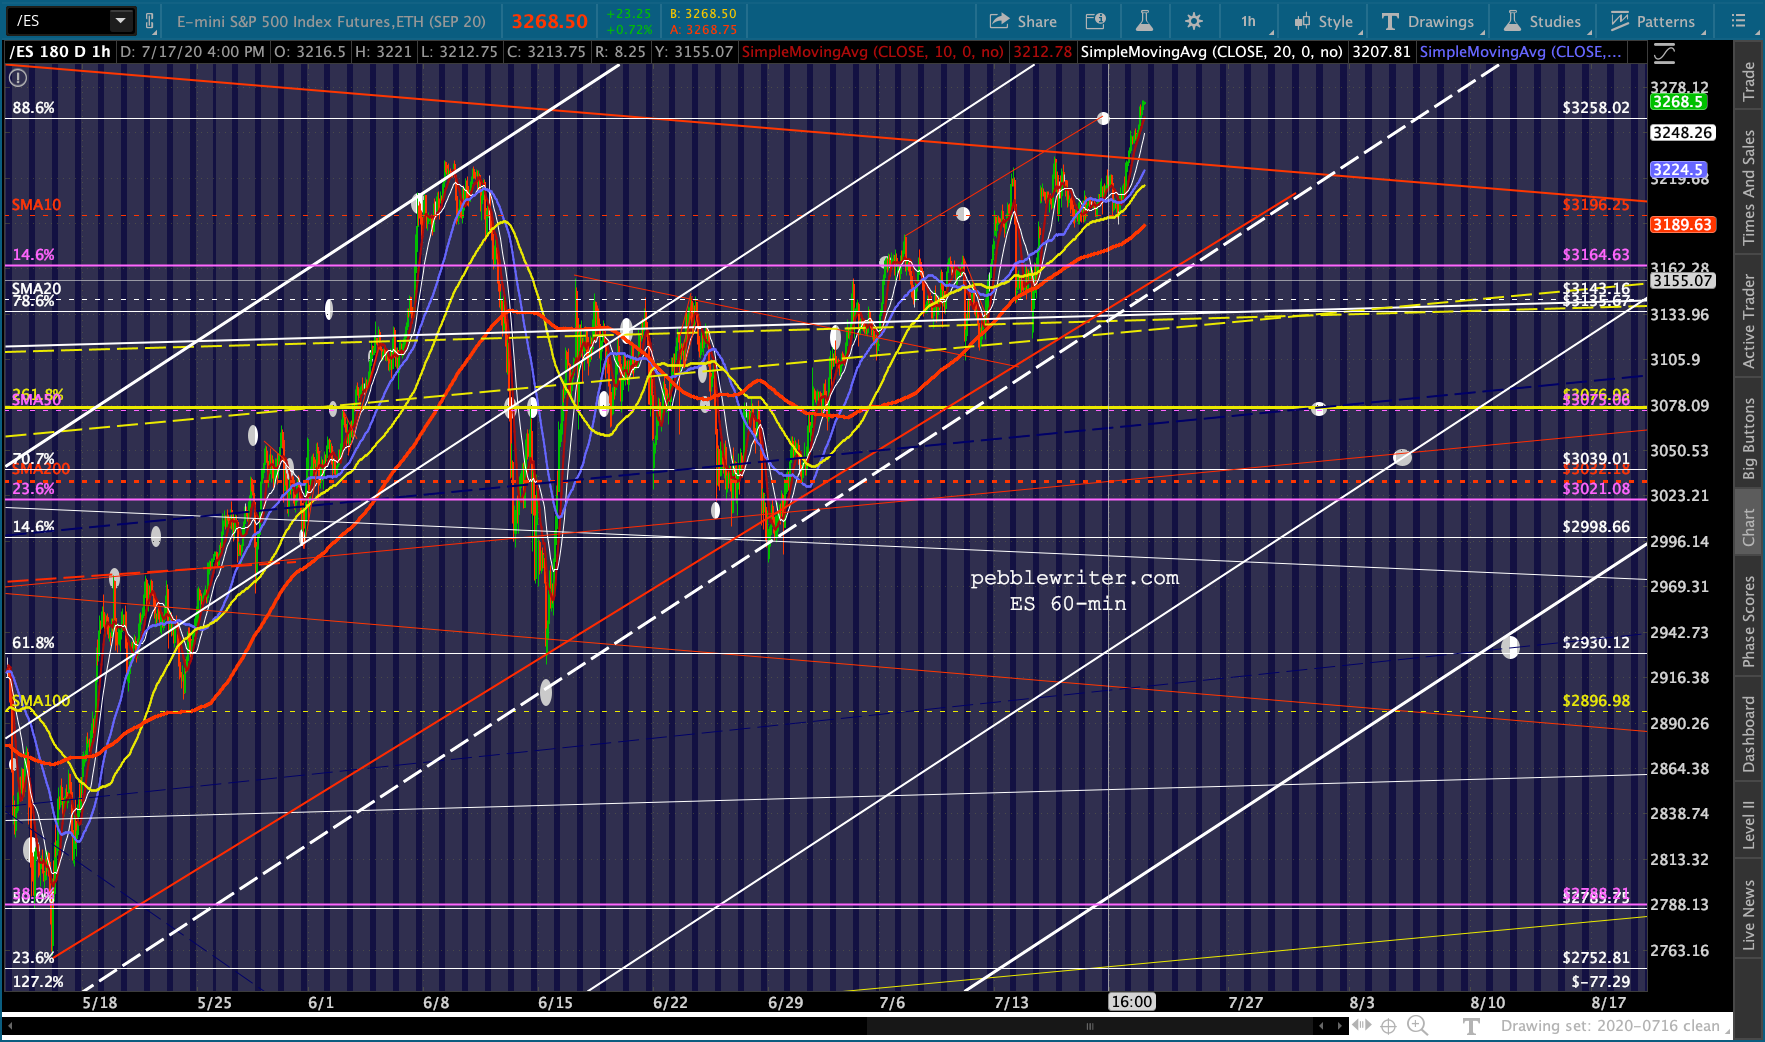
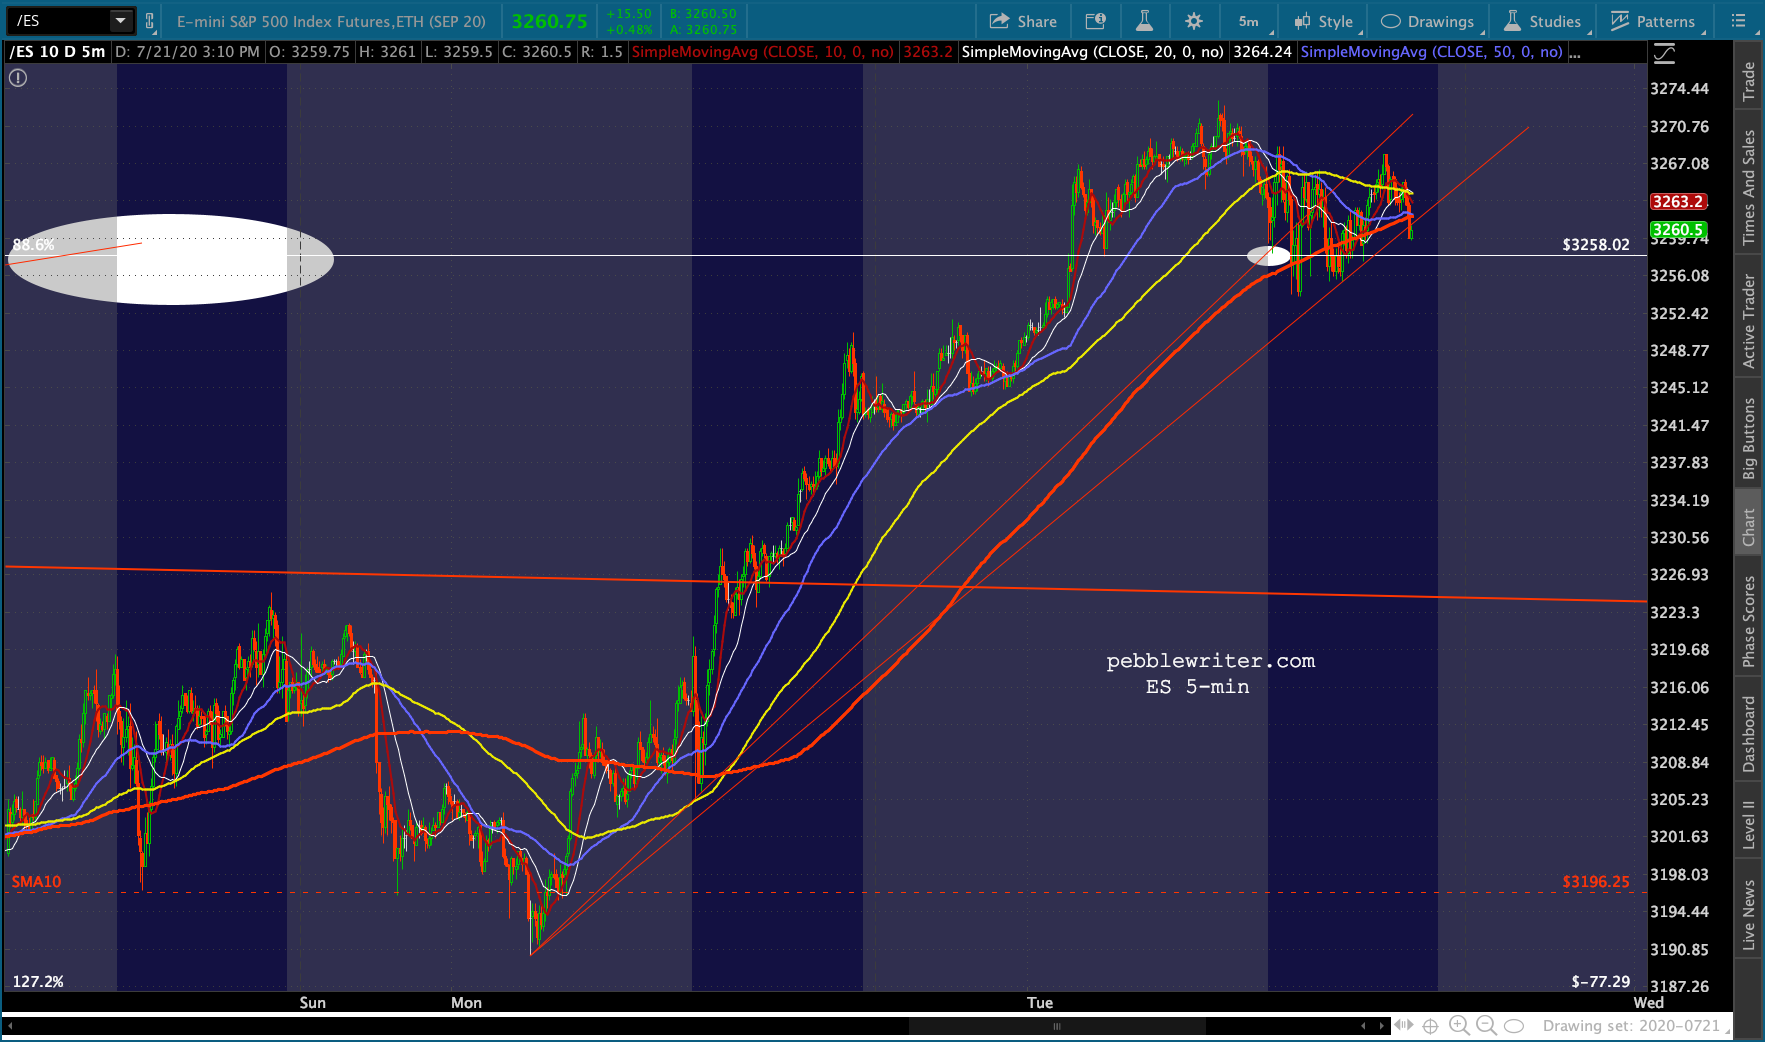
 Bottom line, keep a very close eye on ES and SPX’s .886s. It’s fine to play along on a potential breakout with very tight stops. But, understand that the potential is there for a huge downdraft if/when, say, large swaths of the country shut down again. My basic stance remains bearish until proven wrong.
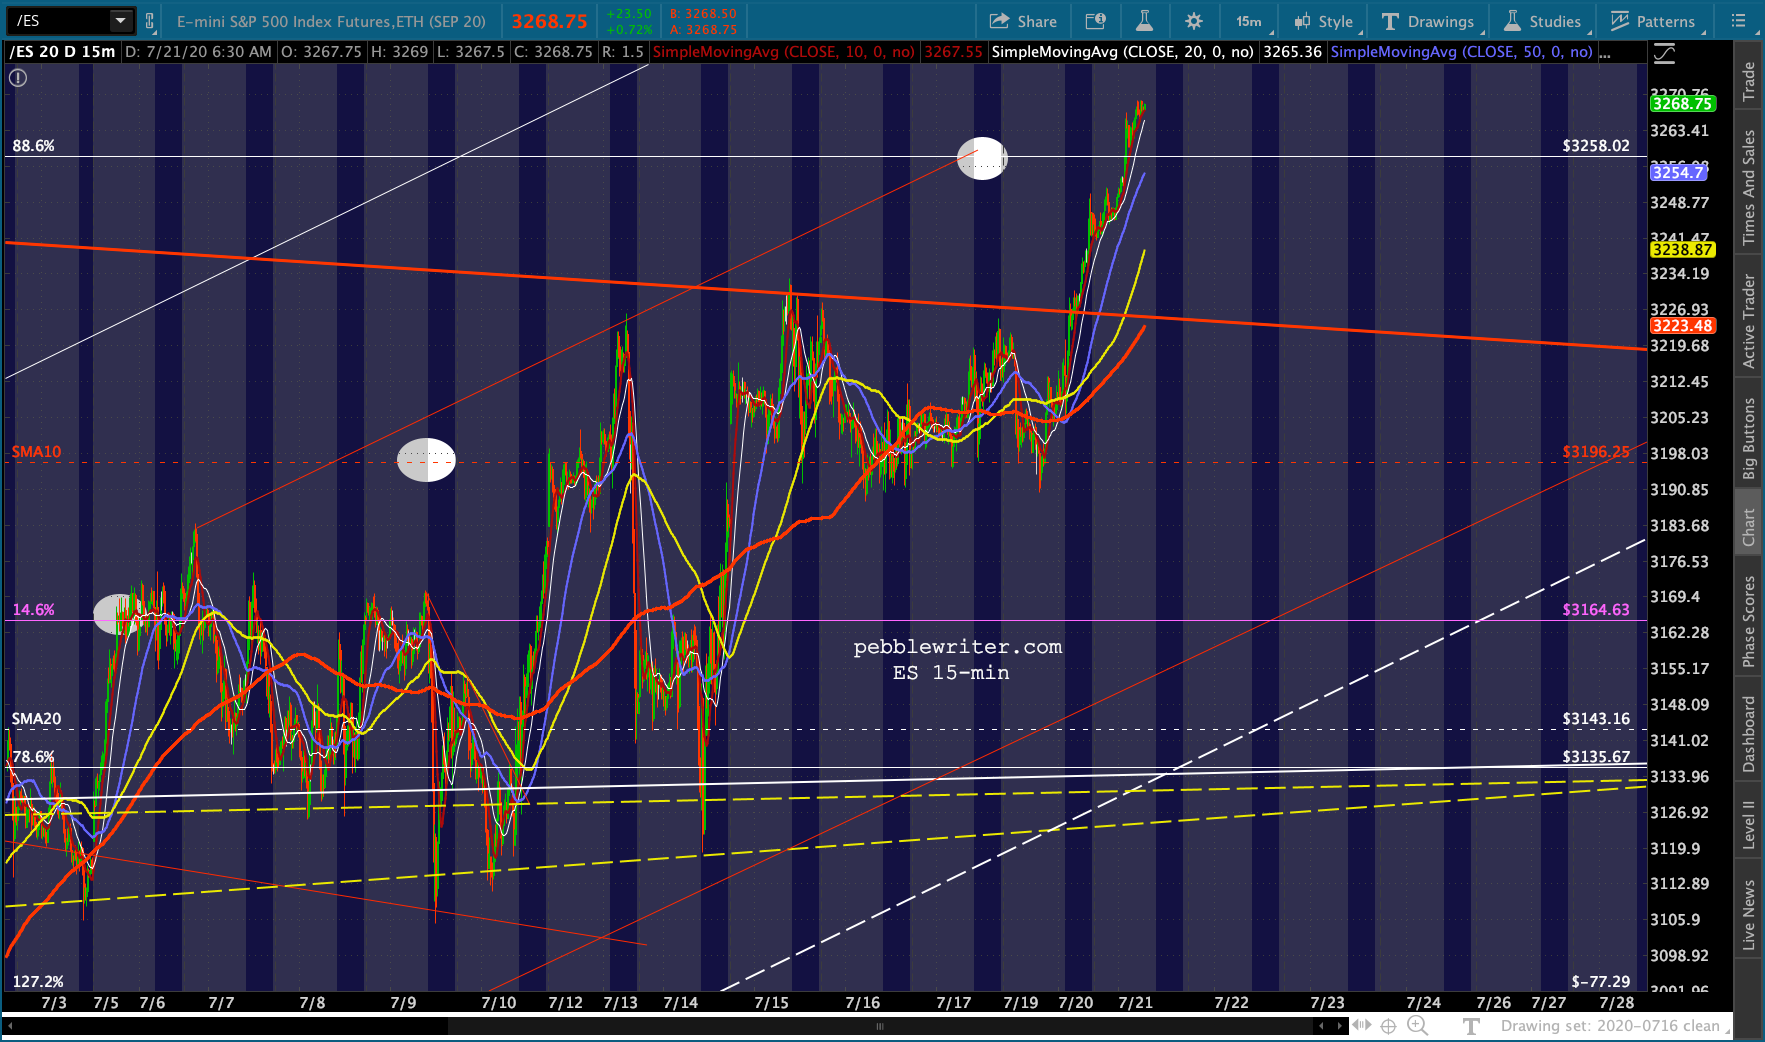
 ES closed short of its .886 yesterday, but has pushed past it overnight (when it realizes most of its gains.)
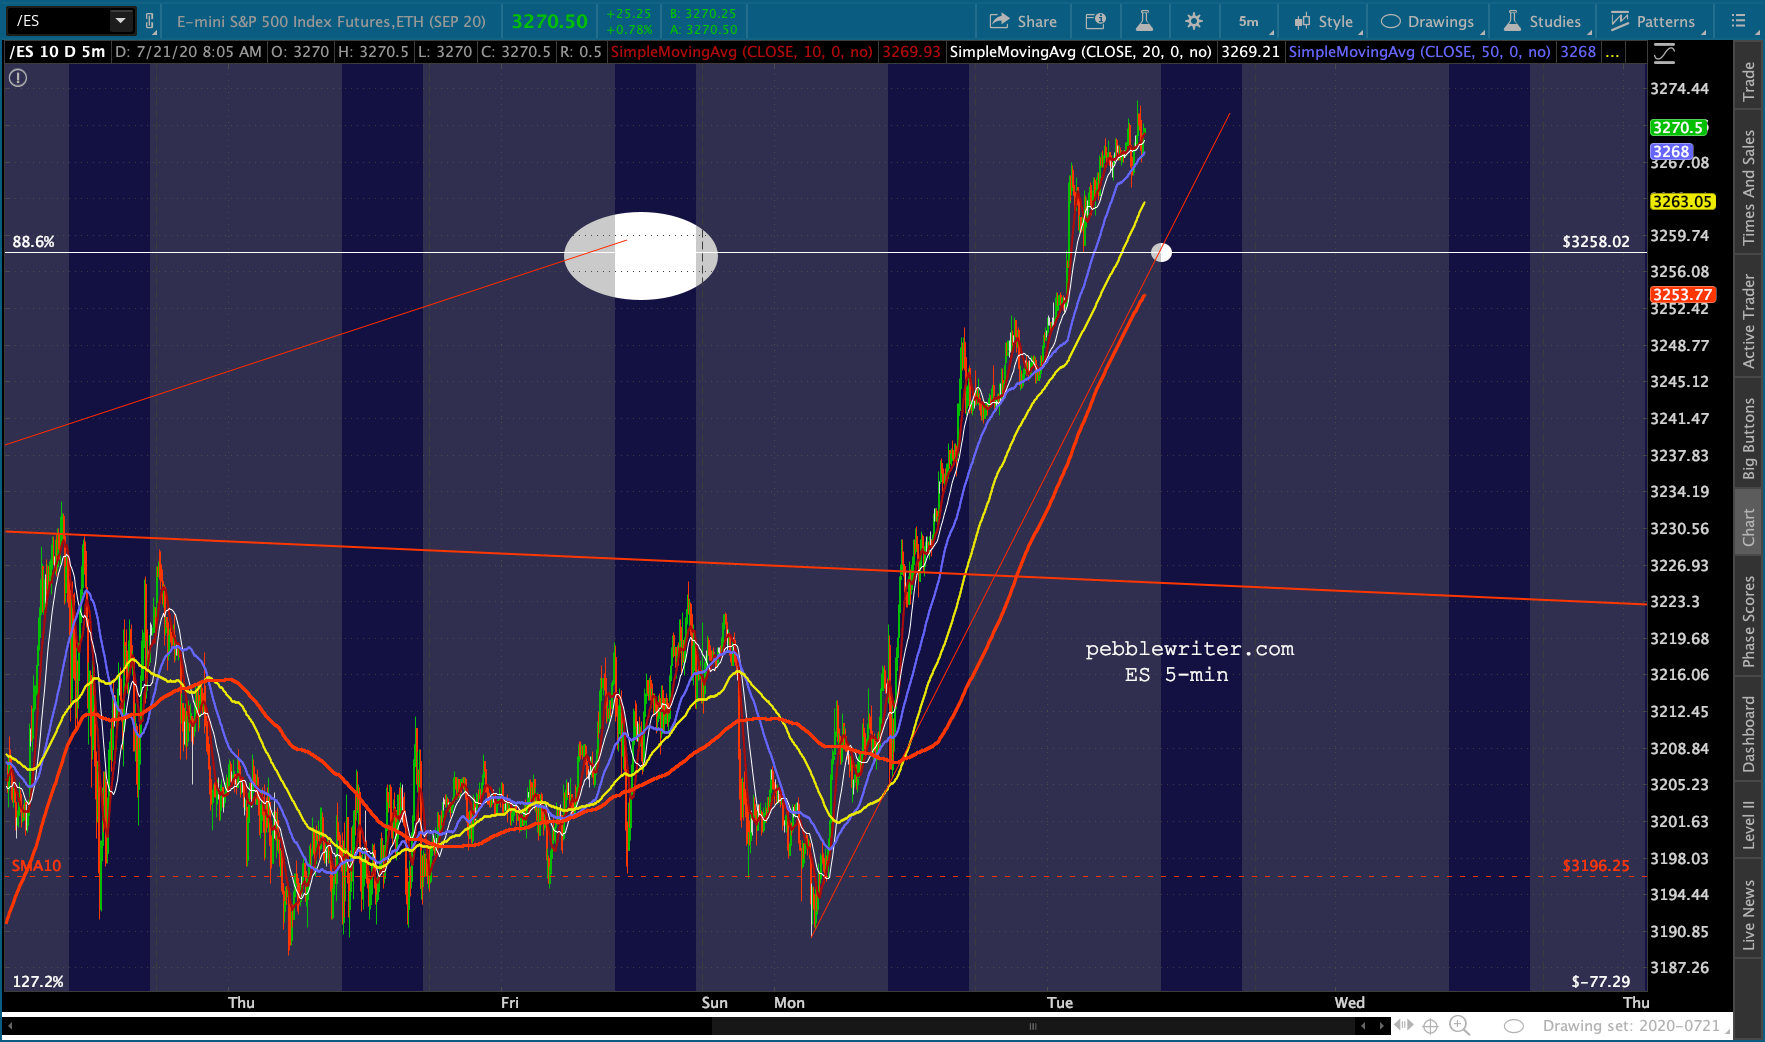
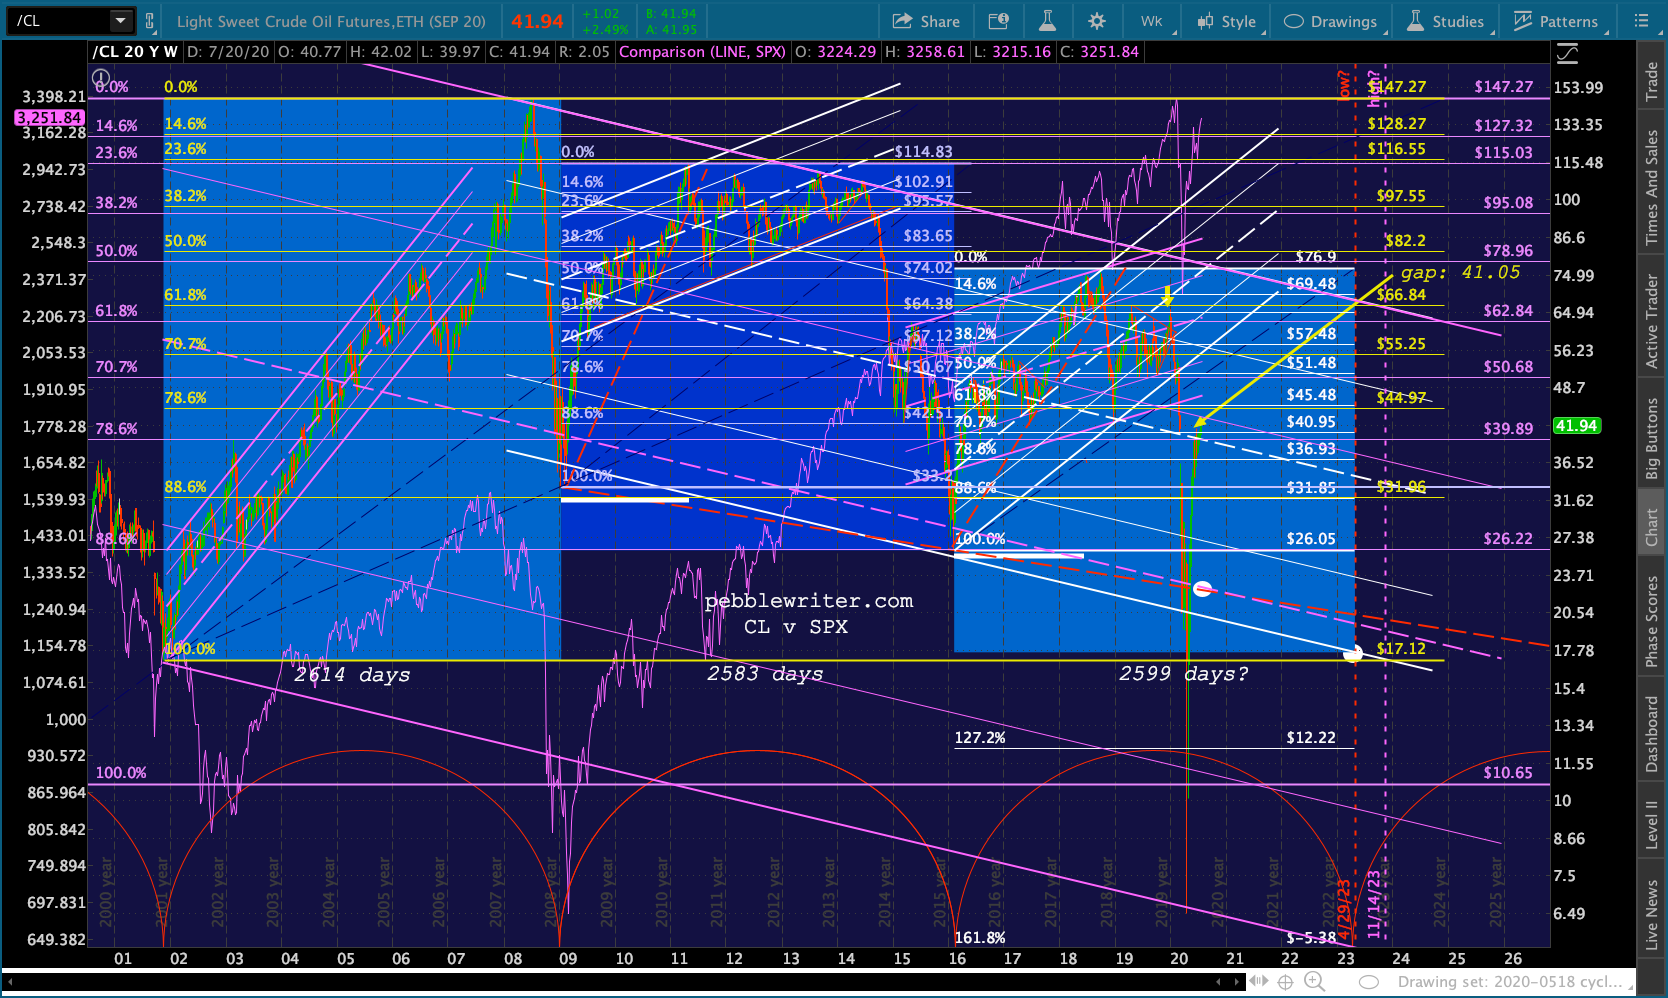
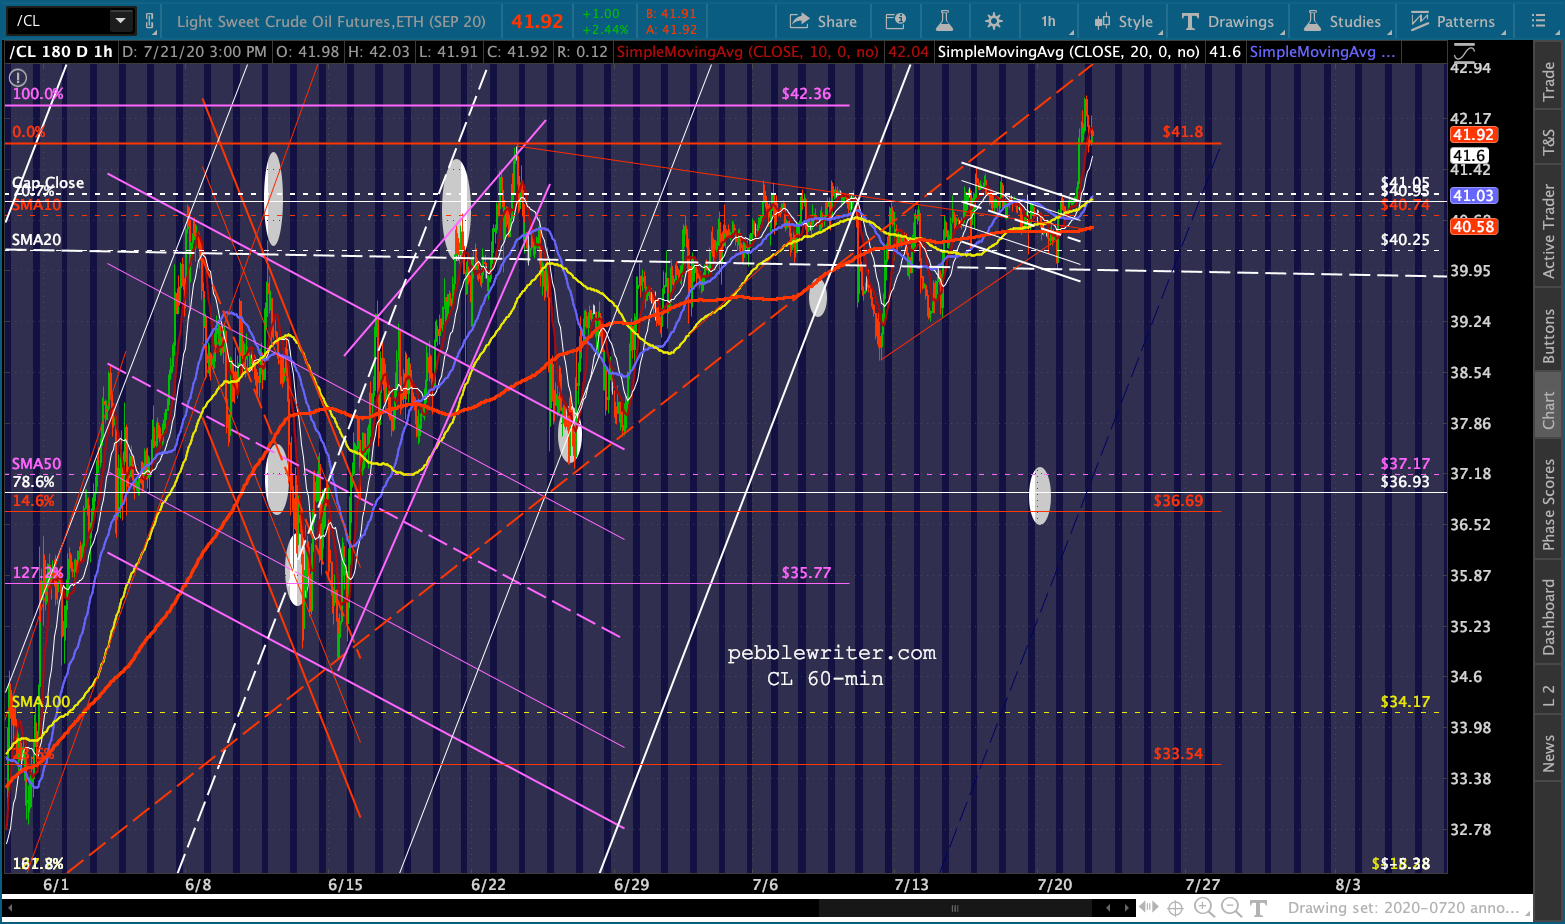
 CL is spurting higher this morning, probably on MBS strengthening his hold on OPEC. I don’t expect it to hold.
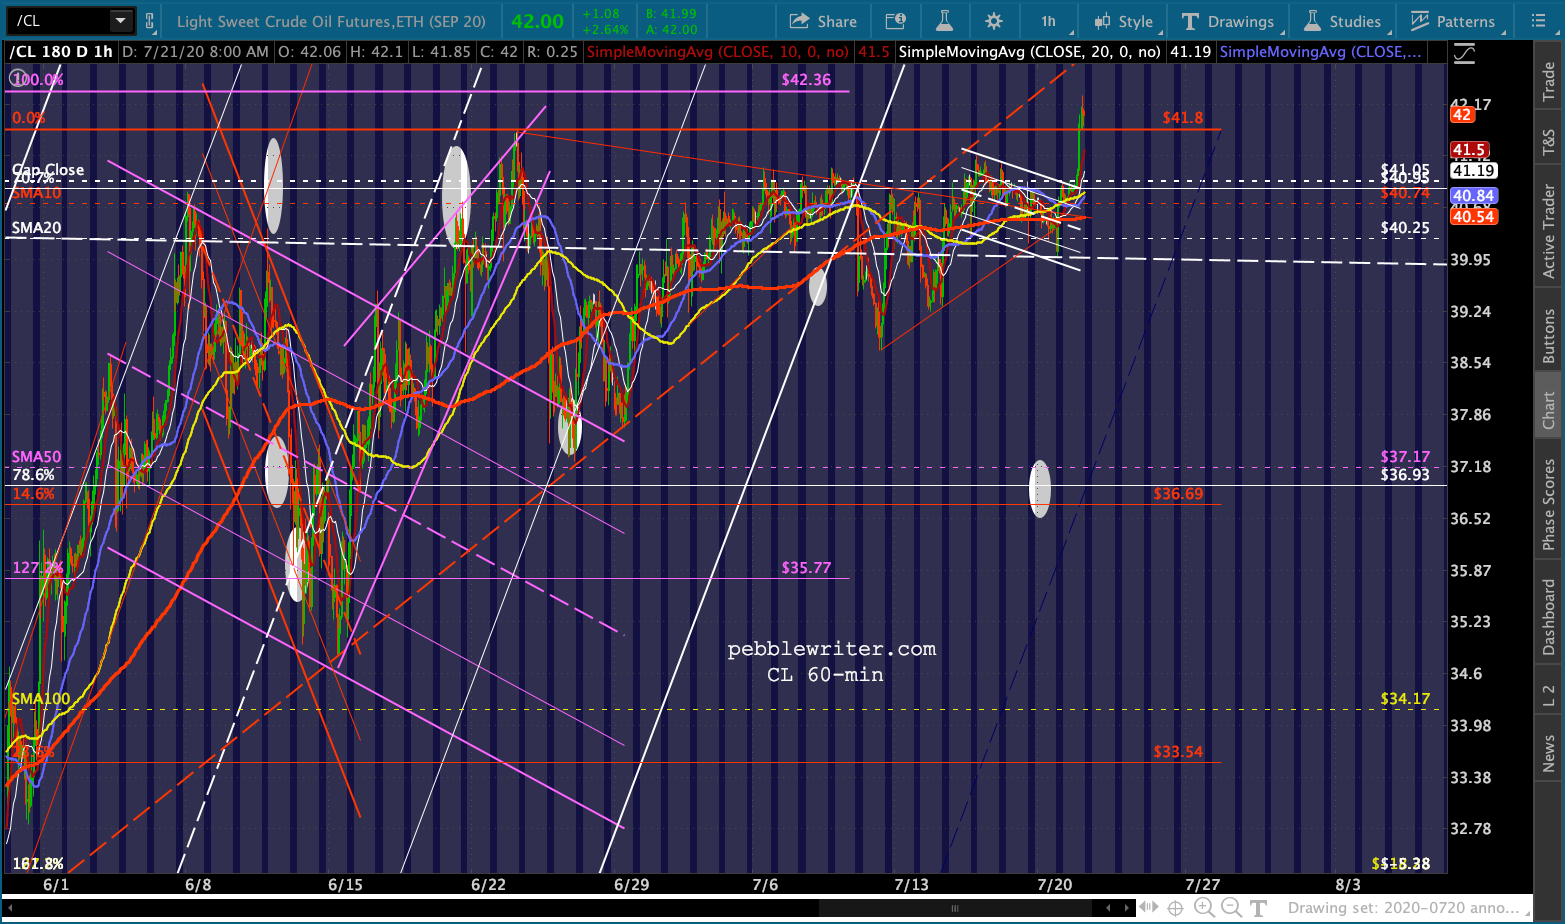
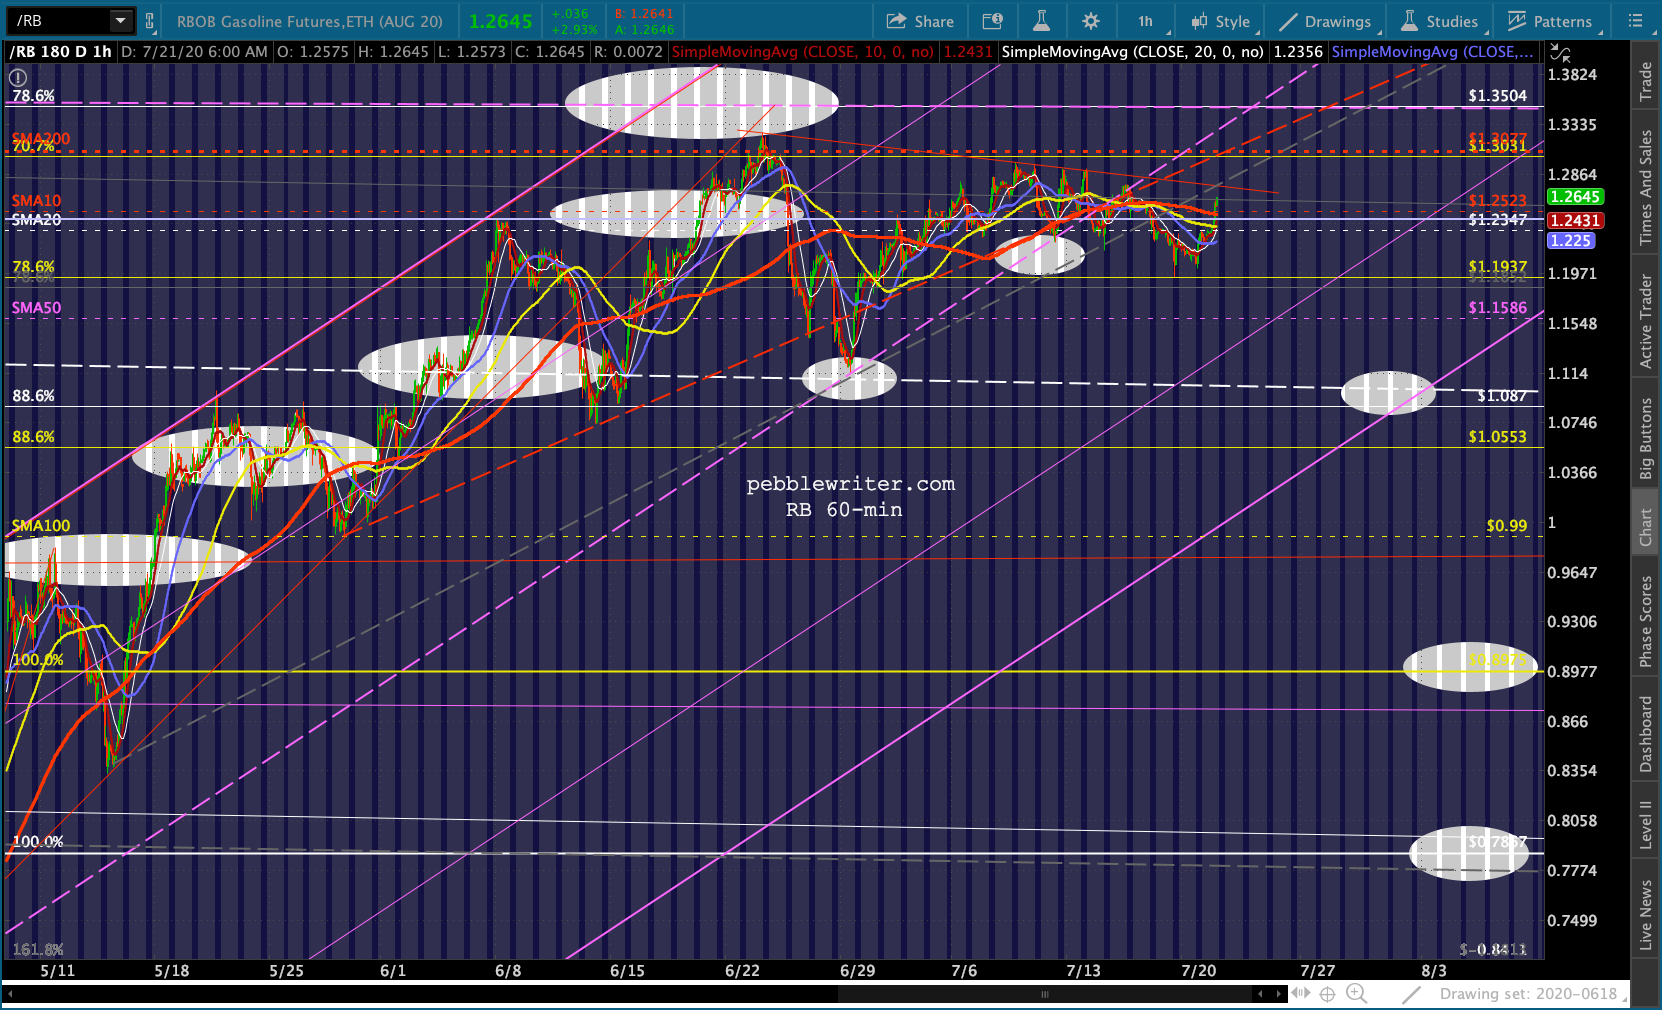
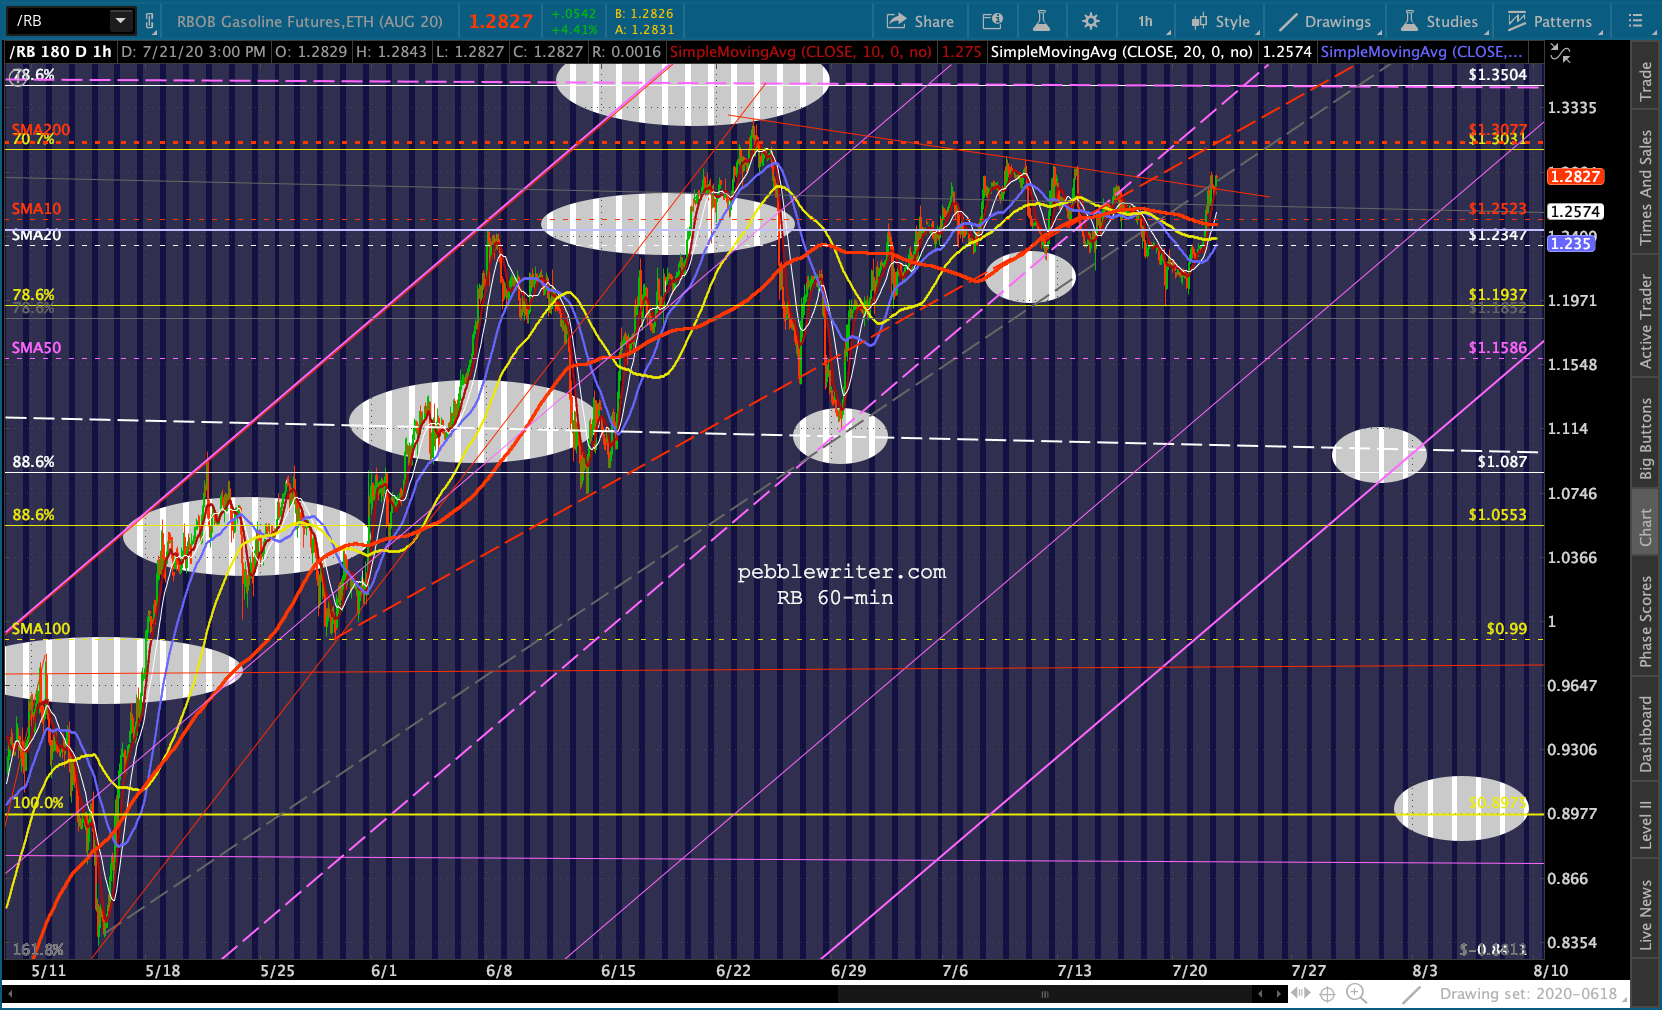
 RB is backtesting.
 USDJPY is also bouncing a bit. Again, I don’t think it will last. I think EURUSD has probably run its course and will allow DXY to bounce without the yen’s help.


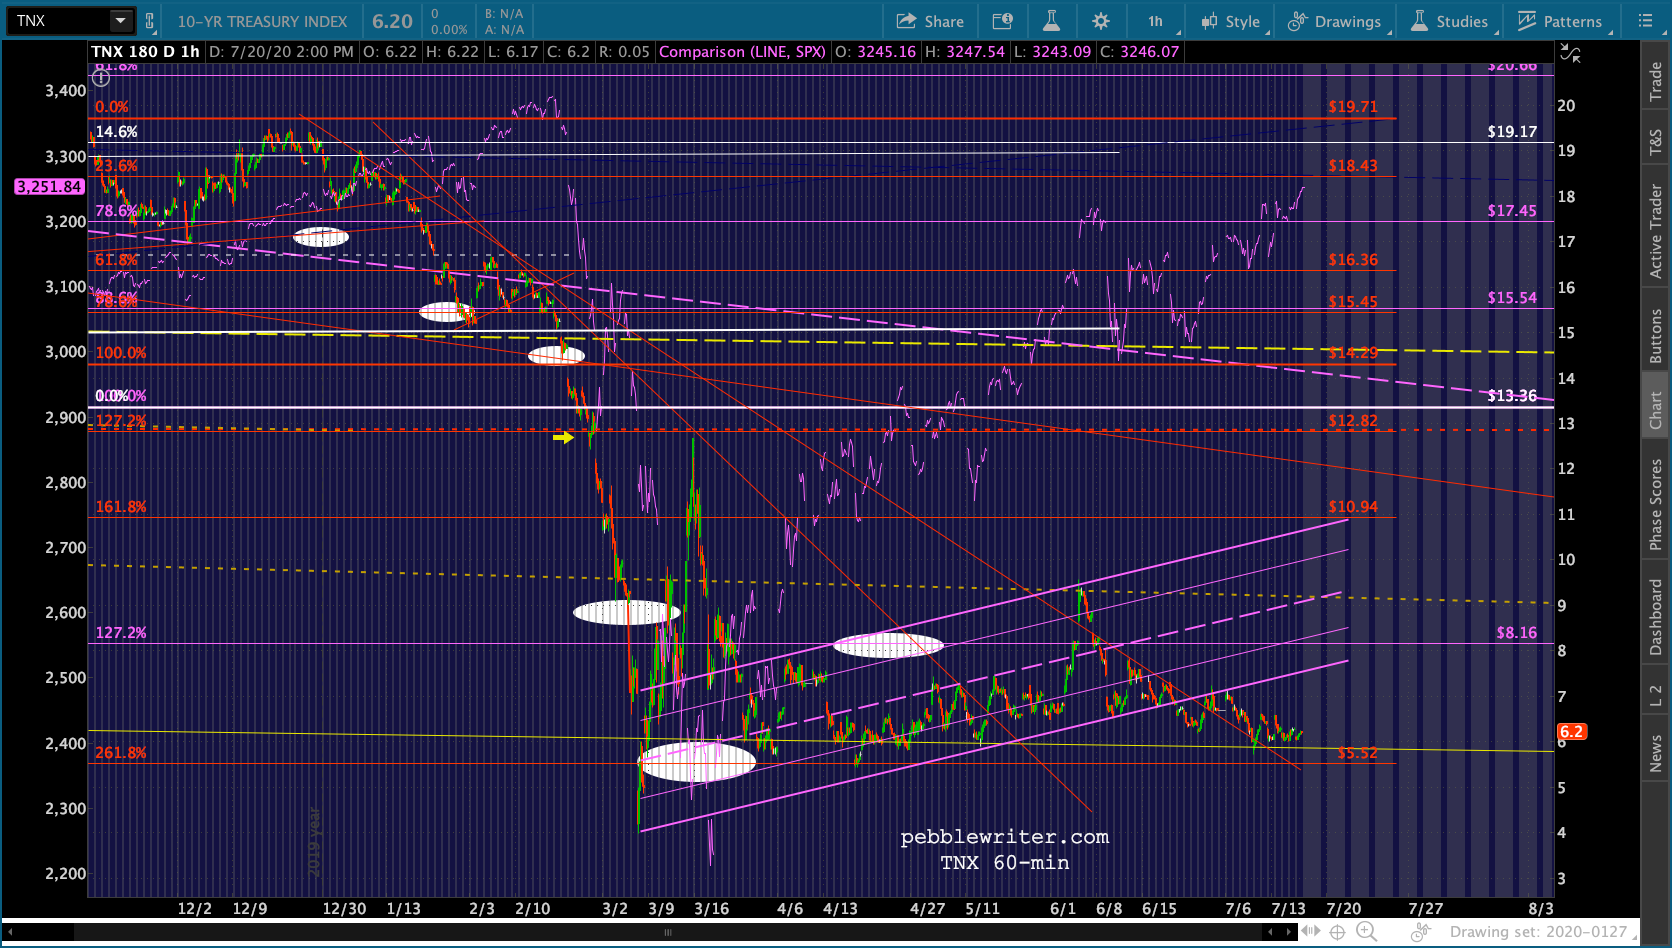
 The 10Y still looks like it’s heading lower.

 And, as I get tired of saying (and you get tired of reading) VIX continues to hold the key to the algos’ behaviour. The yellow TL and the SMA200 have broken down, but the June lows have held so far.
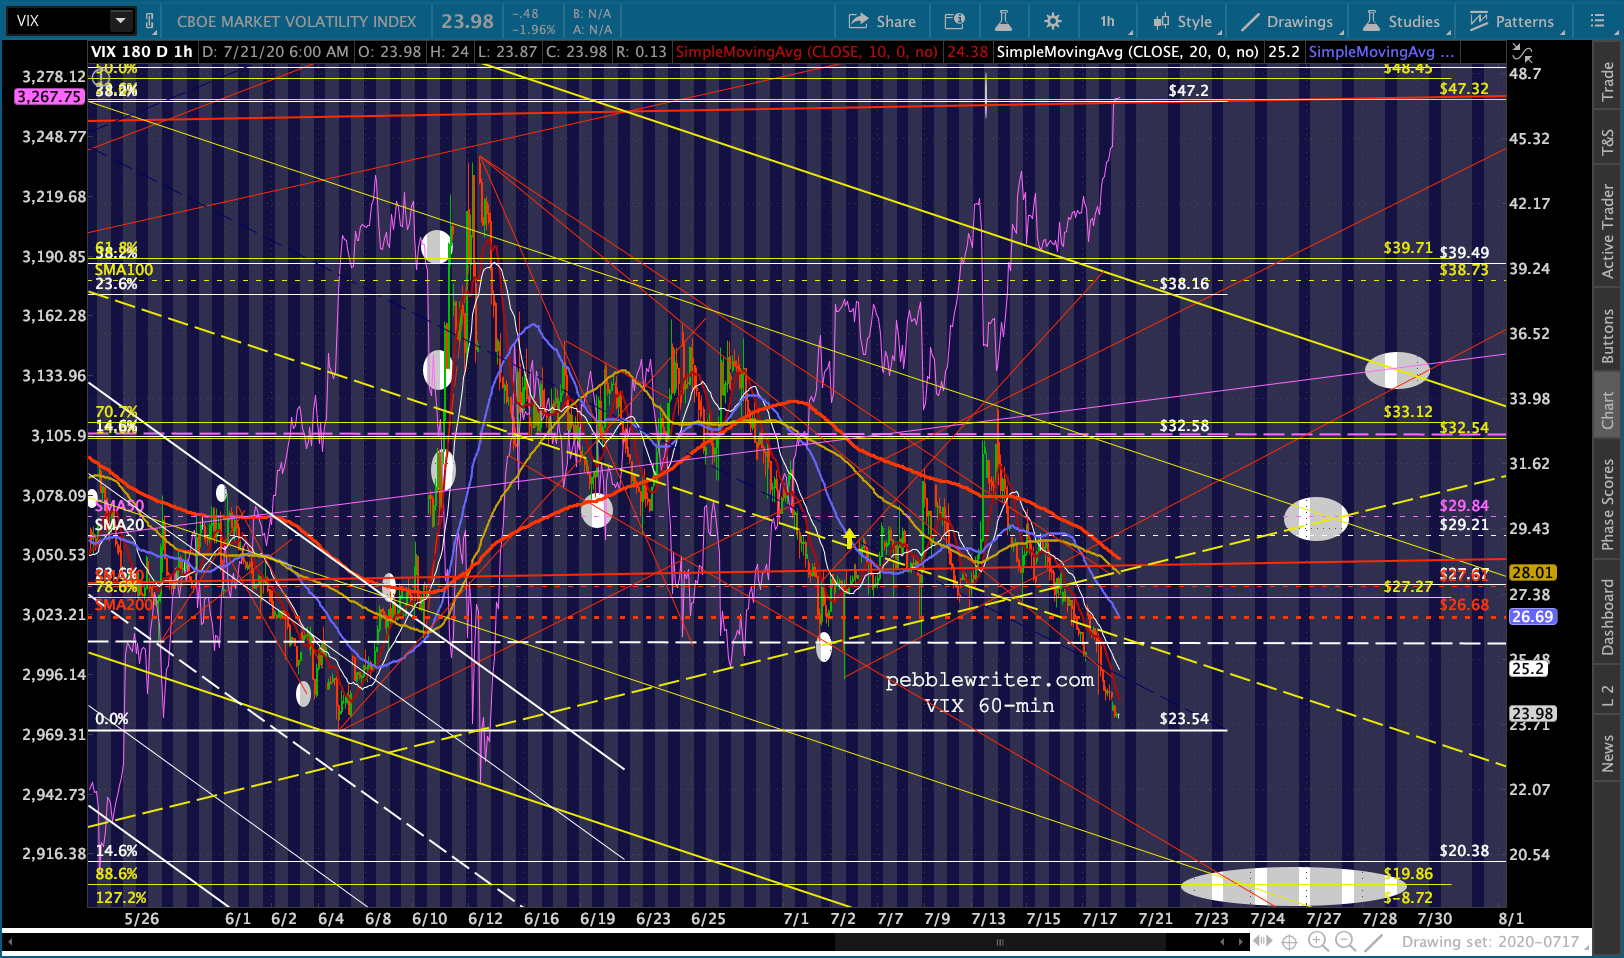 I have to dash out for a doctor’s appointment, but should be back around 11am.
GLTA.
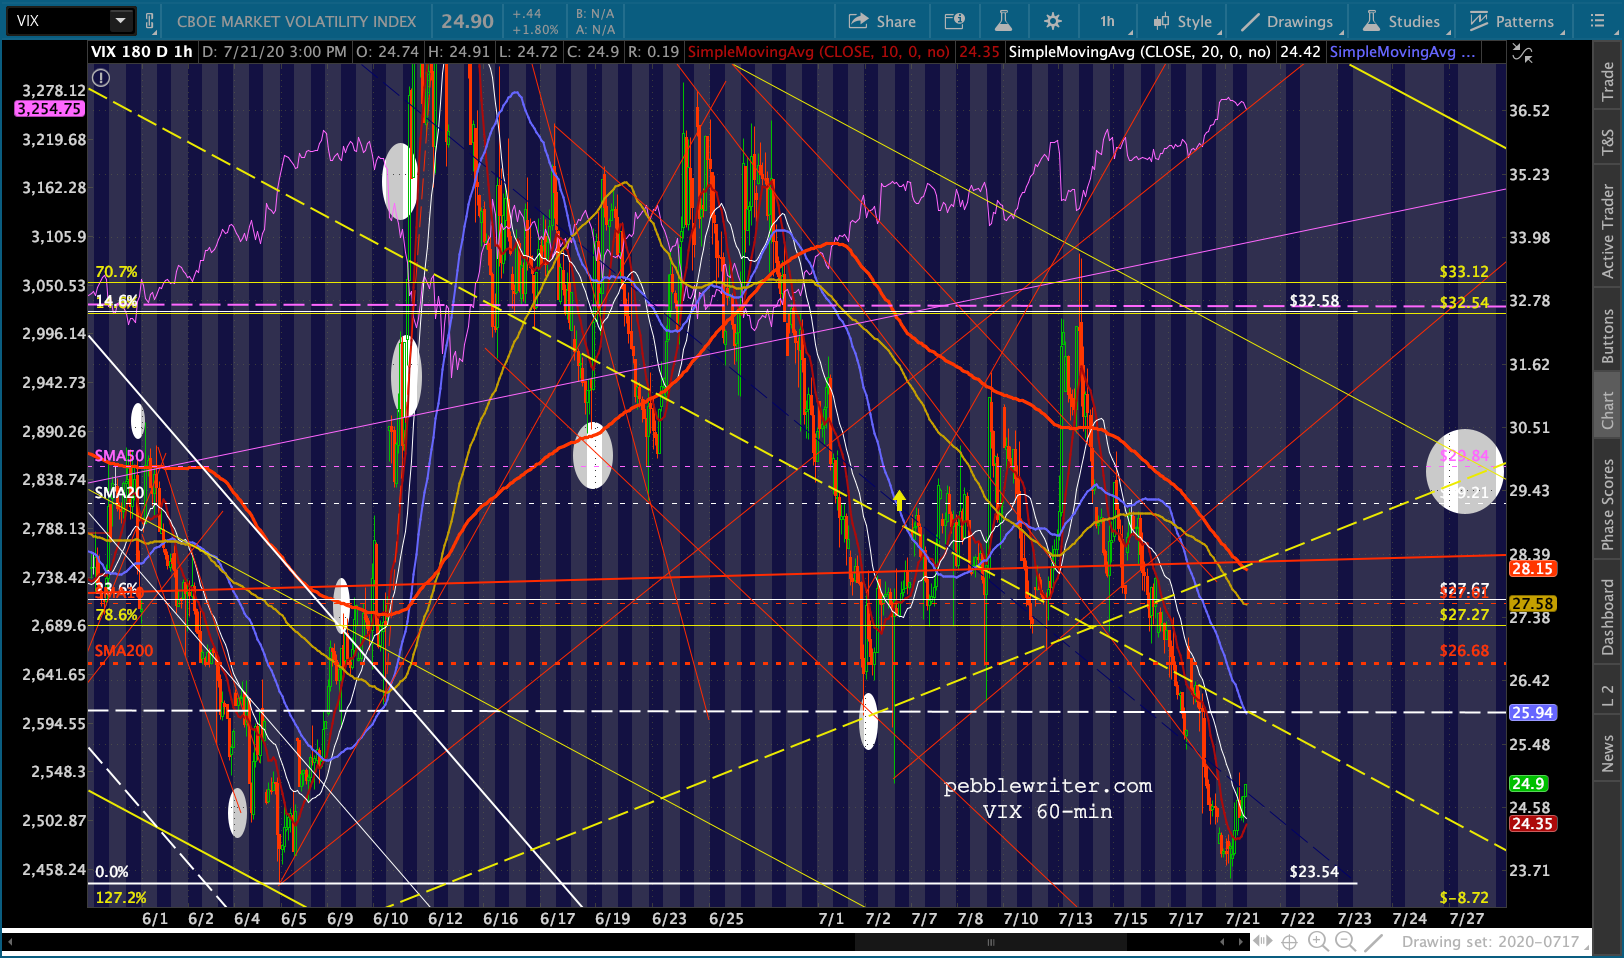
UPDATE: 3:10 PM
Starting to see a little action to the downside- and with VIX bouncing above its June lows. Ideally, SPX will break below both the gap at 3258.61 and the .886 Fib at 3256.33. Otherwise, it looks like a backtest.

 UPDATE: 9:35 PM
As we discussed when GC reached its .886 at 1823.60, it was a reasonable place to short even though the fundamental picture – with enormous cash injections and threats of inflation are bullish for gold. Today’s push up through the .886 is a breakout of sorts, and under normal circumstances is reason enough to switch to a long position with tight stops.
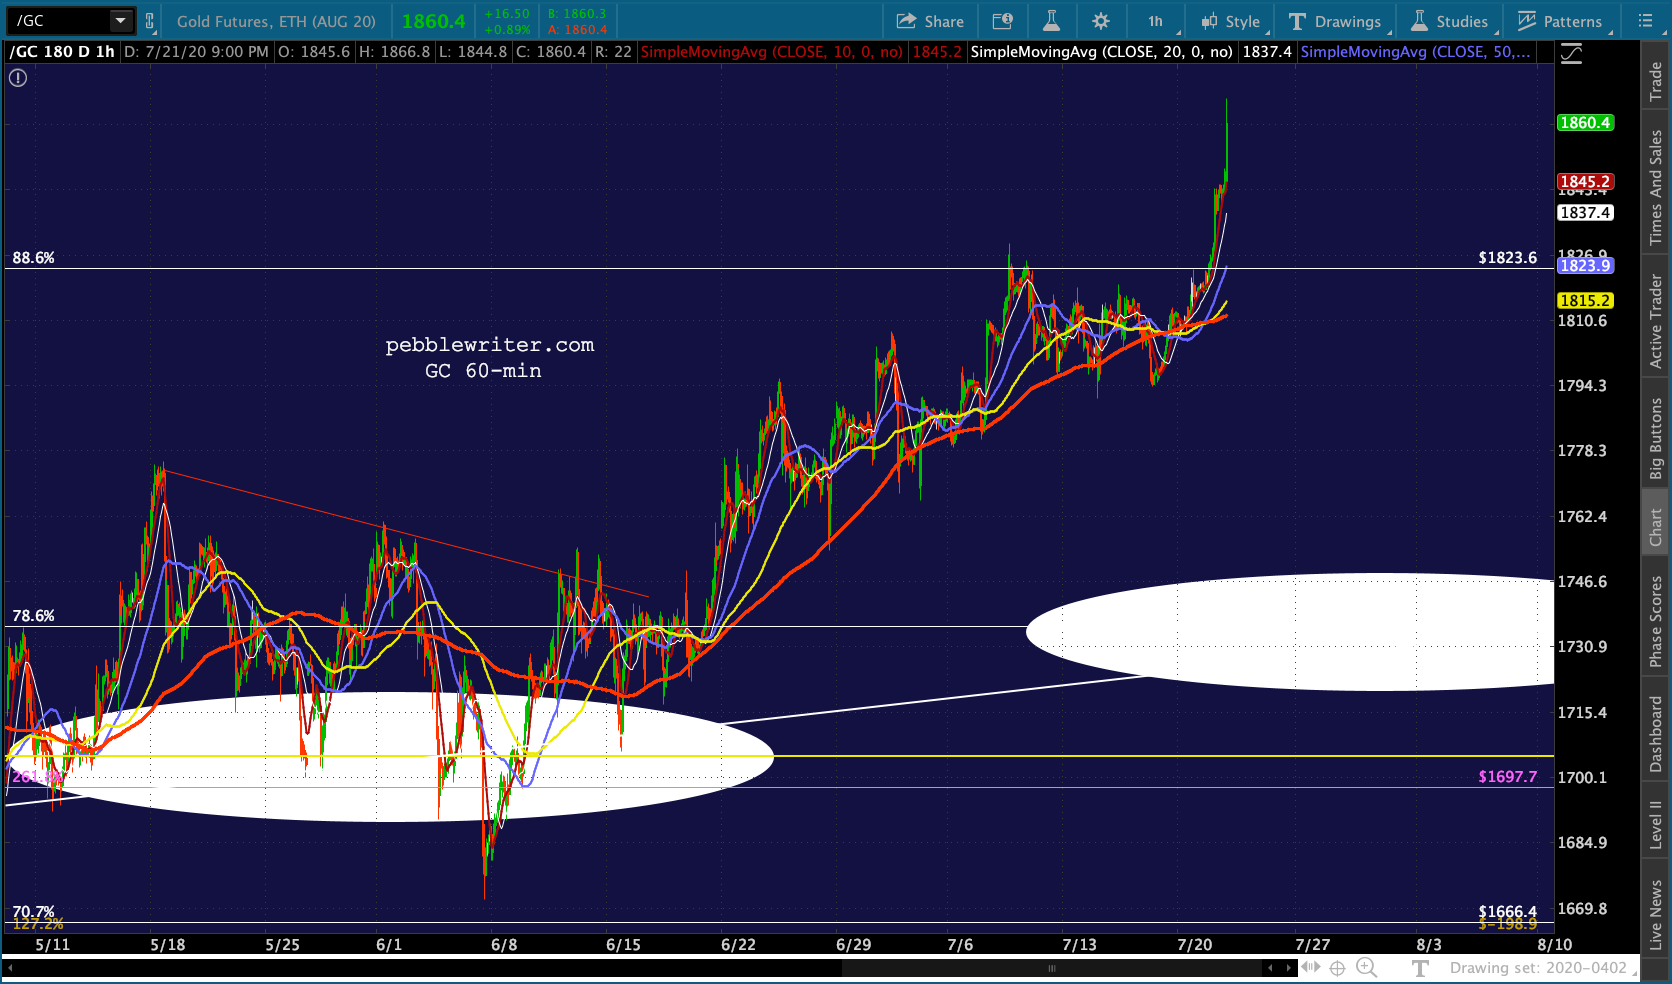 As discussed in Feb, GC broke out of the rising red channel dating back to the 2015 lows (as well as the rising white channel that connected a few of the recent highs.)
 If we expand the rising red channel to include the 2011 highs, we get a different view of today’s action: GC just reached the midline.
This doesn’t necessarily mean a reversal, but it’s a clear warning sign – especially since the next horizontal resistance is the all-time high. Would the Fed really allow that to happen? I’m not so sure.  Investors have really embraced the devaluation of the dollar, but the Fed has stepped in plenty of times in the past (as in all those times it was hammered at the yellow TL at 1380ish.)
Bottom line, use stops if you feel compelled to chase it. If stocks reverse very sharply here at the .886s, gold is likely to be swept up in the carnage as it did in Feb-Mar. It could very well backtest the .886 or even the .786 at 1735.70.