UPDATE: EOD
Hate to be posting this so late in the day, but I’m traveling on business and am just getting back to my room.
Today certainly put my bearish conviction to the test. I haven’t felt so steamrolled since July 1st. Under the 2011 = 2007 analog, that’s the day the market was supposed to run smack dab into the trend line from the May 2 top and, failing that, the .886 Fib on the Bat pattern that had set up since Jun 1.
After having been so accurate in calling a rapid rise to 1320-1330 from the 1258 lows (remember the choruses of “flash crash!”) I watched in horror as the market surged past my target. It finally (mercifully) came to rest at 1356 — exceeding the TL and the .886.
Of course, a couple of weeks later, my ego and my portolio were salvaged as the market finally topped (at a fan line) and dropped a bunch of points. But, there were some lesssons there which, had I learned them, might have saved me some serious stress today.
First, consider all the possible entry points on harmonic patterns. Had I chosen the May 2 high of 1370 for my Point X, I would have accurately chosen 1357.75 as my Bat Pattern .886 instead of 1327.
Second, I would have been less wedded to the TL off the May 2 high. I was so positive we’d have an exact repeat of 2007 that I assumed the TL off the May 2 high had to be repeated. If I had been more open-minded re the Harmonics pattern…
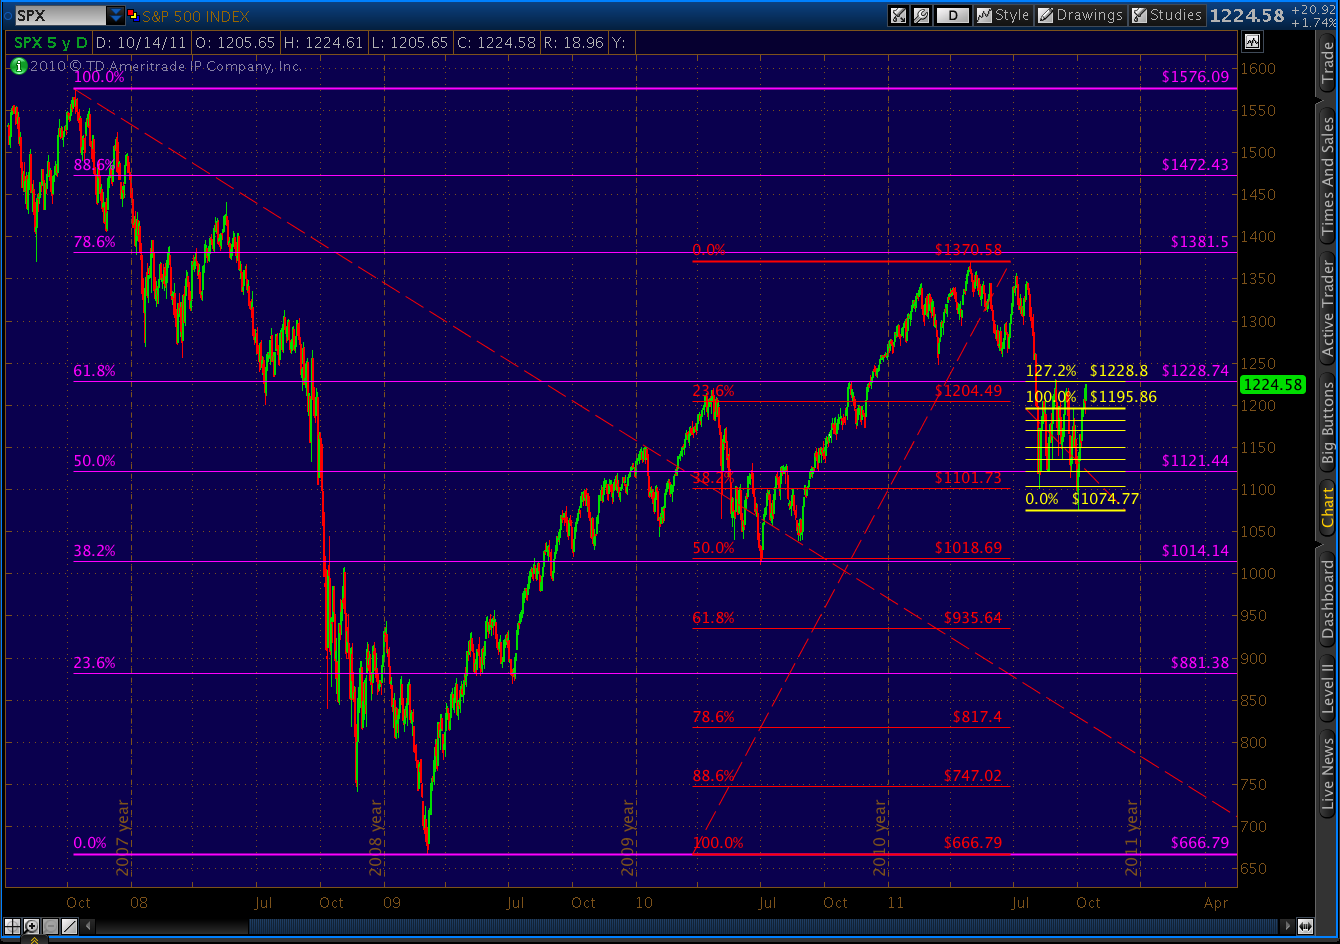
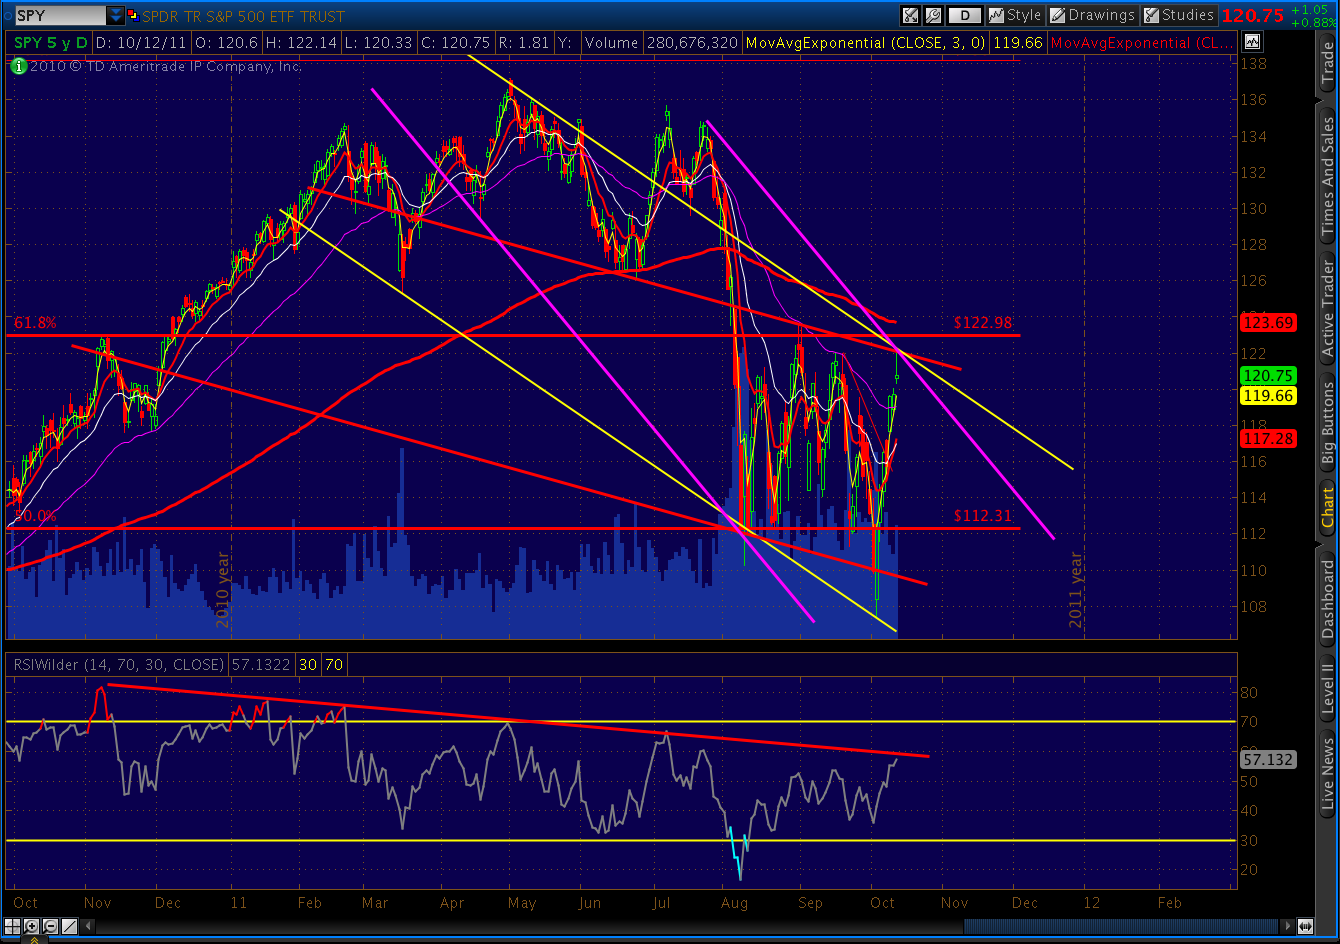
The lessons here? I’m going to let the channel line float, telling me where it needs to be drawn instead of me telling it. Second, I’m taking another look at the entry point. If, instead of the Sep 27 1195 high, we’d used Sep 20’s 1220 as Point X, then our reversal would come in around 1203. The Aug 31 high of 1230 would have indicated 1212.
I’m going to take a fresh look in the morning. In the meantime, though, I’m looking closely at July 1 as a worthwhile guidepost to the next few days.
UPDATE: 3:20 PM
VIX looking like it’s ready to pop.
UPDATE: 1:05 PM
Just saw a chart of the EMA 50 that caught my eye.
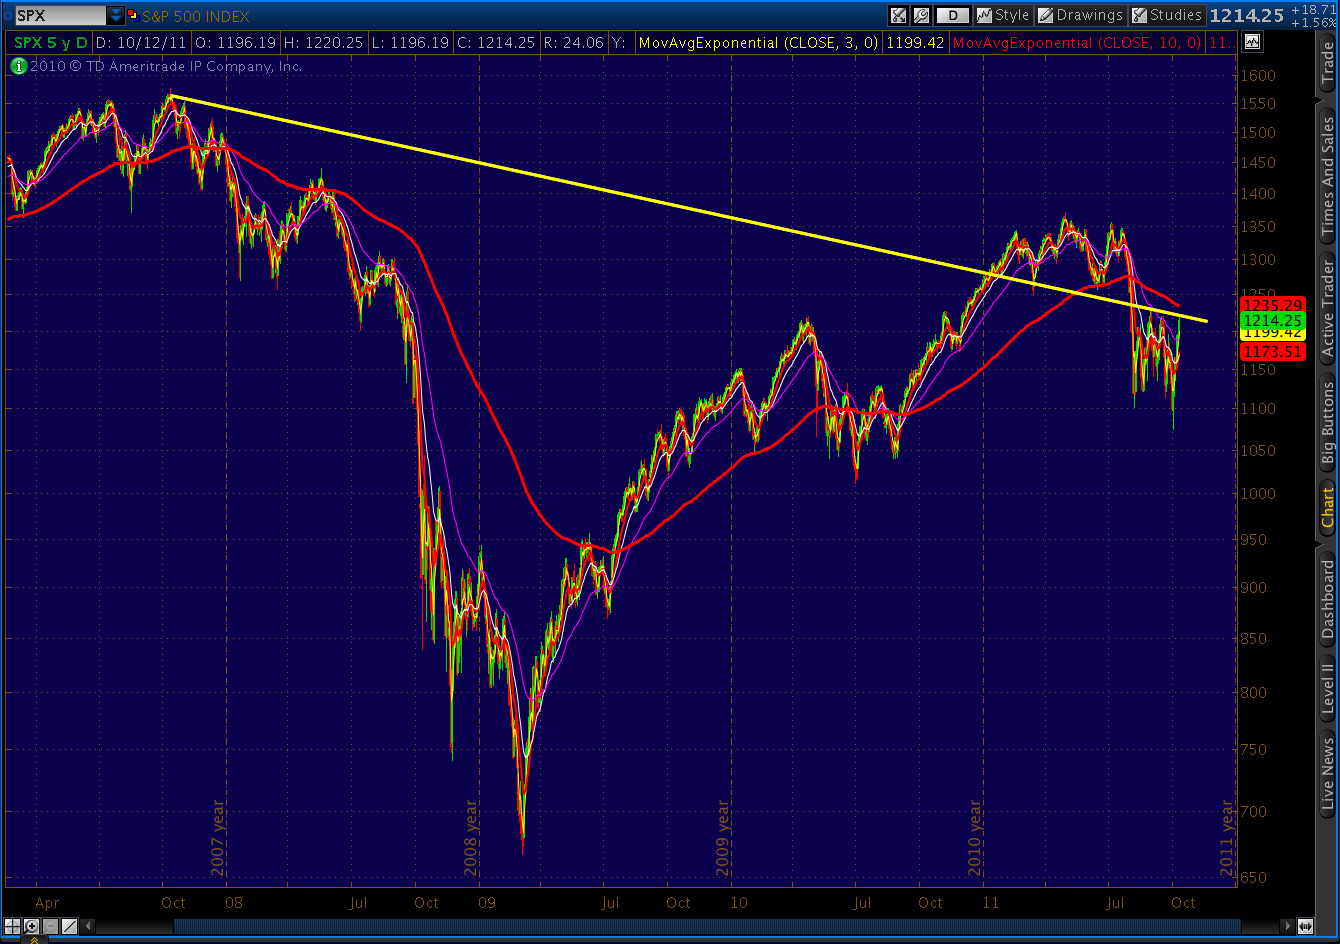
Also, note that the internal trend line I mentioned this morning seems to be holding pretty well. It’s a fan line from the 2007 top that connects with the Aug 15 & 16, Sep 7, 8 and 27th highs. It’s marked in bold yellow in the above chart.
In terms of timing on the downside…. My original forecast from 2 weeks ago identified 1040 17th or so. That would be roughly 150 points in 5 trading days from right here. Normally, that would be a tall order. In this market — very doable. The trick will be getting things going on the downside.
Obviously, we’re at a critical juncture. Any time a market seems poised to break out from a long established pattern — in this case, the channel it’s been in since July — one of two things will happen. If it fails, like it did on Sep 16, we get things like 150-point declines. If it does break out, which I’m certainly not ruling out, the momentum could be substantial.
For me to believe that’s happening, I’d want to see a close above the channel at the very least.
UPDATE: 10:50 AM
Just completed a nice looking back test of the rising wedge. The advance seems to have stalled out, with volume dying off and breadth easing.
While it could have a little more juice in it, this advance seems to be sputtering. The inverse H&S; pattern would be very lopsided, with a tiny shoulder on the right side. Stranger things have happened, but I wouldn’t put much stock in it without a more symmetrical shape.
ORIGINAL POST: 10:00 AM
We’ve reached last week’s .886 target of 1182.06, the logical place to reverse and complete wave 5 down of Minor 1 if this is, indeed, a Bat pattern playing out.
The alternative, of course, is that we’ve already started into Minor 2 and that this pattern will extend, closing beyond the channel. Many EW experts, including some very good ones, are operating under this theory — having called 1074 the Minor 1 bottom.
But, my money is on this being an intraday push — like many we’ve seen before. I’m going out on a limb and will start loading shorts. My respect for the alternative viewpoint means I’ll keep a close rein on things — tight stops, etc.
There is an internal trend line that runs through about 1192. If we overshoot on the Bat, it should provide a good line in the sand.