UPDATE: 4:00 PM
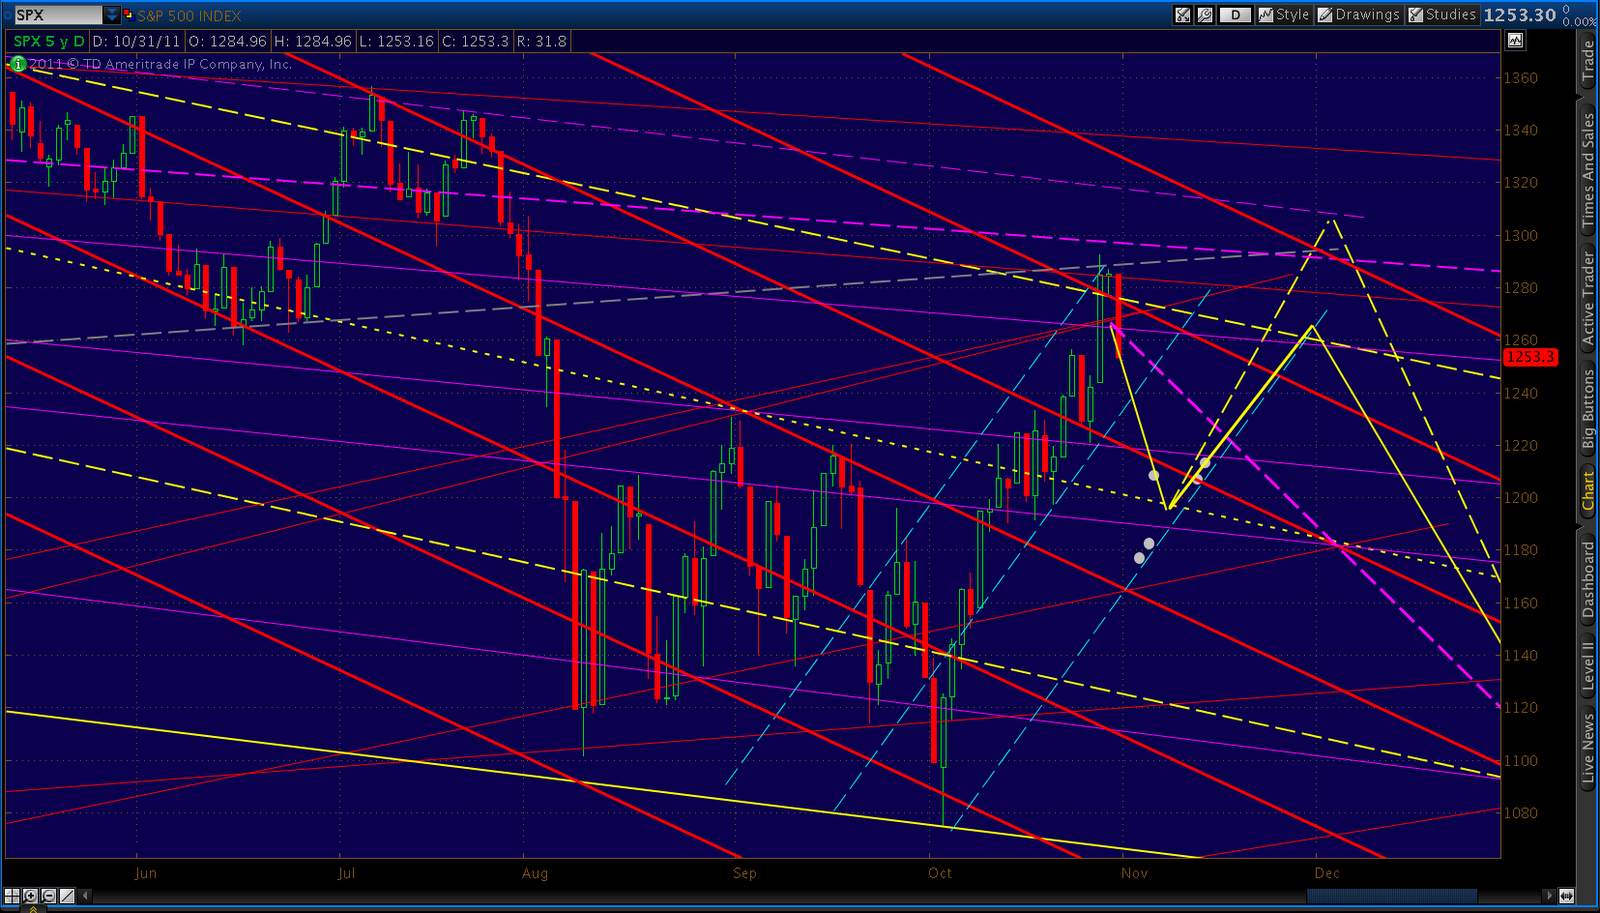
Heading off for the weekend and probably won’t get to post. One last thought… in looking at the rising wedge we’re in, the apex seems to be around 1340-1350. Wedges can and do expand (as this one has, many times). But, breakouts typically occur around the .66 mark, which in this case would be about the 1250-60 level (there’s that number, again.)
Veering off into hunch-land here, but I can’t get over the feeling that everything after 1256 has been a throwover, and this last leg’s days are numbered. Maybe this weekend, investors will have a chance to more carefully evaluate the increased risk to the financial system of the “miraculous” Greece/ECB deal.
Have a great weekend, everyone.
UPDATE: 10:00 AM
Continuing the train of thought from below… If the channel lines below were to dominate, it raises some interesting questions with respect to the 2011 v 2008 analog.
Note, for instance, that the upper most channel line ends up at 1260 or so, a level that would have been perfectly consistent with the rising wedge terminus that the 2008 analog initially targeted (see the analog chart below, the purple rising wedge). Not only that, it was the right target in the right time frame if the analog meant anything.
When I say “ends up,” I mean that it makes some potentially significant intersections there. For one, it’s the .618 from the 1370 top, not to mention the June 16 bottom — considered pretty significant resistance once upon a time. That turned out to be the neckline for the huge H&S; pattern that, when it broke, threw us into a bear market. Last, there’s a potential channel from our Sept-Oct lows (dashed lines) that’s still waiting for some touches on the lower line. If you extend out the likely lower line, it passes through that same point.
What would that imply for yesterday’s high? I haven’t a clue. But, I did notice some more interesting facts about Mr Big. For one, it’s the .786 from the July 1356 top which, as Mitchkeller correctly points out, might have been our conventional top. It also lines up with what was the neckline (yellow, dashed) from the original ginormous H&S; pattern. And (drumroll please) it also intersects with the fan line (purple, dashed) from 2007 that passed through the Feb 18 1344 high.
Remember this line? I first noticed it on May 5 when it stopped a plunge off the May 2 top [See: The Trend Line That Just Won’t Quit.] I’ve since referenced it at least a dozen times because, well, it just won’t frickin quit. Since Feb 18, it’s legitimately stopped 28 market moves of both bullish and bearish persuasion. That’s 28 out of about 170 sessions since the first crack in the bull market, roughly 16.5%!
Call me crazy, but a fan line that’s stopped 16.5% of the market moves in the past whatever timeframe is worthy of our attention. It’s entirely possible that yesterday was the most amazing stop of all. A stop for all time. A stop that makes young girls swoon, and old men grow misty-eyed just talking about it. And, we were there. We were there.
p.s. There’s a catch (isn’t there always?) If this fan line really is that amazing, then I’m obligated to see if it plays out in other time frames and price levels. And, it does.
One of the sister trend lines (of the same slope) is up above, where it connects the May 2 and the July 7 tops. That would seem to leave the door open for a further advance. If the FLTJWQ doesn’t stop this advance, I’d bet dollars to doughnuts its big sister does.
And, while I’m pulling things out of my ass, here’s an interesting idea. Suppose we do a 100-pt dipsy doodle like we did starting Feb 22 and go down to better form the channel off the Sep and Oct lows?
There are several potential targets, including fibonacci’s and channel lines both. Something to think about.
UPDATE: 3:00 AM
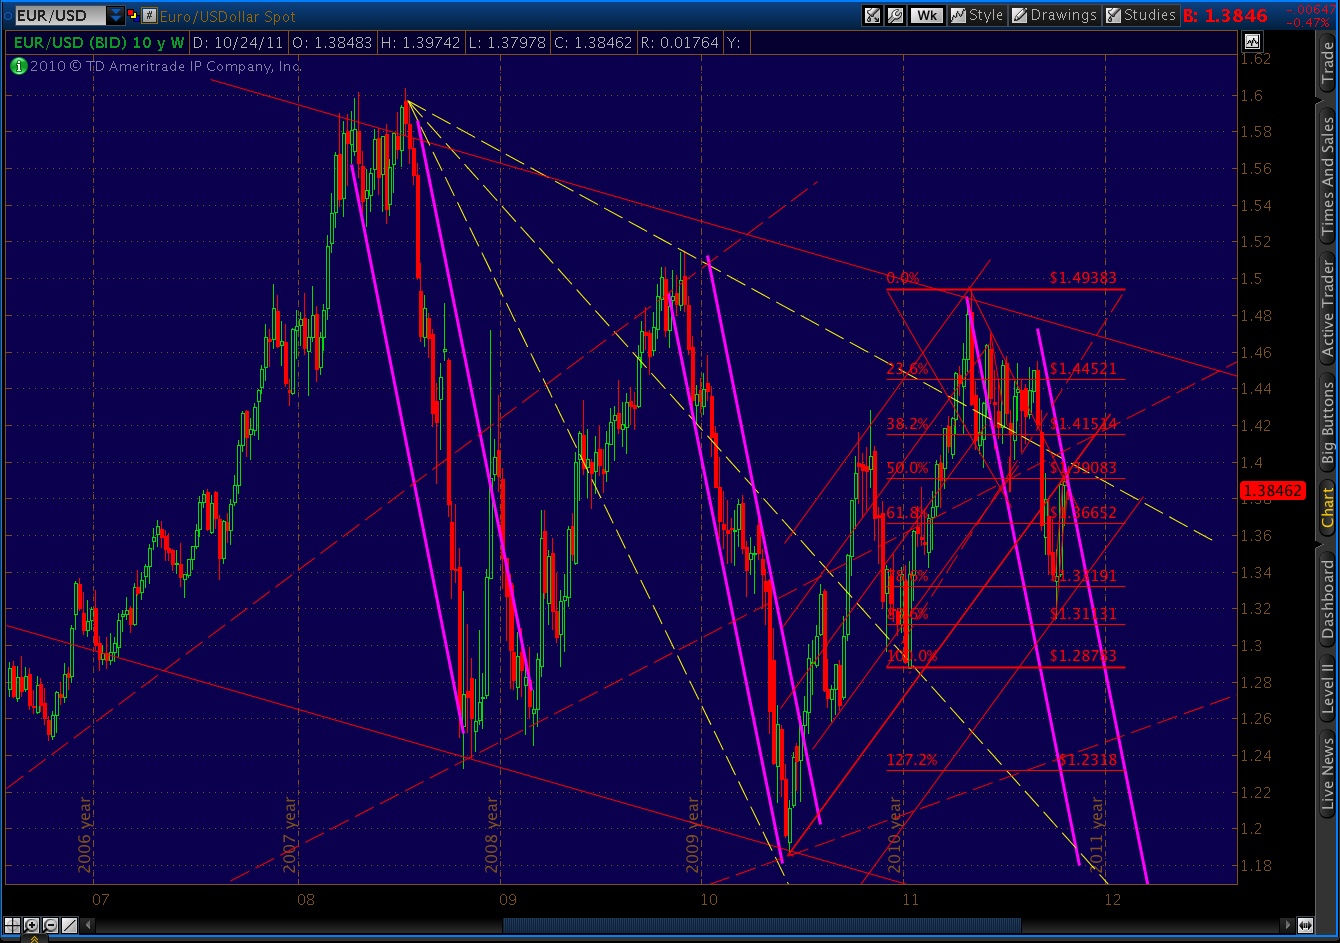
Another way of looking at things… Back in 2008, the TL off the 2007 high carried a lot of weight.
Here’s the equivalent line in 2011:
Just for grins, I’ve drawn a bunch of parallel lines. Looks too good to be a coincidence, no?
ORIGINAL POST:
Ah, the good old days. Day 121 was so simple, so uncomplicated. We were a little ahead of ourselves, but a nice little downturn was in the offing and all would be good, again.
What a difference 4 days makes. Either the 2011 v 2008 is over, or we’re going through the kind of divergence we saw around day 85. Here’s the latest:
The purple rising wedge is what I expected, based on a continuation of the analog. The yellow rising wedge is where we find ourselves, instead.
Note that day 151 was the last peak in the 2008 pattern. Day 151 in this pattern would be around December 1. So, given that we’re nudging the .786 on day 125, and only expected to reach the .618 by day 151…what gives?
I can make a pretty good case for 1307 (the .786 Fib) being the top. It would align pretty nicely with a trend line coming off the May 2 and July tops (the dashed purple line.) And, that intersection occurs around the first of December. But, and it’s a big but, we’re only 15 points south of that level today. Could we really take over a month to add 15 points?
Not likely, unless this entire wave 2 move up was only the A leg, and we have significant B and C waves to come. I’ll defer to the EW experts among us, who say that scenario is highly unlikely (although chime in, if you like.)
A more likely scenario is that the pattern will continue, but in a different time frame — namely, uh, now. If we continue ramping like we did today, those 15 points will arrive in the next 15 seconds and Wave 2 will be kaput. We can resume partying like it’s 1929.
The bulls, of course, would argue that we’ll keep going like this for another month, piling on a zillion points to the upside because the eurozone problems are fixed and consumers are spending money again (“fixed” being a gross exaggeration, and money being spent via credit cards — but that’s just me being a pessimist.)
Stay tuned.