

UPDATE: 3:50 PM
Big rally on light volume. Sure seems like SPX wants to fill last Thursday’s gap at 1166.58.
UPDATE: 1:10 PM
Talk about a party pooper…

UPDATE: 12:55 PM
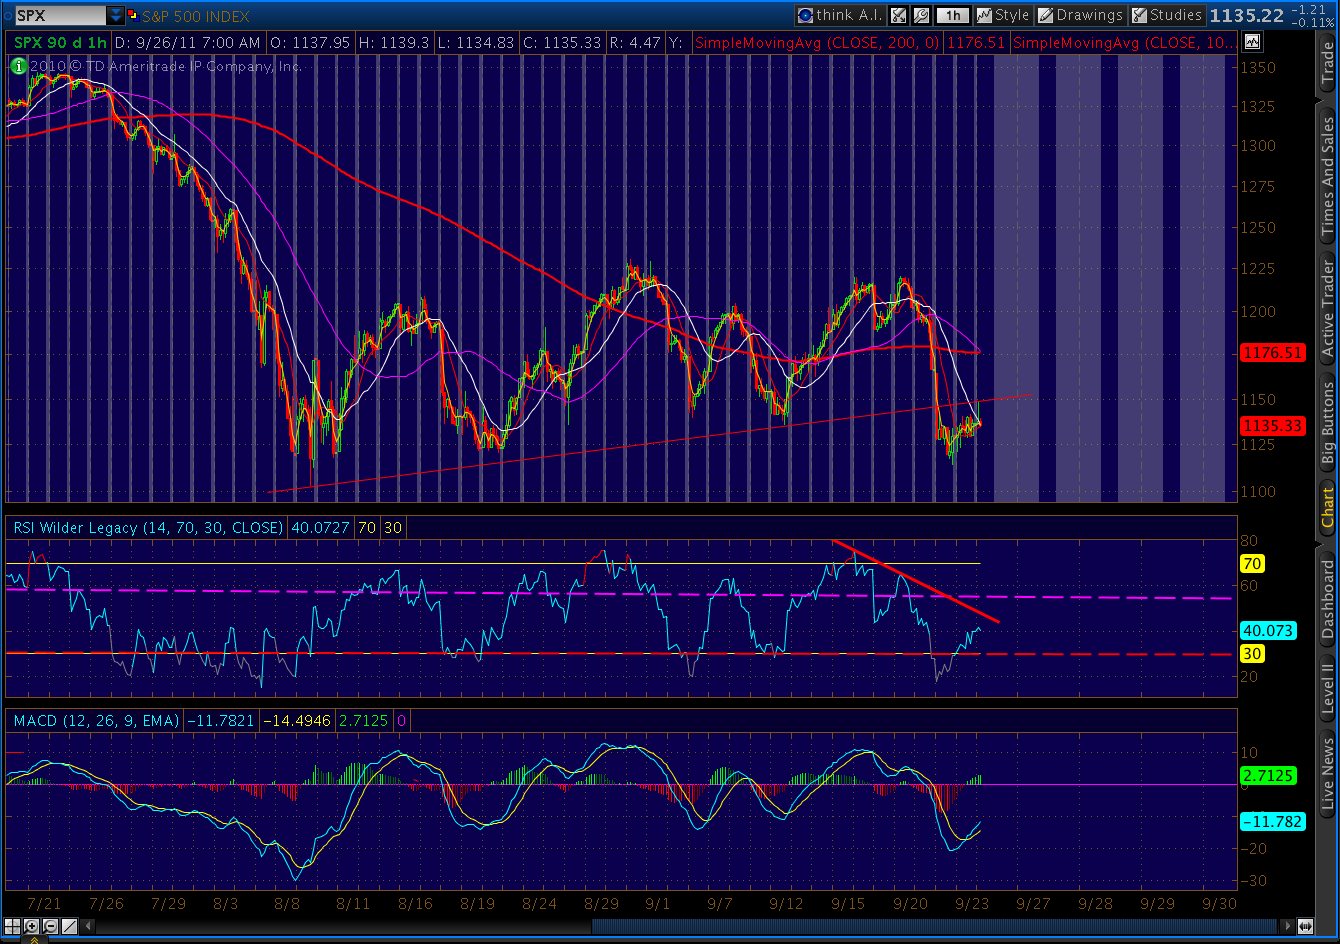
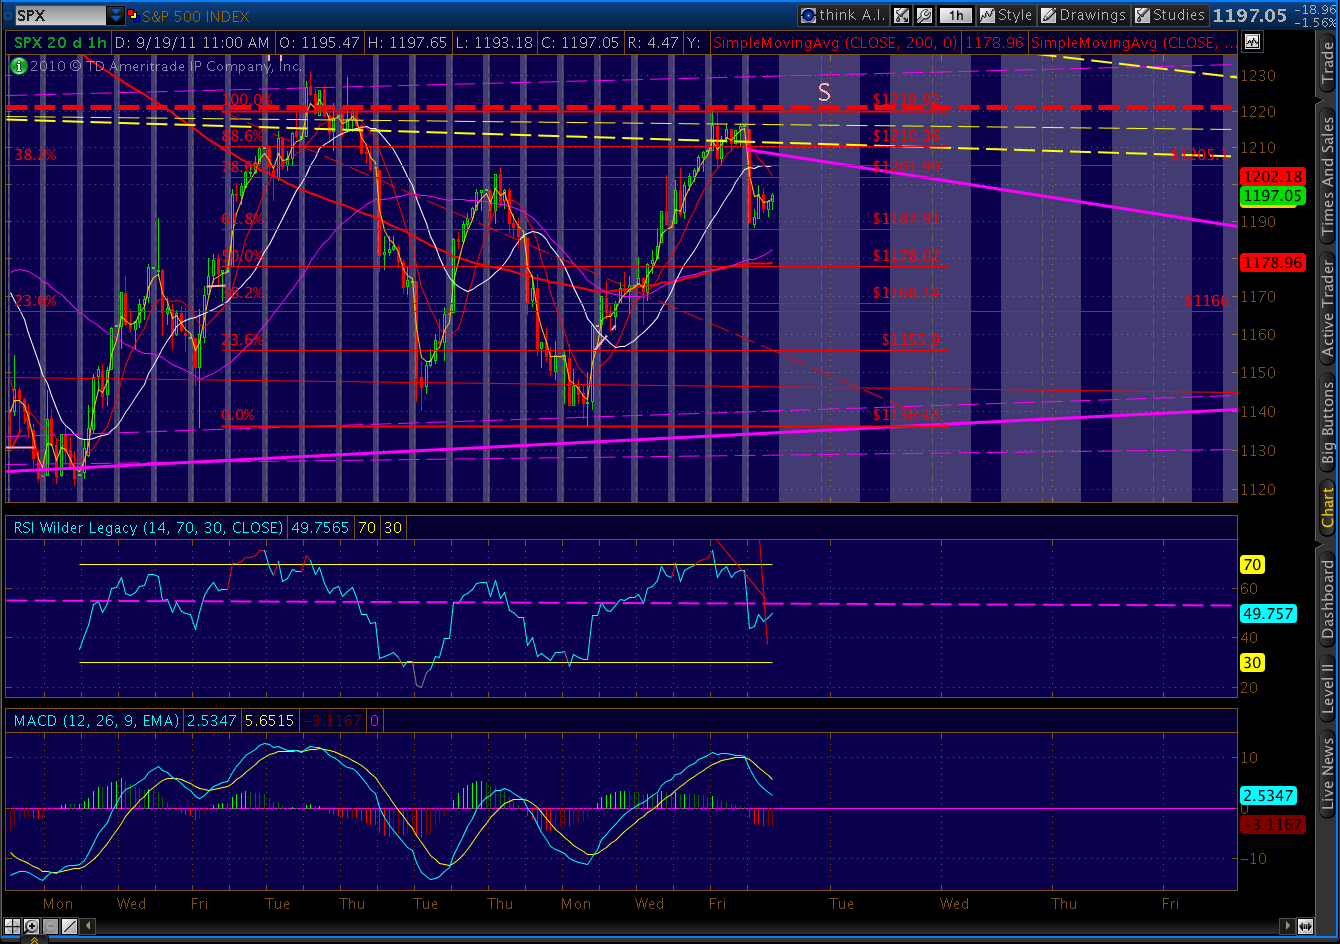
The 60-min RSI still holding to its trend line.

UPDATE: 12:40 PM
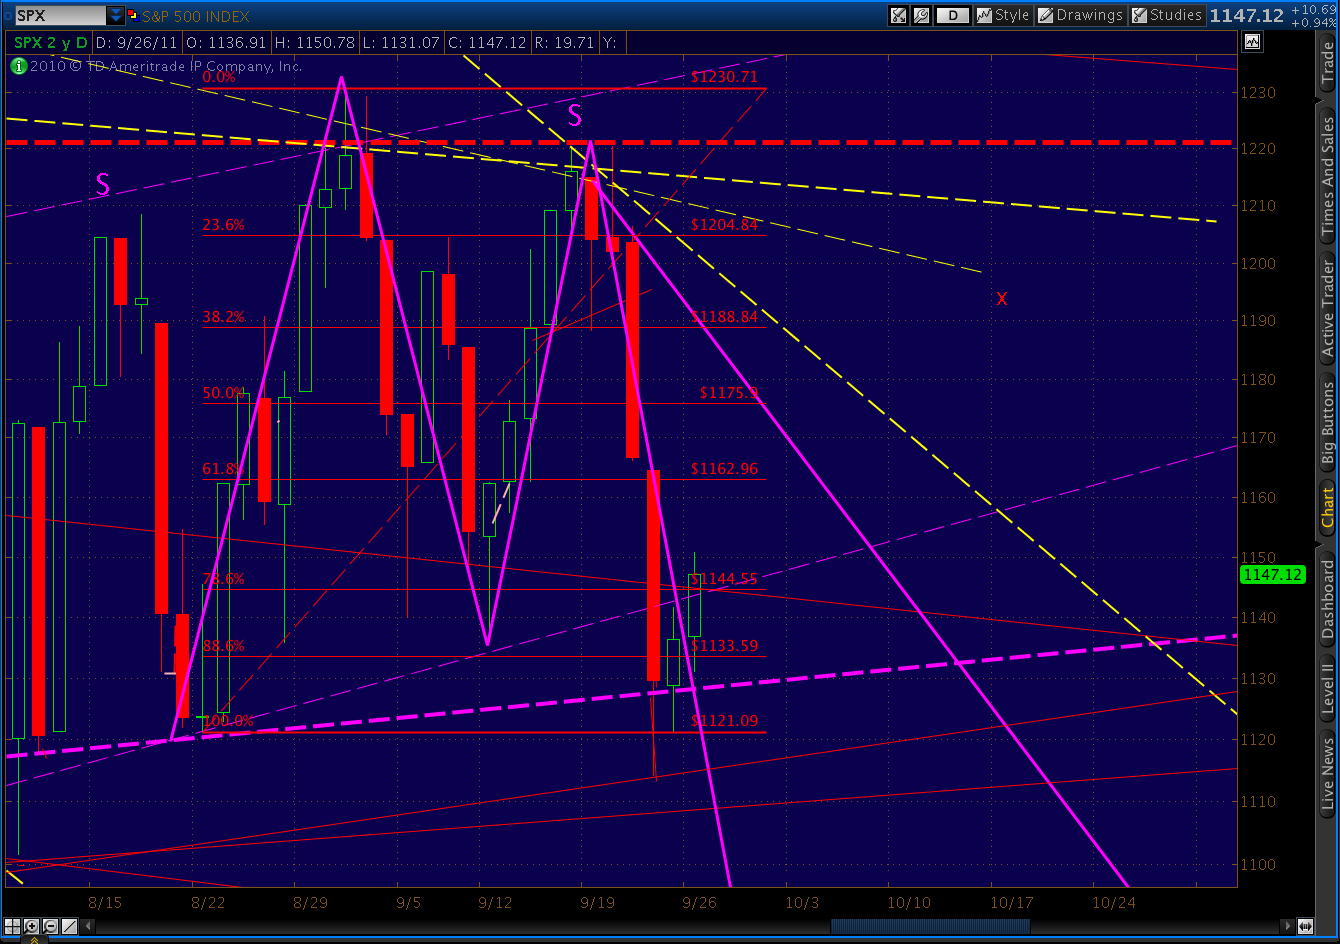
As has happened so often these past couple of months, we overshot the harmonic target. However, it looks like just that, an overshoot, and nothing more.
Taking a look at the bigger picture, the intersection of fan lines 5 and C should limit this to an intra-day spike that will leave a very bearish looking candle on the day.
UPDATE: 11:25 AM
Just about there…

If I’m not mistaken, this should wave (iii) of [v] of Minor 1 down.
Here’s a picture of the 60-min chart. Note the RSI trend line, also calling for a reversal here.

UPDATE: 10:55 AM
We’ve touched the lower bound of the bear flag channel, officially completing the backtest. But, we’ve also traced out 3/4 of a bat pattern, meaning we might go back up and bag 1144-1146 before heading down. I show this morning’s 1148 to 1131 as a full five waves down, and the bump back up as A and B of the A-B-C, with C being the rebound to 1146. That should be an excellent entry for the next leg down.

UPDATE: 9:10 AM
Backtest completed on SPX; should get going to the downside, now.
ORIGINAL POST: 2:35 AM
Starting out with a quick look at the tech picture on gold (GC.)
First, check out the harmonic picture on the daily chart. GC completed a crab pattern (purple, since 8/25) at the 1.618 extension of the XA leg. The target was 1570.20, and we just overshot that by 12.

However, there’s a larger bat pattern (in yellow) at work that started way back on July 1 at 1478.30. It should extend to at least the .886 Fib level at 1528.40, although it could turn out to also be a crab with a 1.618 extension. Either is possible with a .50 AB retrace (of the XA leg.)
If I’m crazy enough to try and catch this falling knife (which I’m not) I can look at the RSI for confirmation. Check the red trend line on the daily chart, just up ahead of the falling RSI. It would certainly argue for a turn in the very near future.

Here are the shorter term charts. The 60 min and the 15 min look good for a reversal, and the 5-min actually shows a slight divergence.
 |
| 60-min |
 |
|
| 15-min |
 |
| 5-min |
Don’t usually get such a dynamic test of a theory…. It looks like we’re closing in on the .886 retrace, within 12 now.
The point is that the RSI TL’s are confirming the idea of a GC bounce in the very near future. The .886 at 1528 looks like it would fit well with that forecast.
Naturally, I’d have to point out that the SMA 200 is just up ahead at 1522. And, that we’d likely backtest the rising wedge we just departed (base at 700, ouch!)

I see now we’re within 7 of our harmonic target and 13 of the SMA 200. As I mentioned above, this could turn into a crab and go to the 161.8 XA extension at 1206. At this rate, it probably will!

But, the RSI gives me some confidence that we’re at or very near an interim reversal and that 1206 will have to wait for the time being.
If I were interested, I might try to play a bounce to the next highest fib level or the wedge, from 1535 back to 1572 or 1585. If I were looking to initiate a position but felt I had missed it, such a bounce might represent a good short entry point for the next leg down.


