The approach of the FOMC meeting which begins today has been very good for stocks. There’s nothing unusual about this. Like OPEX dates, stocks almost always rally into such important lines in the sand.
Most investors have lost track, however, of the fact that stocks have usually declined after such meetings. With SPX a few points away from an important Fib extension, will this one be any different?
  continued for members…
I find it fascinating that the .618 retracement of the rise from 2009 is now within 1.18 points of the former 2007 highs. It might mean nothing, but it sure makes my head spin.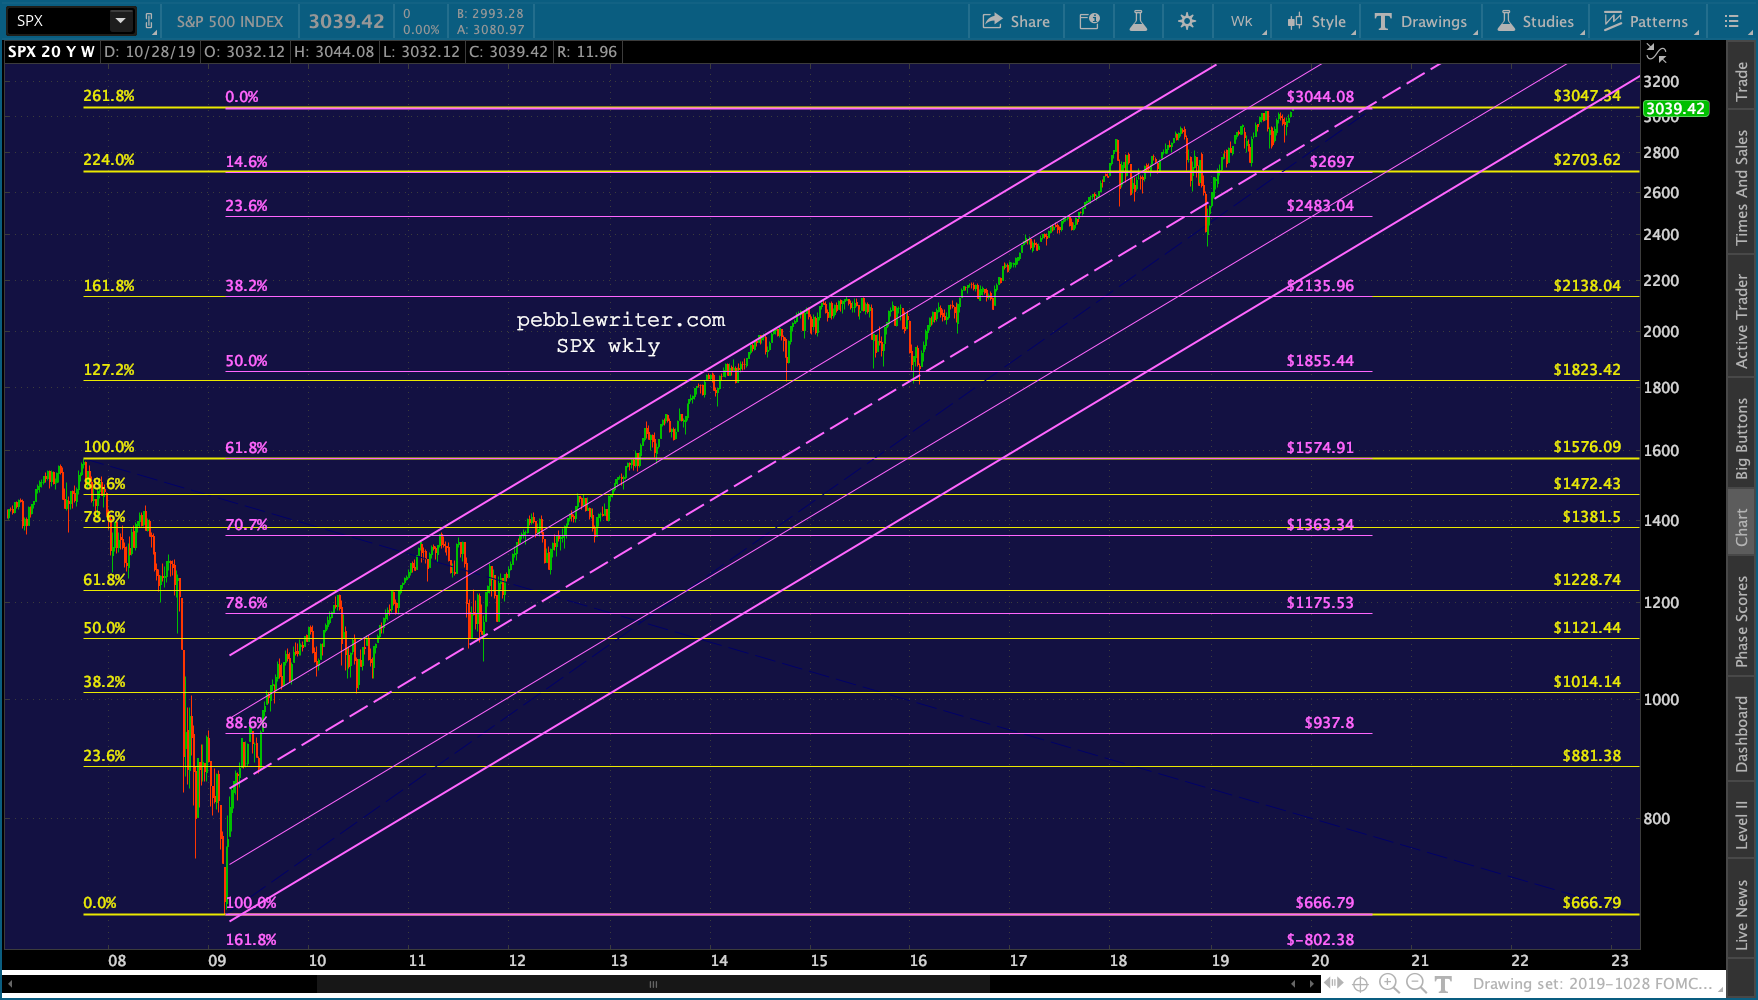 Note that if SPX rose to exactly 3047.34, its .618 would be at 1576.16 versus the 2007 high of 1576.09 — 7 cents away.
  The .618 and former high would match up exactly at 3047.16. Note that the overlap would also include the purple .146 and yellow 2.24 at 2700ish and the purple .382 and yellow 1.618 at 2138.
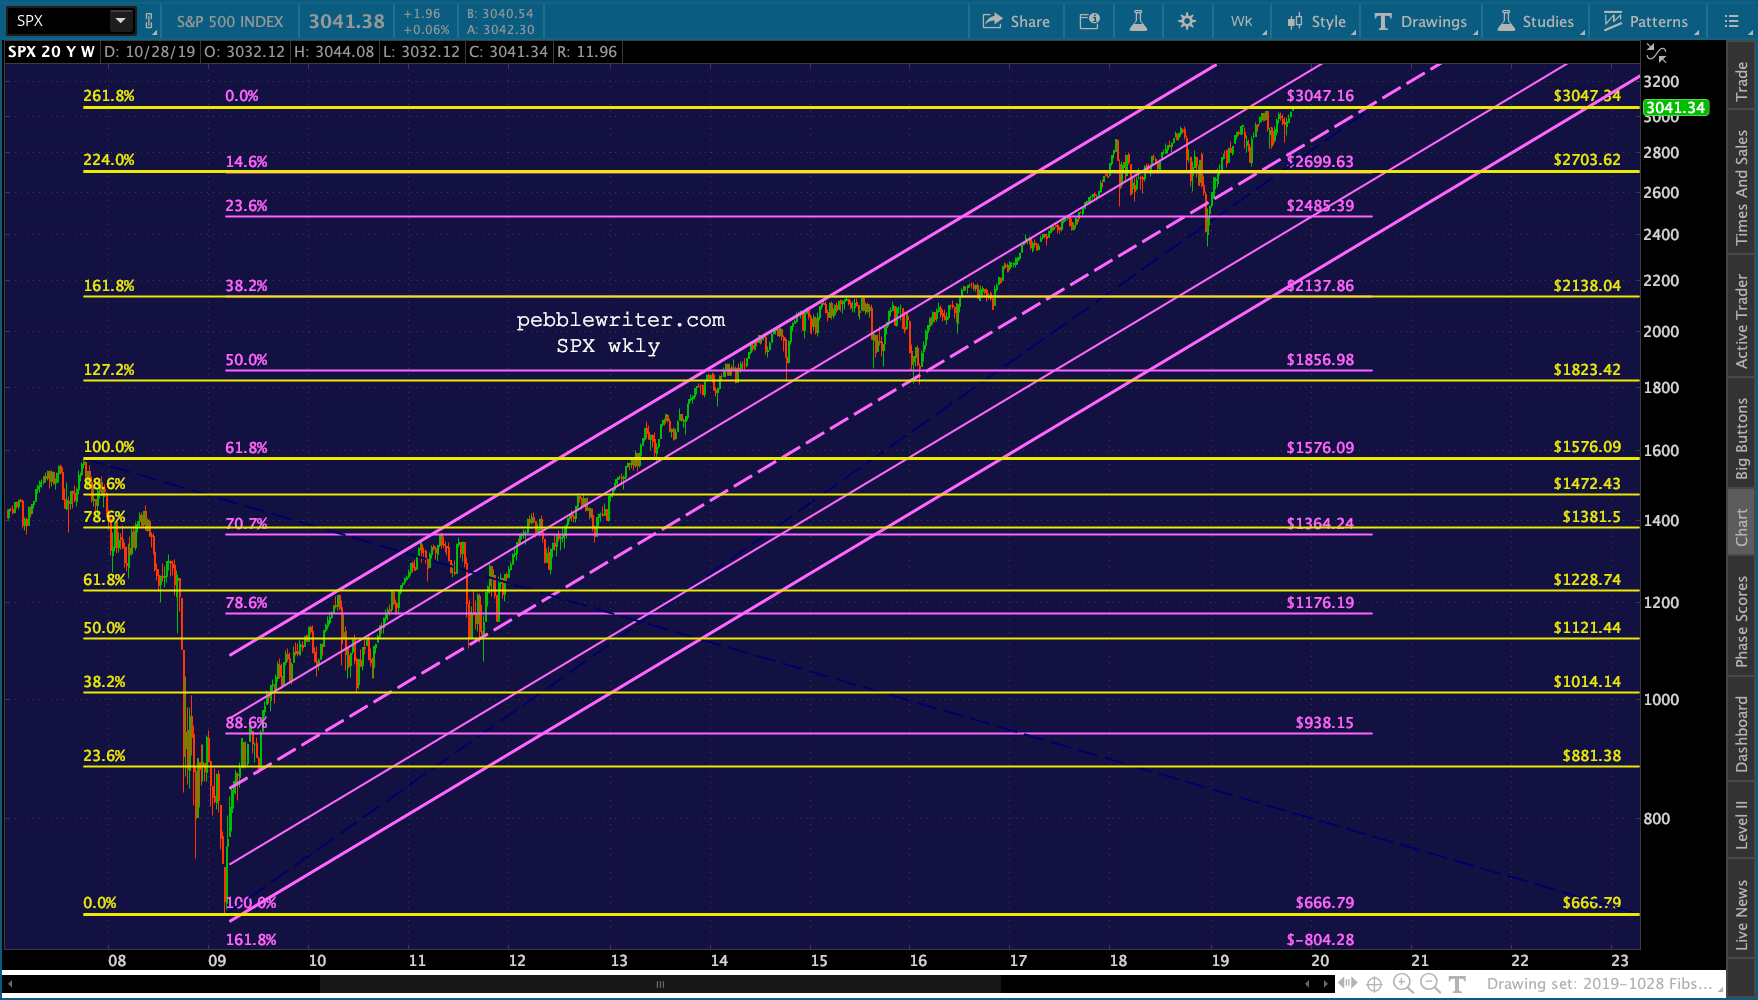 The bigger picture shows that these price levels would clearly fit if markets really melted down. A drop to 2138 would be a 30% from drop from here while a drop to 1576 would be a 48% drop — not quite as large as the 2000-2003 and 2007-2009 drops.
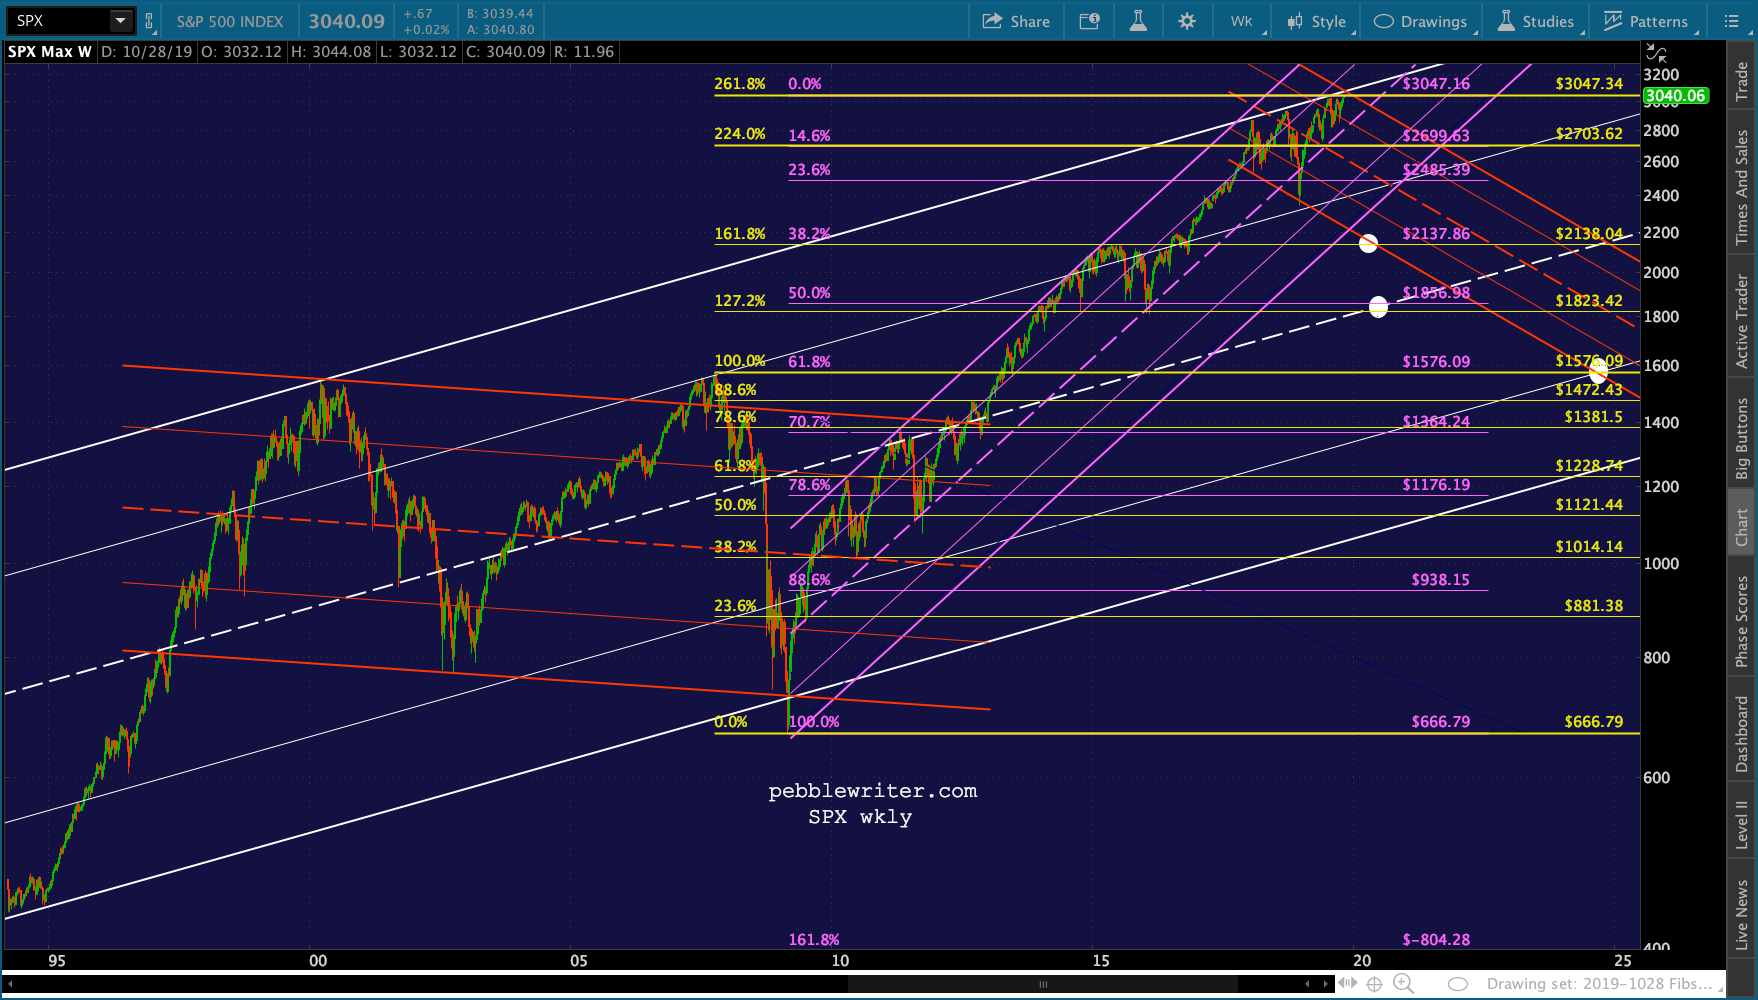
Here’s where we are as the open approaches.
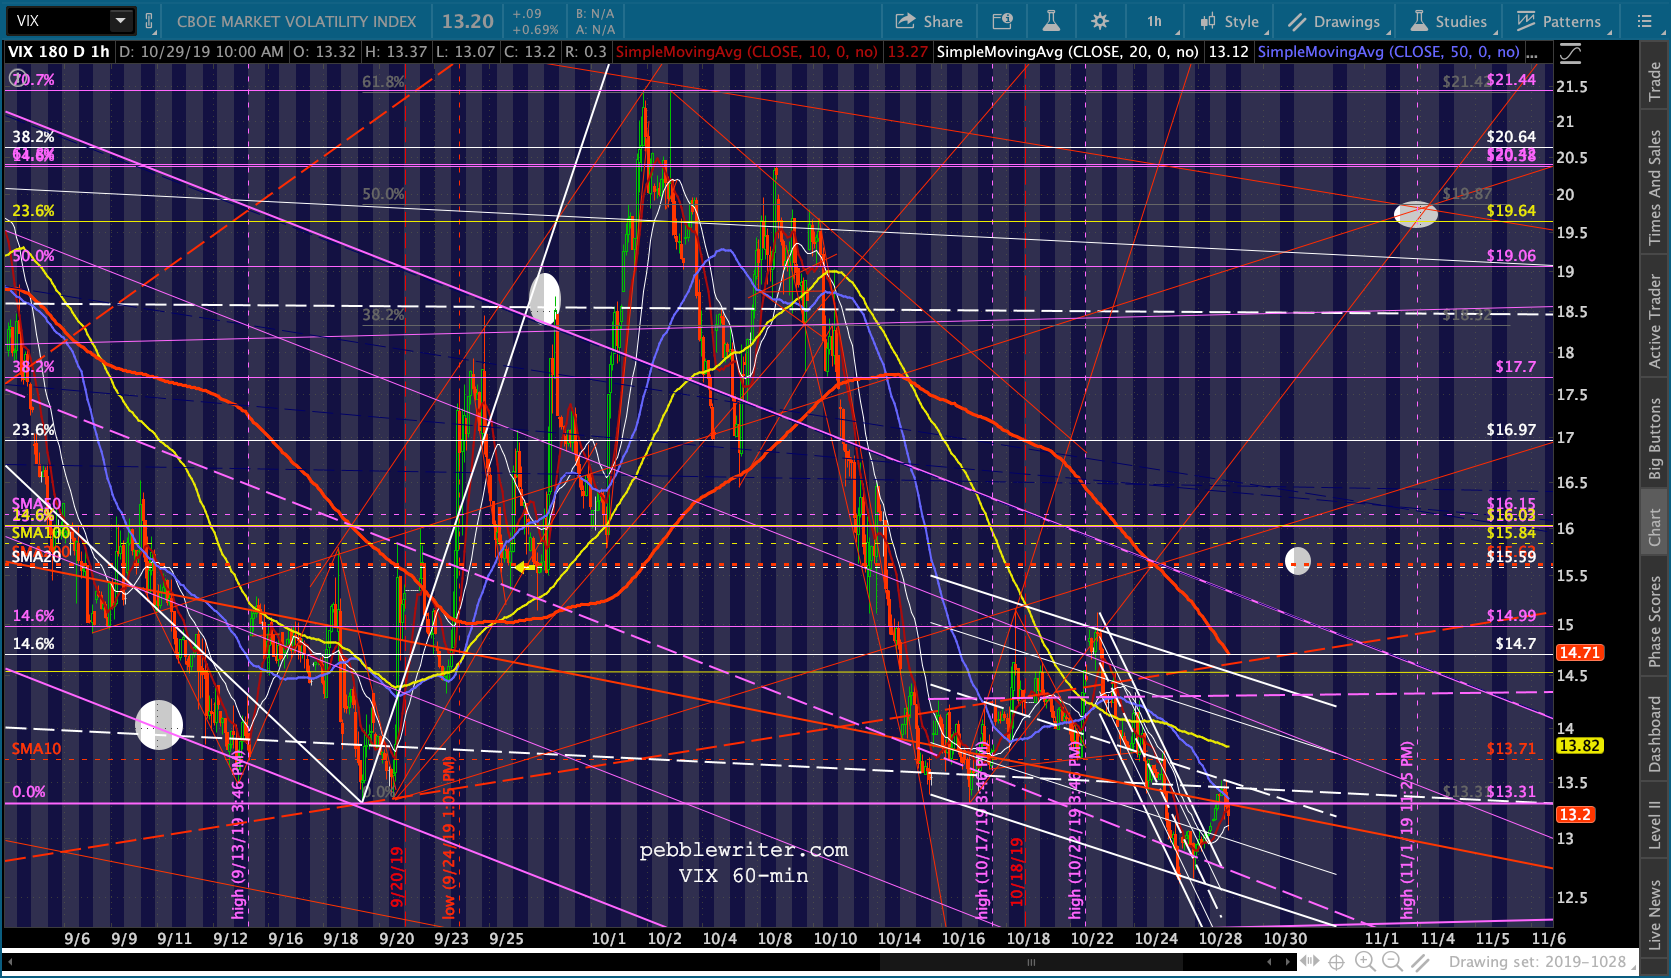
VIX has already left the barn…
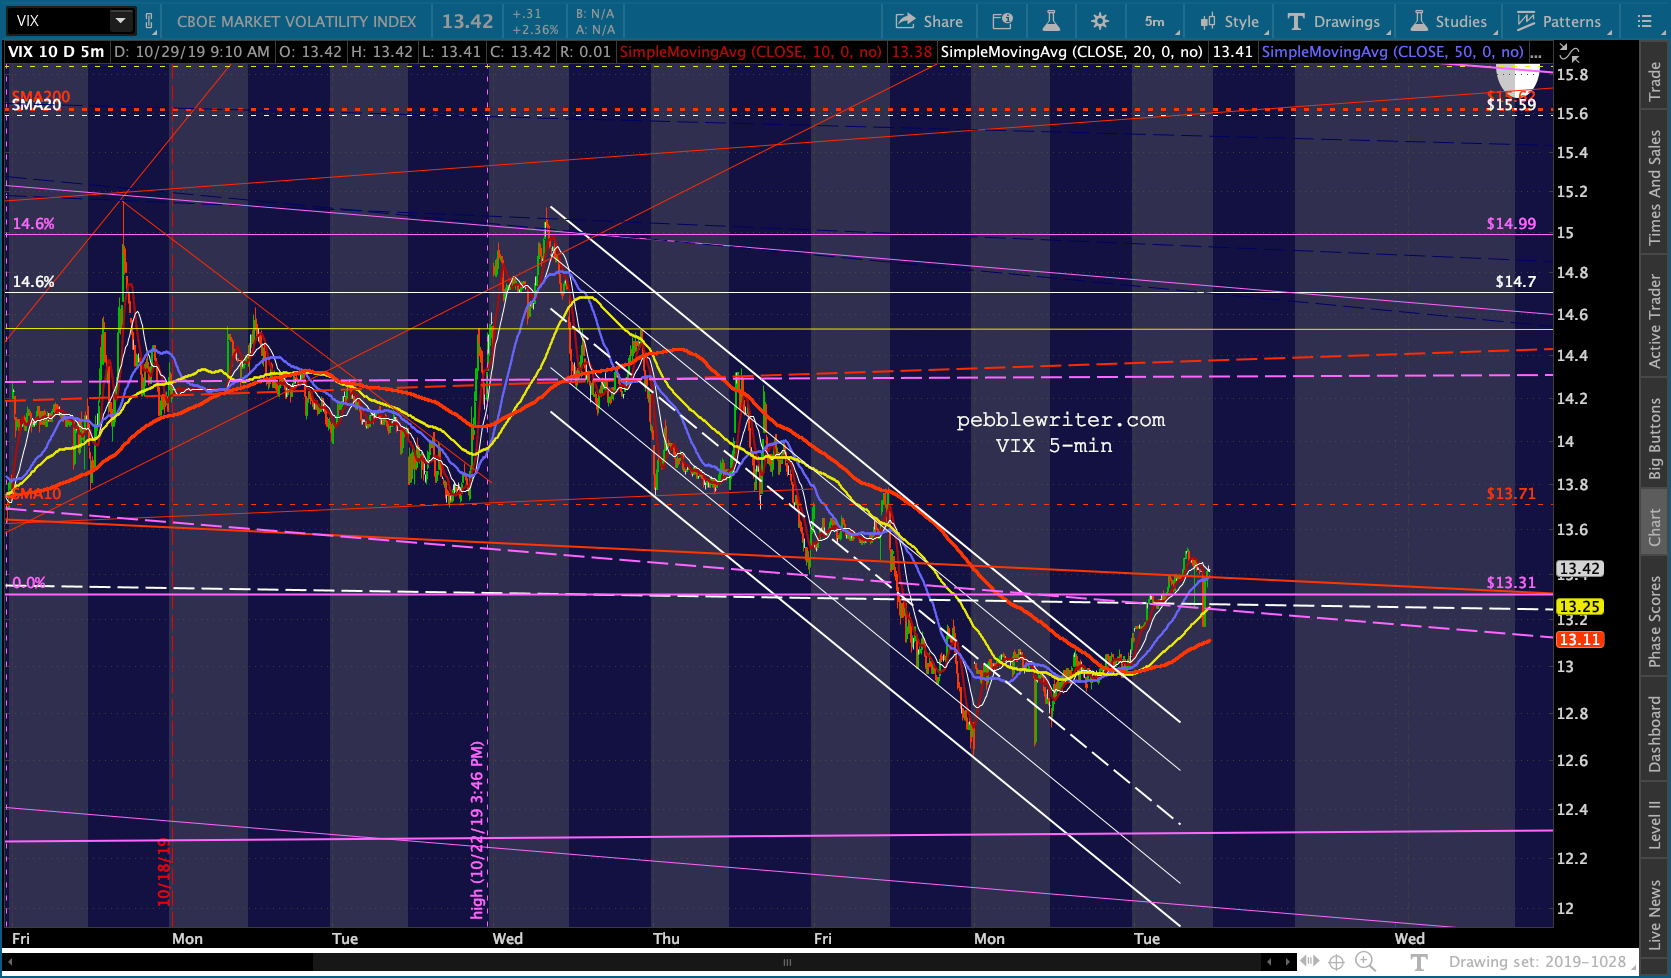 …though it will need to push above its recent lows (13.31) to do much for the bears.
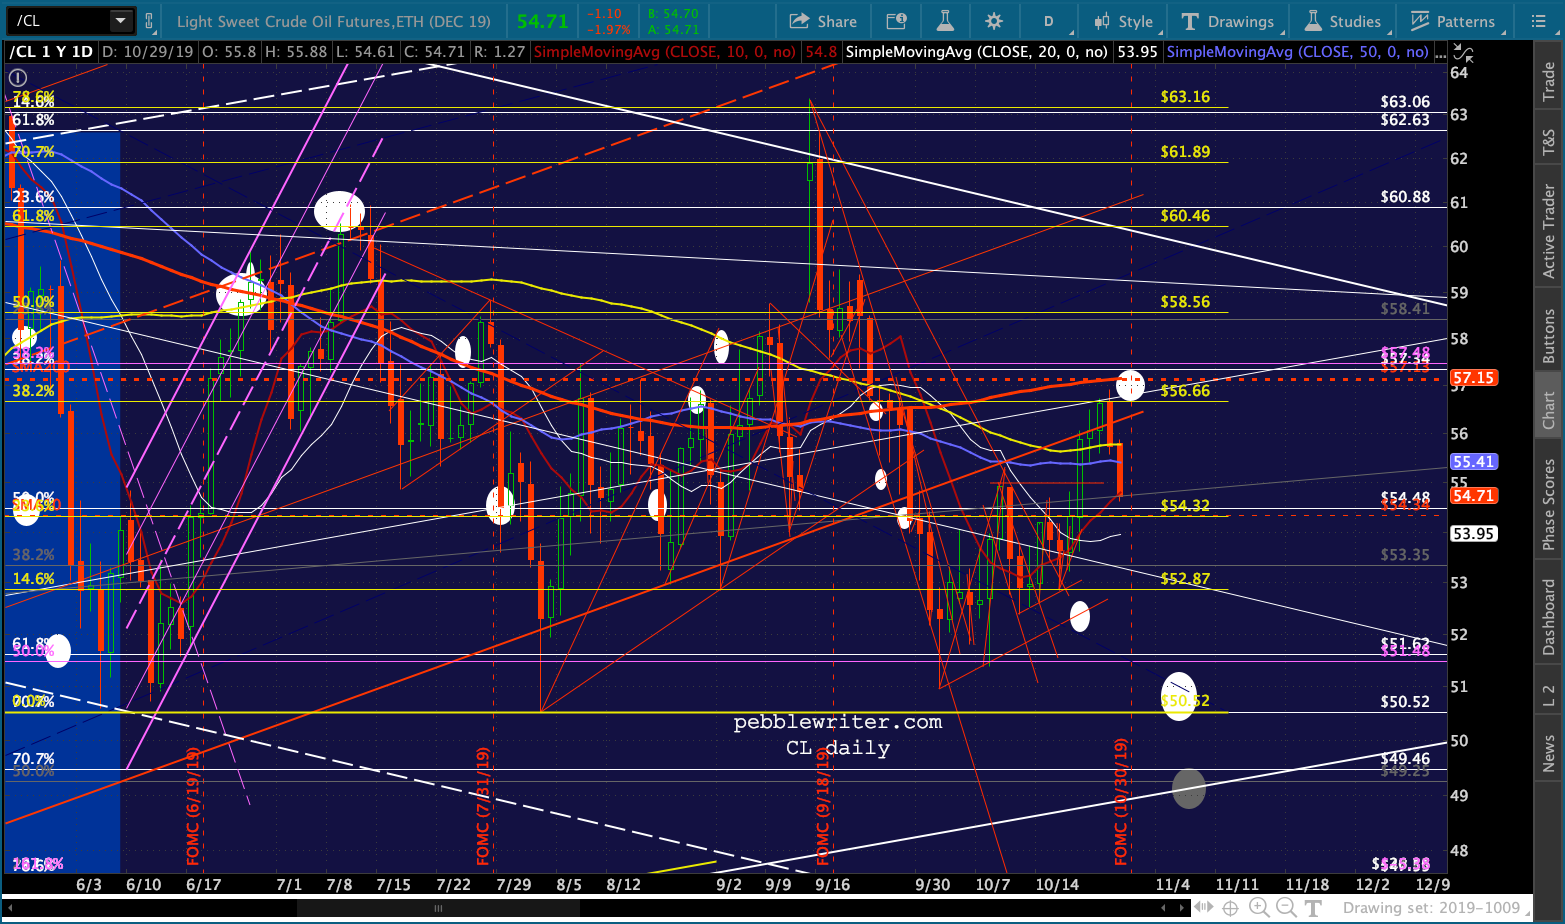
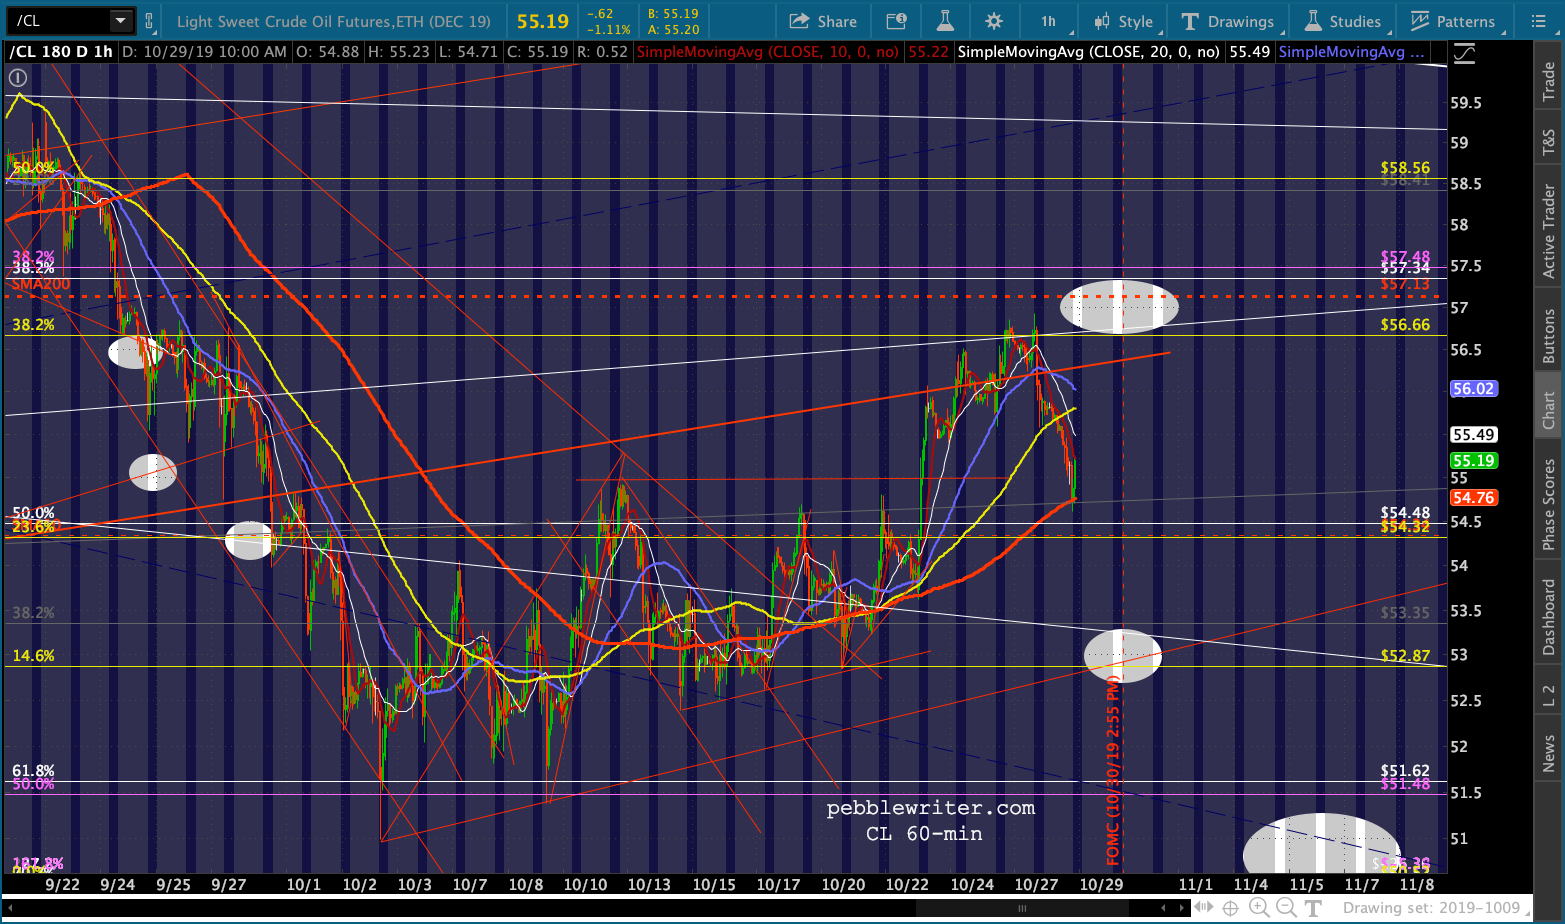
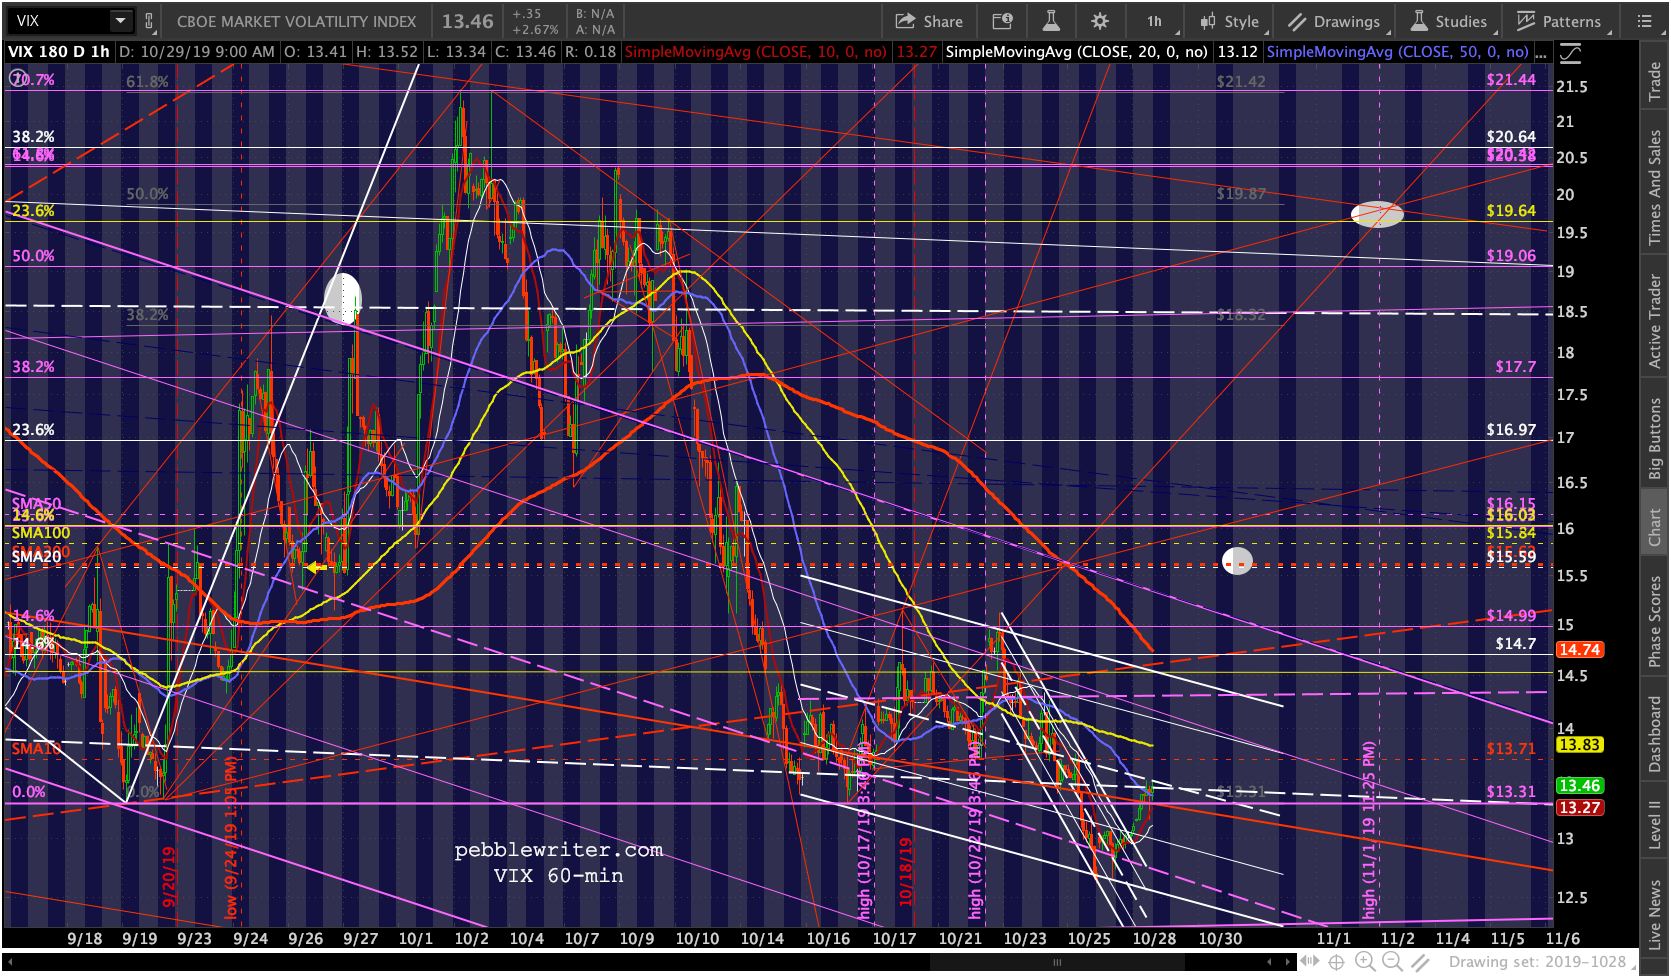 RB and especially CL have are also supporting the bearish case — though remember that both usually ramp into the API and EIA data dumps and we have seen many, many cases of pre-market dips that turn into rips after the opening bell.
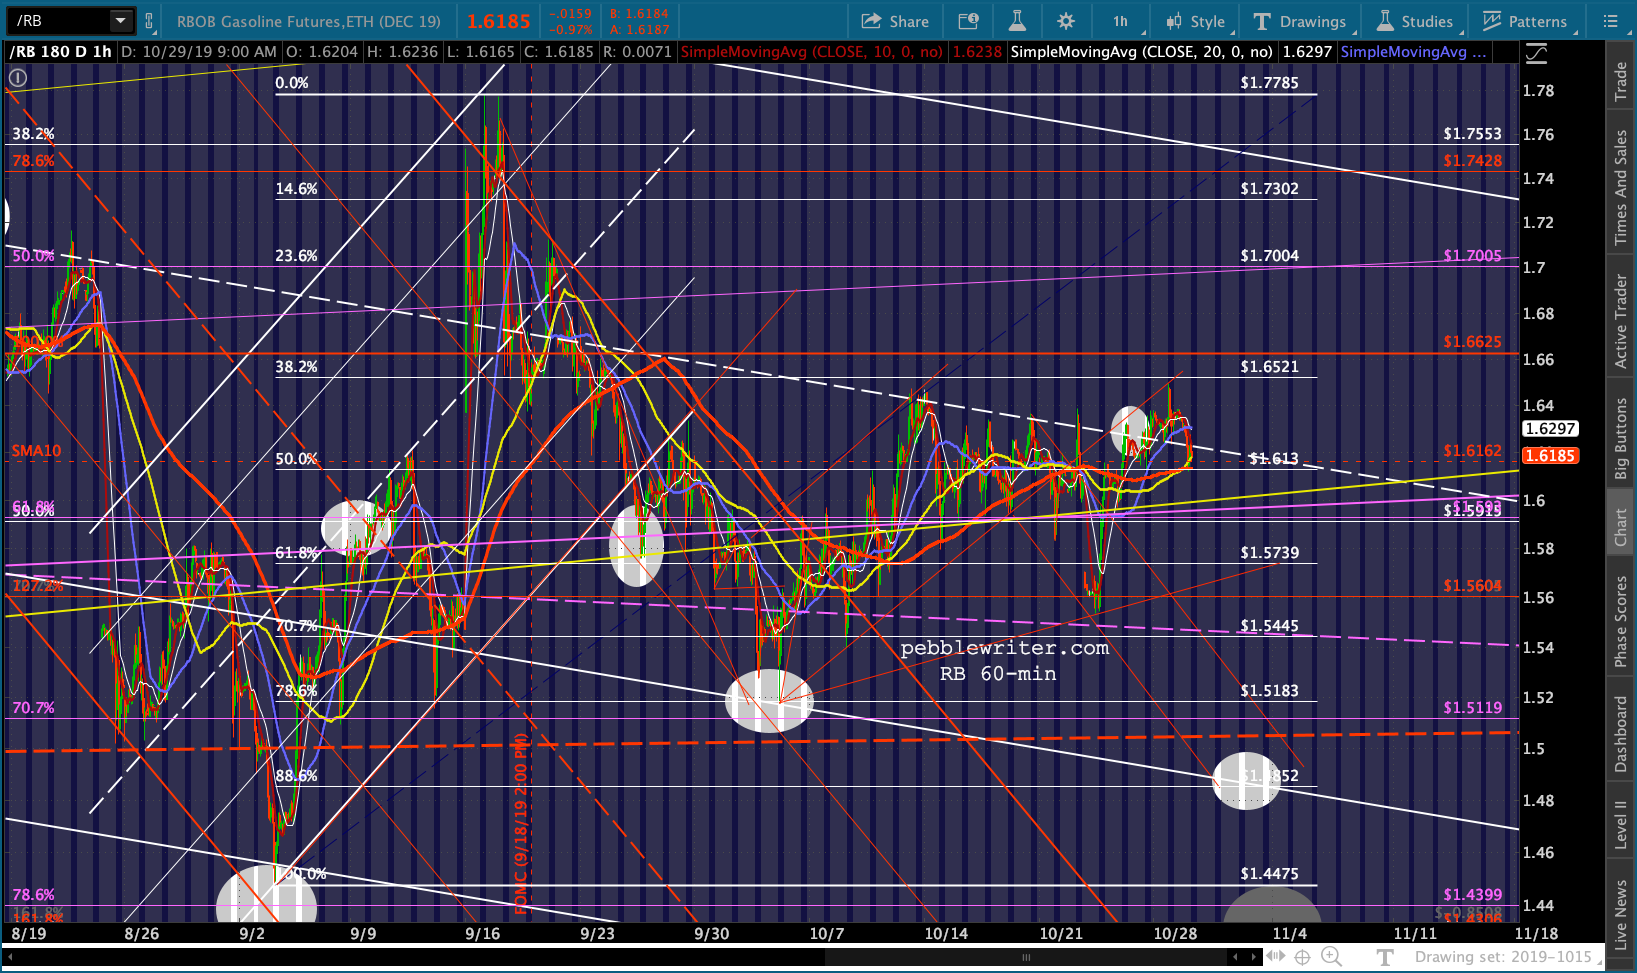
 About the only thing propping up stocks at this moment is USDJPY which could easily continue to threaten to top its SMA200 for the next 24 hours.
 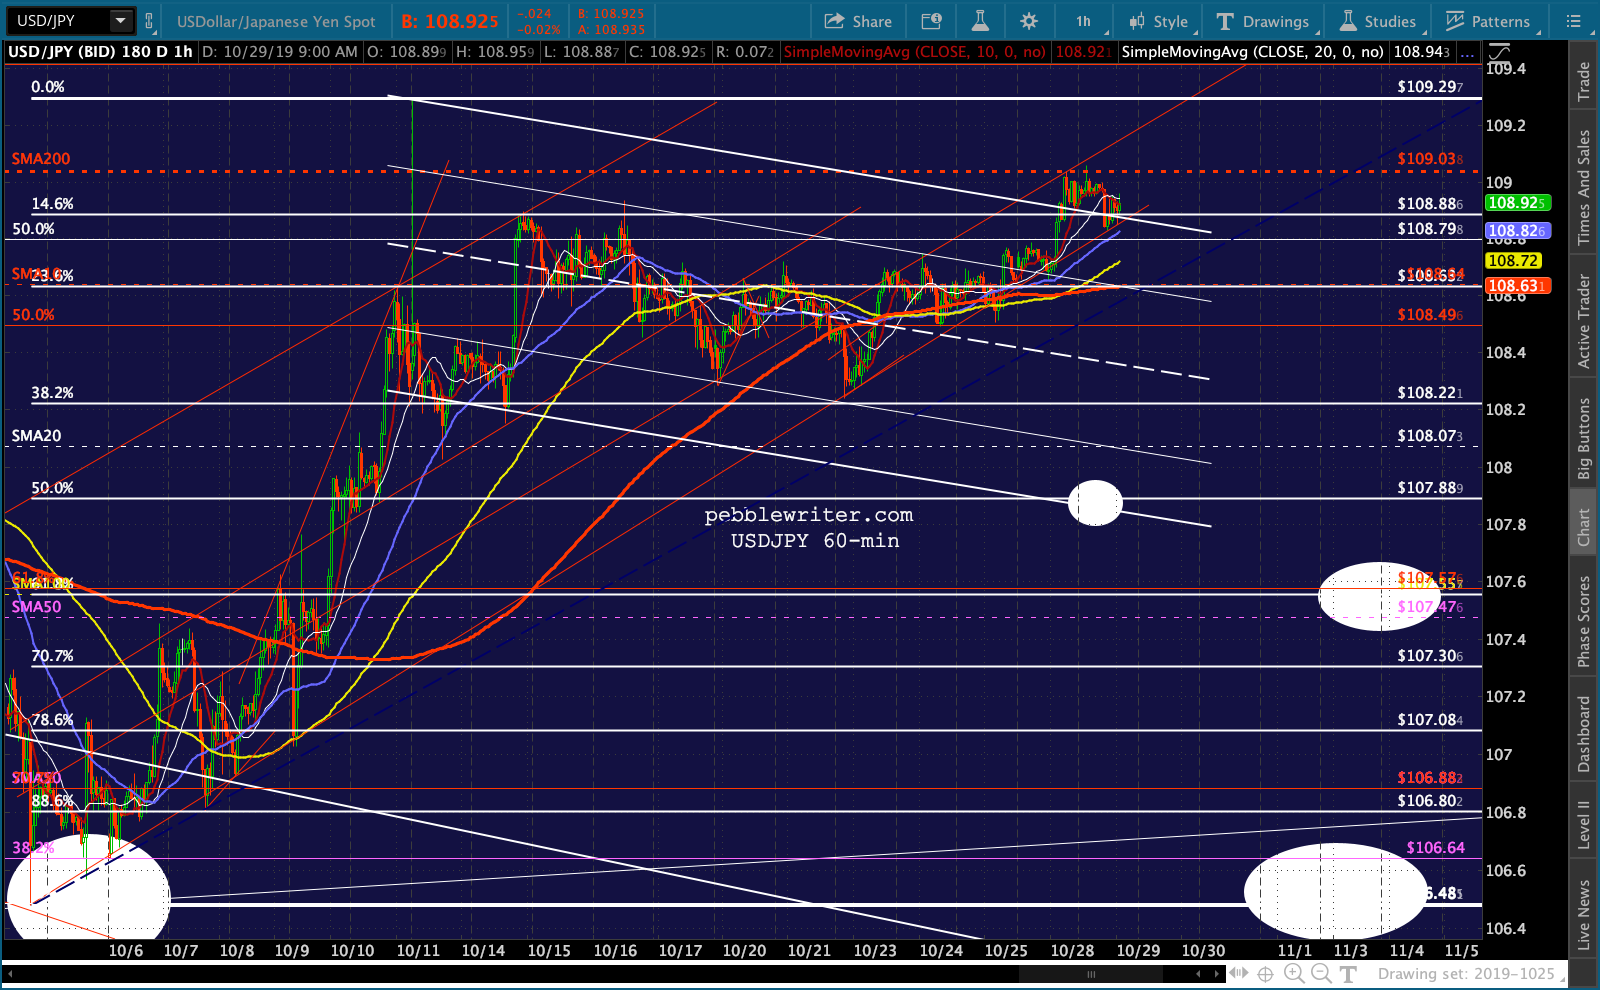 Futures are clinging to a small loss, but I’d be surprised if it tumbles before tomorrow. Keep in mind that although SPX is within a few points of its 2.618, ES’ is way up at 3076.93 — 40 points away.
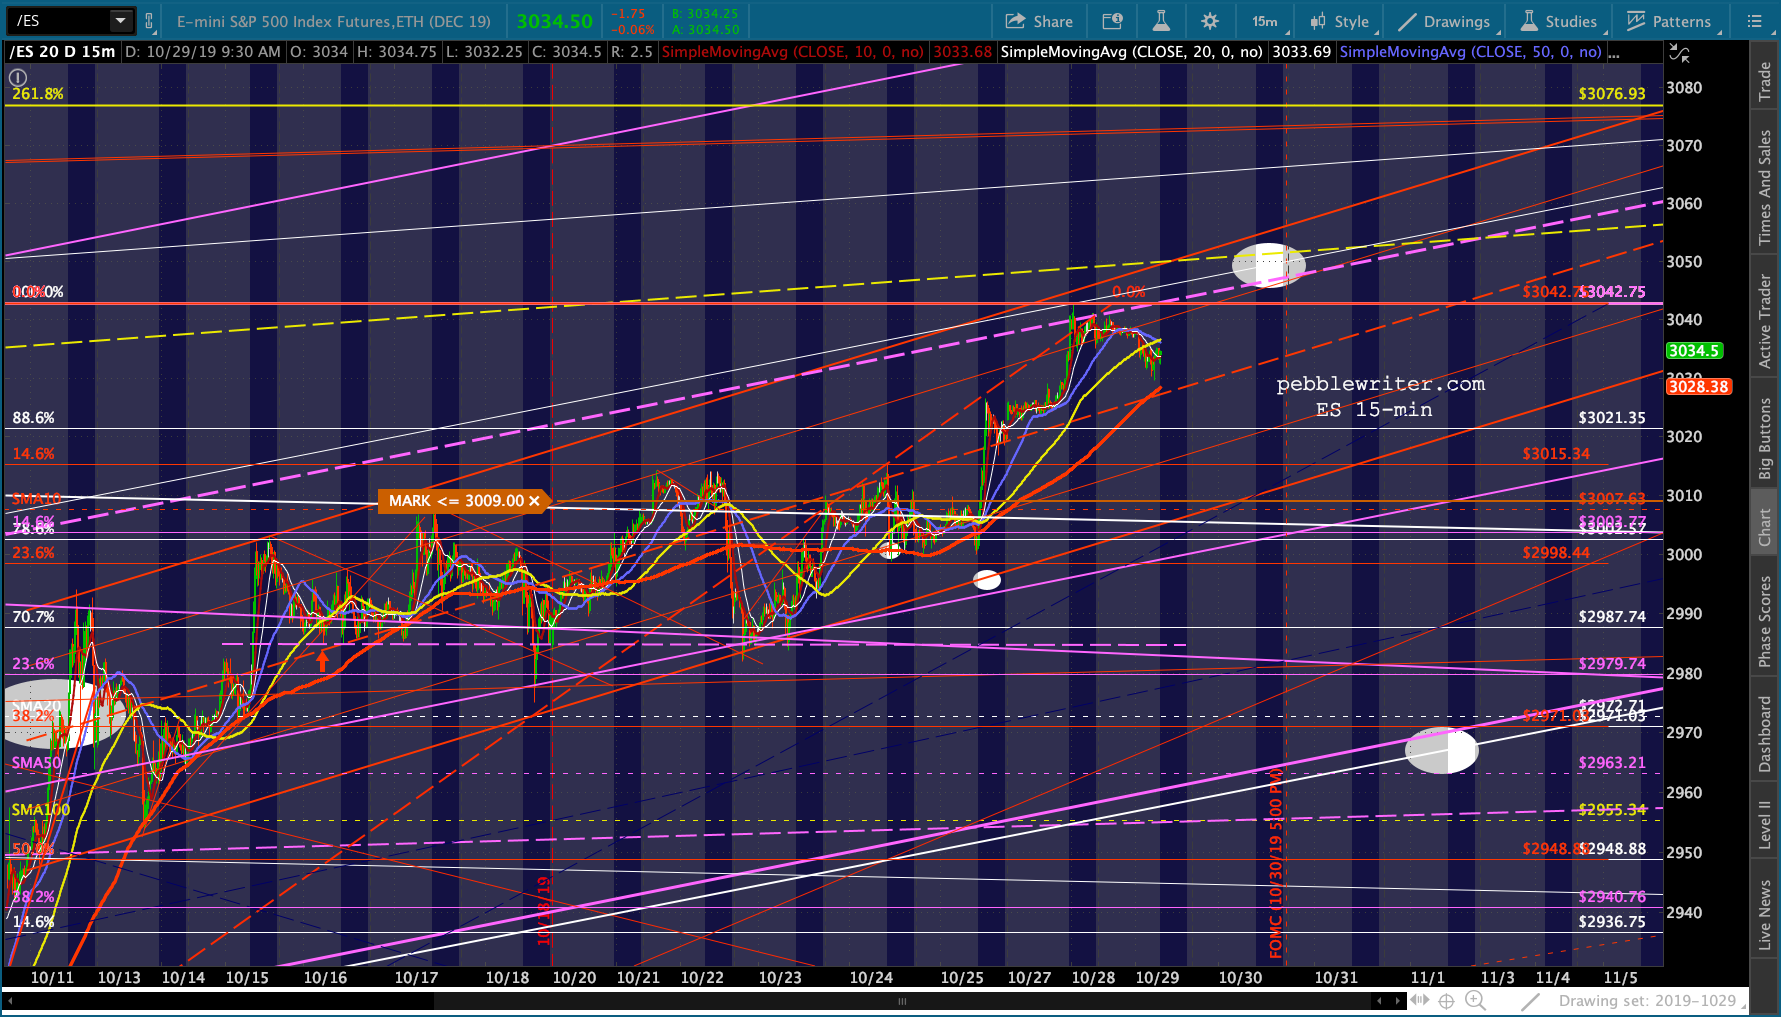 We have consumer confidence and new housing sales coming out at 10am, with much more data due later in the week.
 UPDATE: 10:50 AM
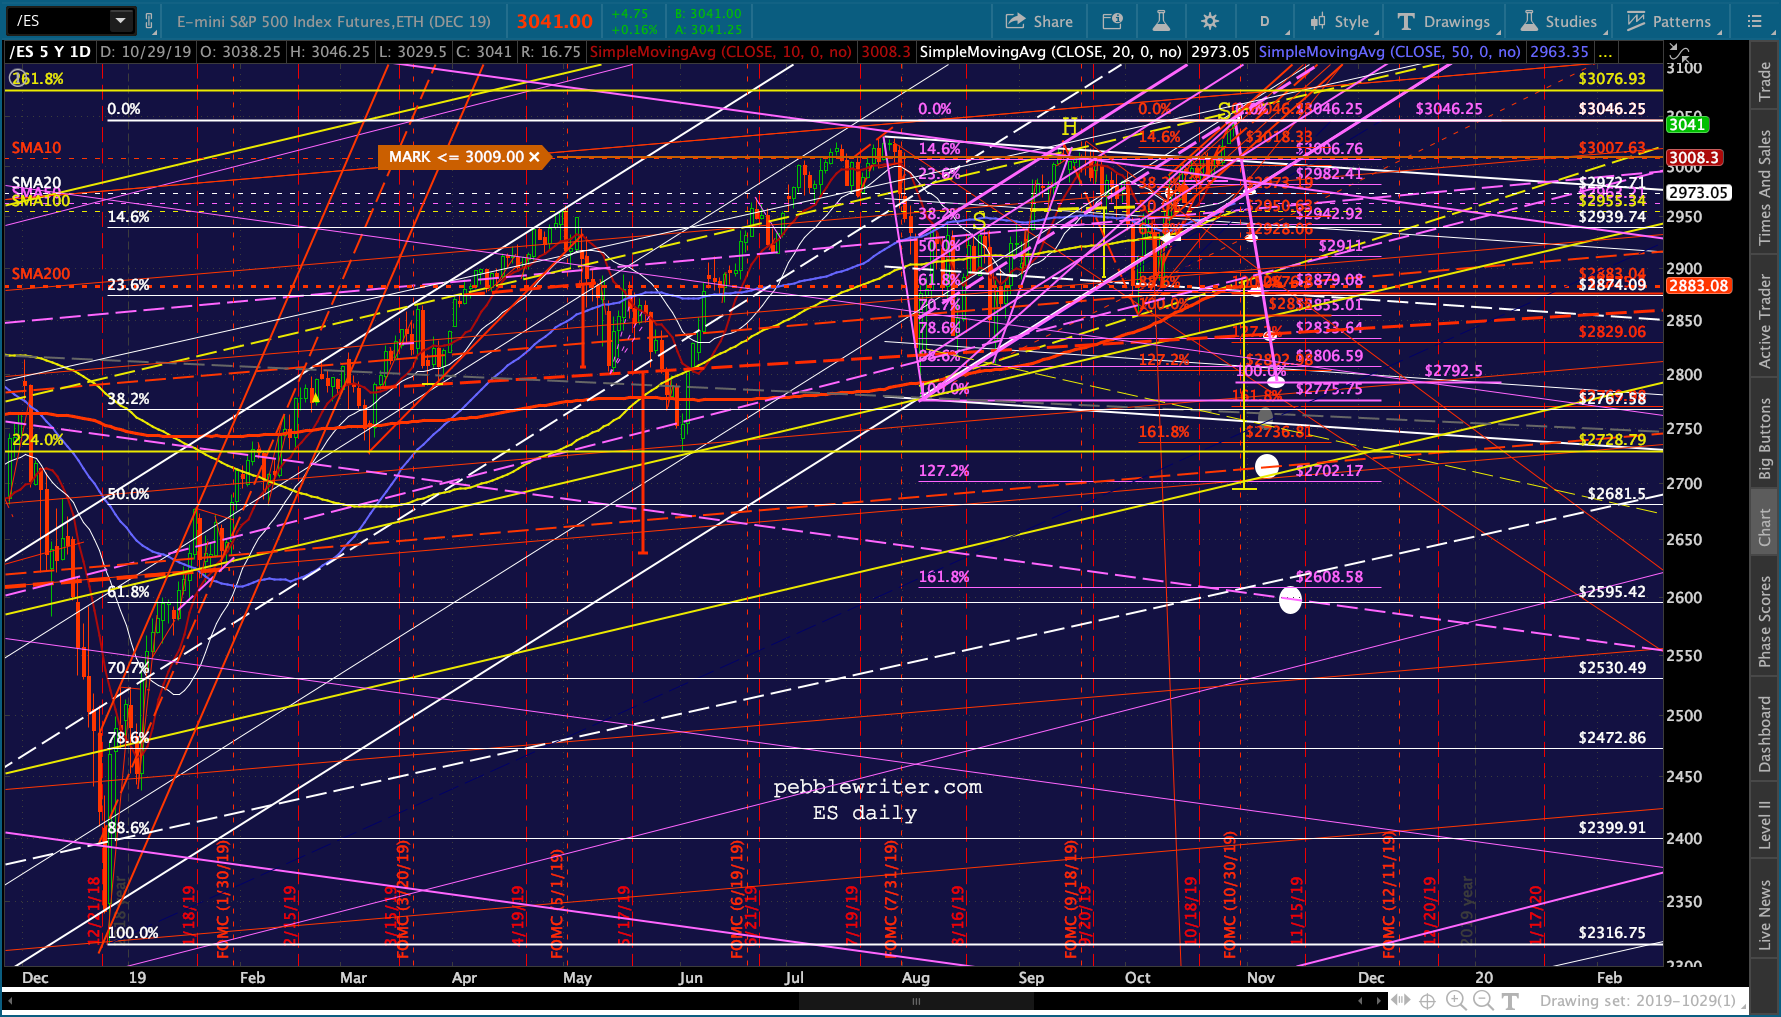
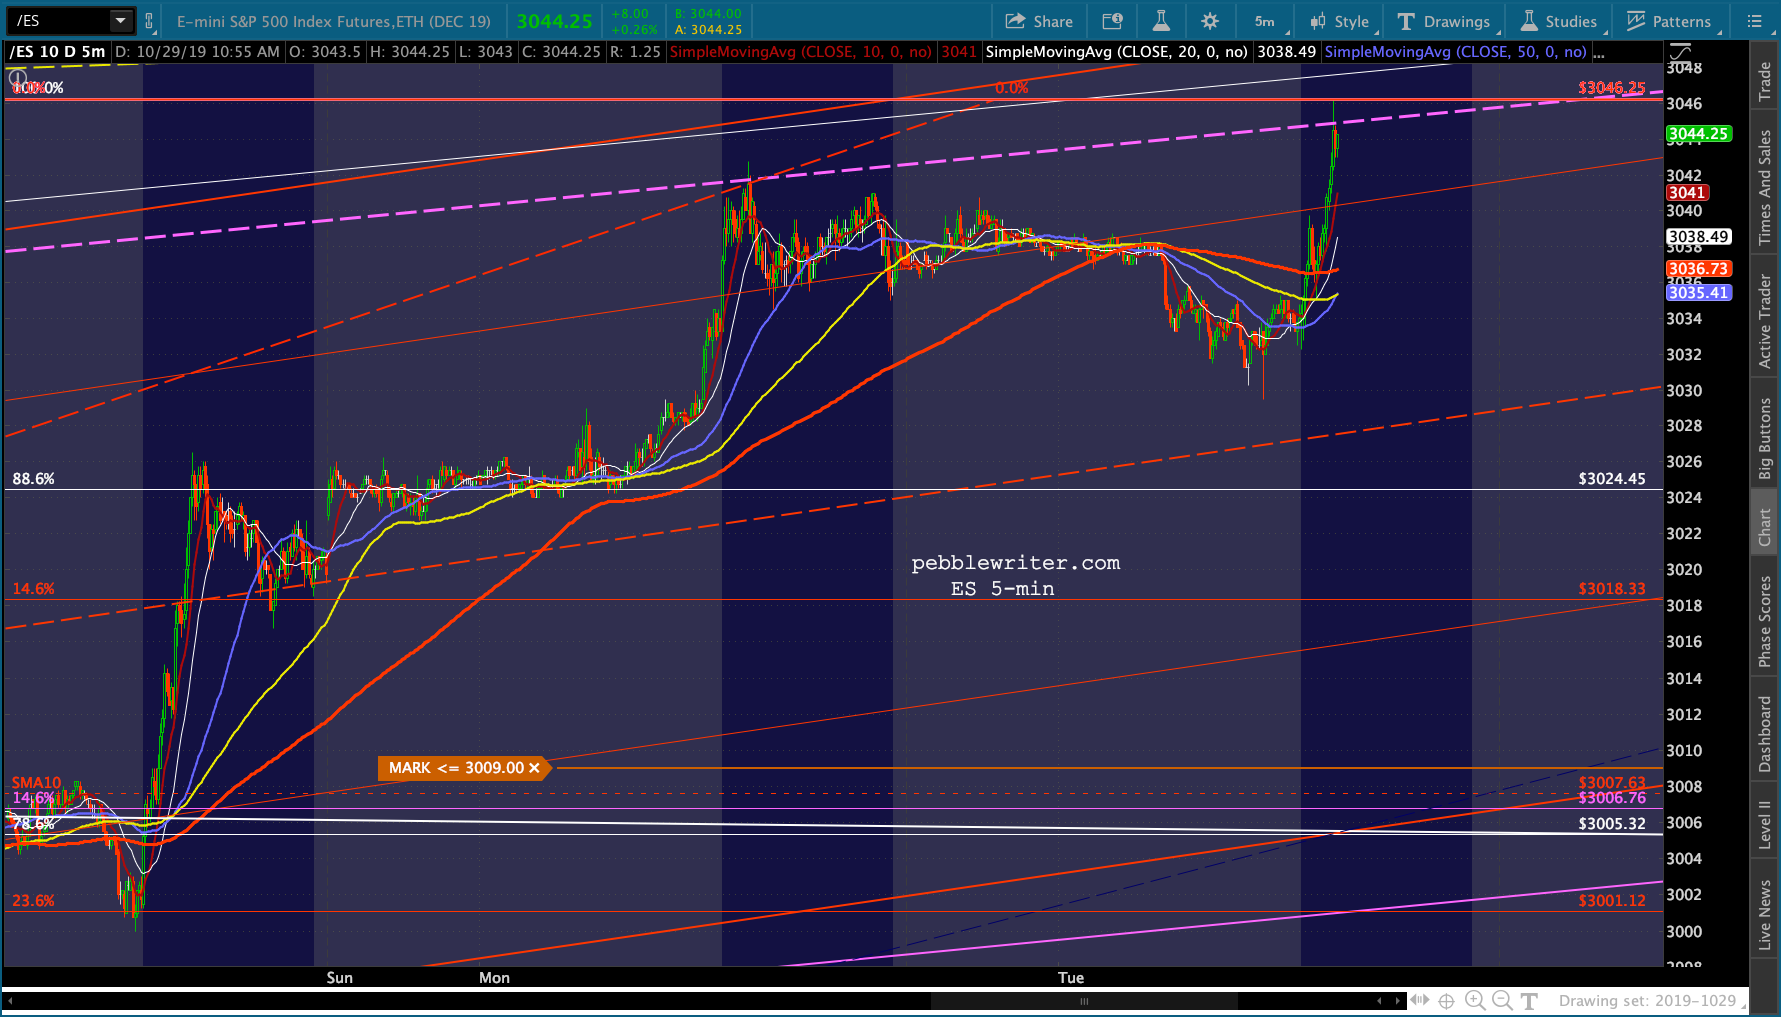
Just tagged the 2.618 extension. Unless the manipulation continues successfully, this should mark an important top.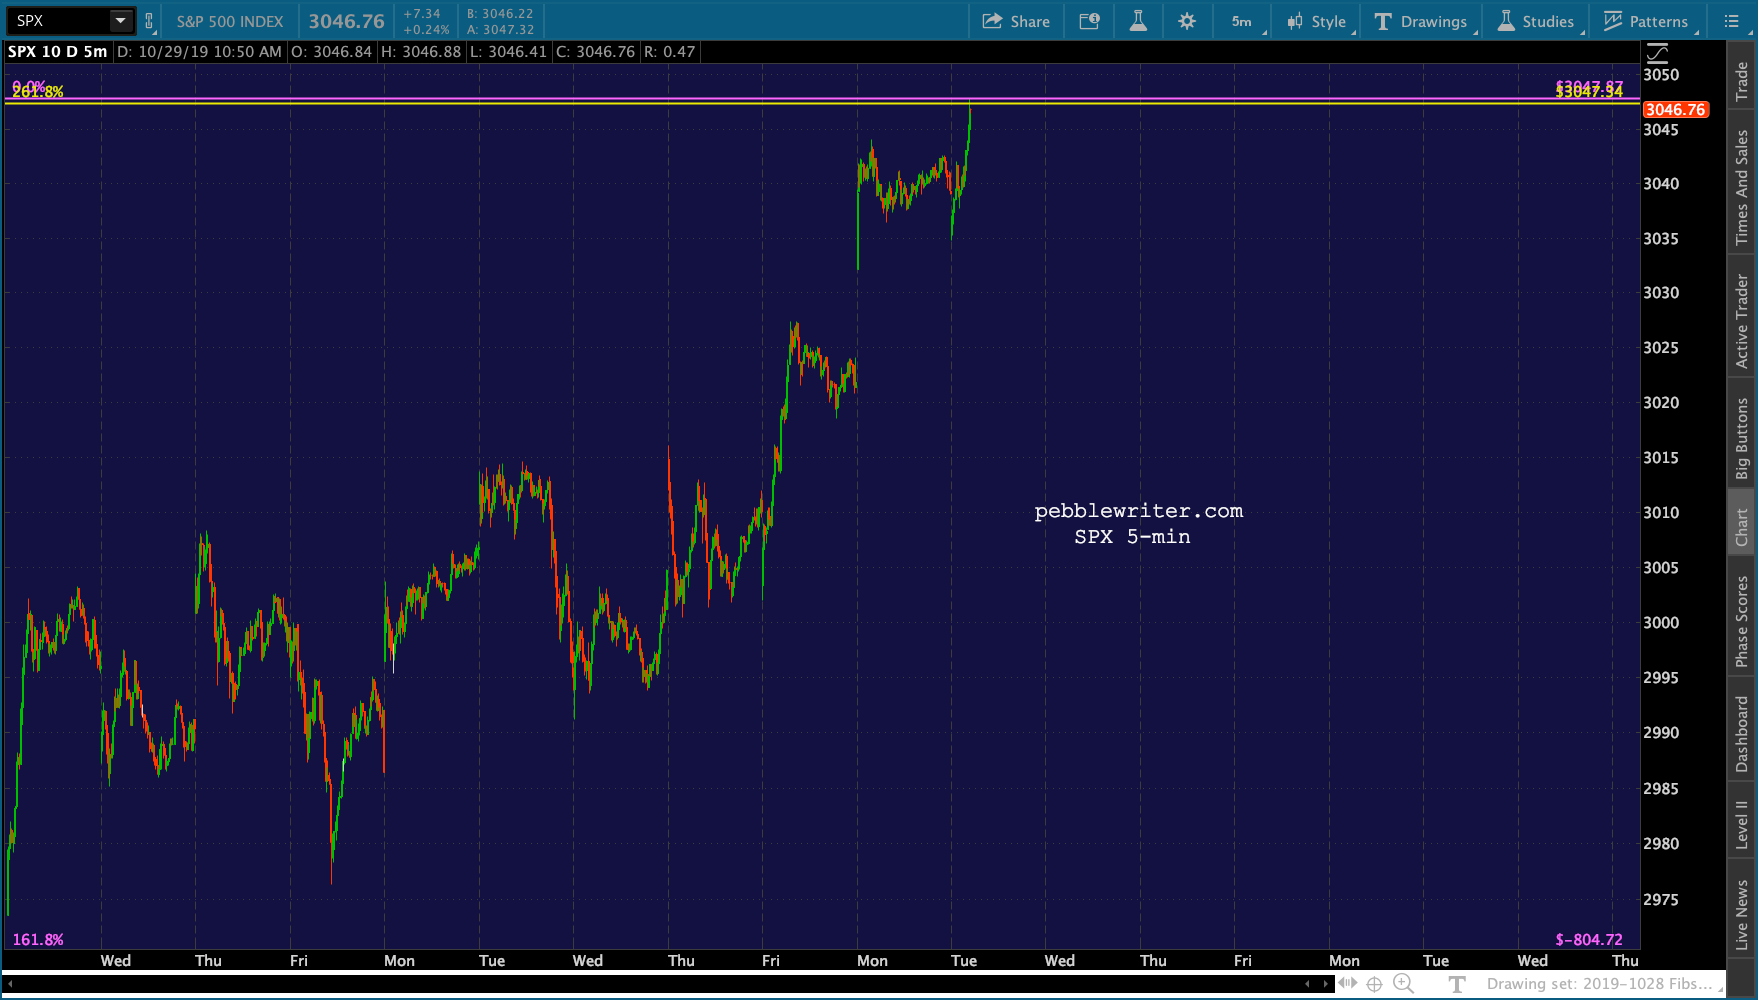 ES could still make progress after hours as long as it reverses before tomorrow’s open.

 Looking at the bigger picture, ES still has a valid H&S Pattern in the works. The right shoulder, though higher than the head, is only 161 points above the neckline versus the head’s 192 points.
 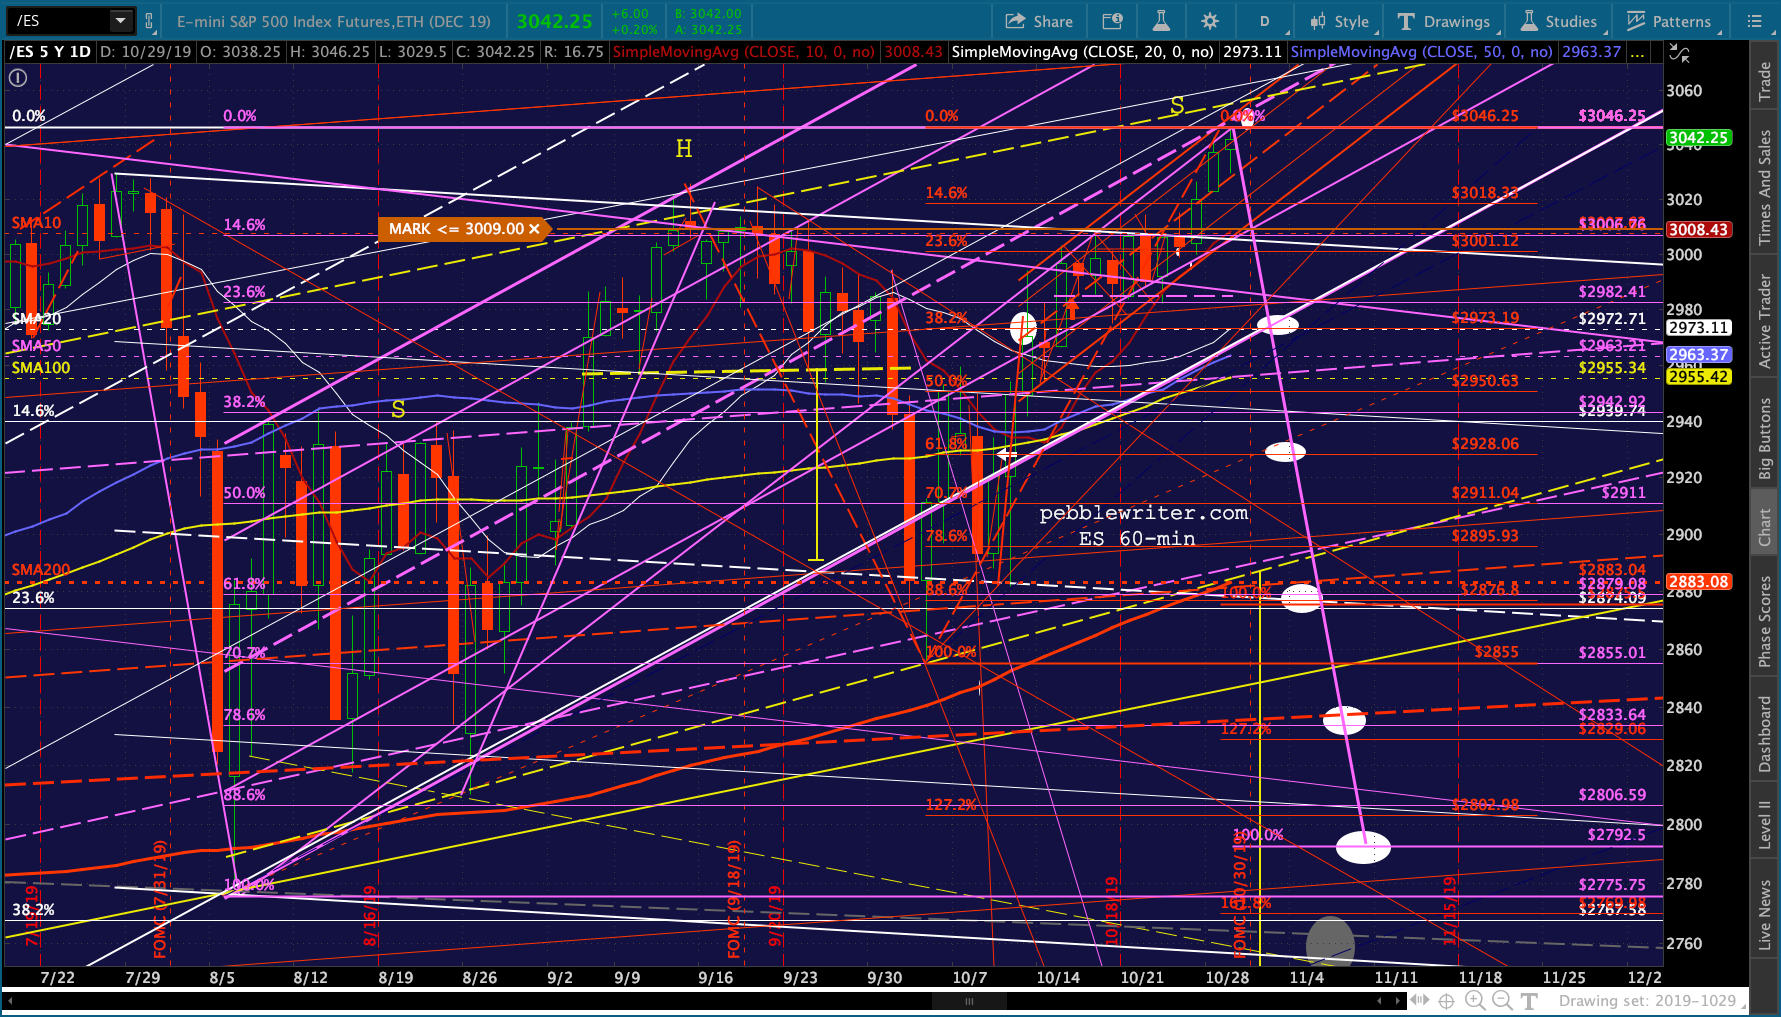 If ES were to tumble as sharply as our analog suggests, it would target 2695.