

The meltup continues as we approach the next FOMC meeting. This time, we also have a slew of earnings reports — which have largely been ignored in the quest for new all-time highs.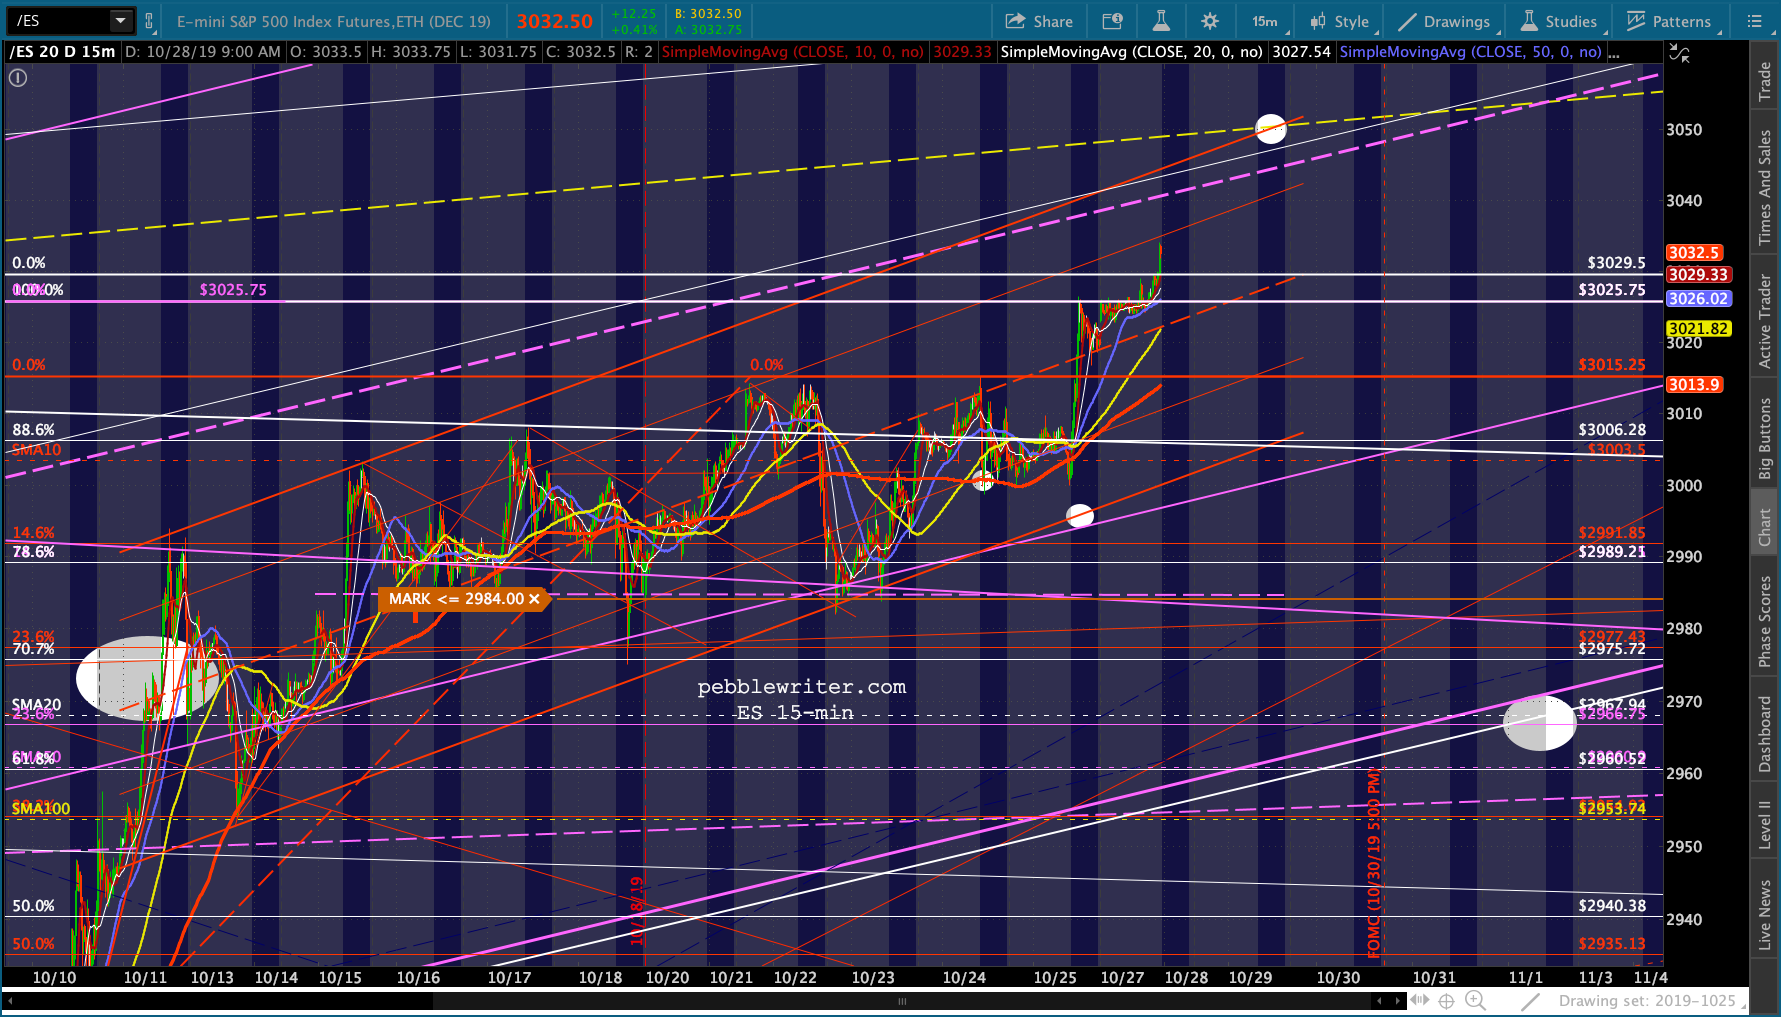 Would the Fed’s failure to cut rates again make any difference?
continued for members…
SPX will make new highs on the opening, and now stands just 25 points below its 2.618 Fib extension at 3047.34.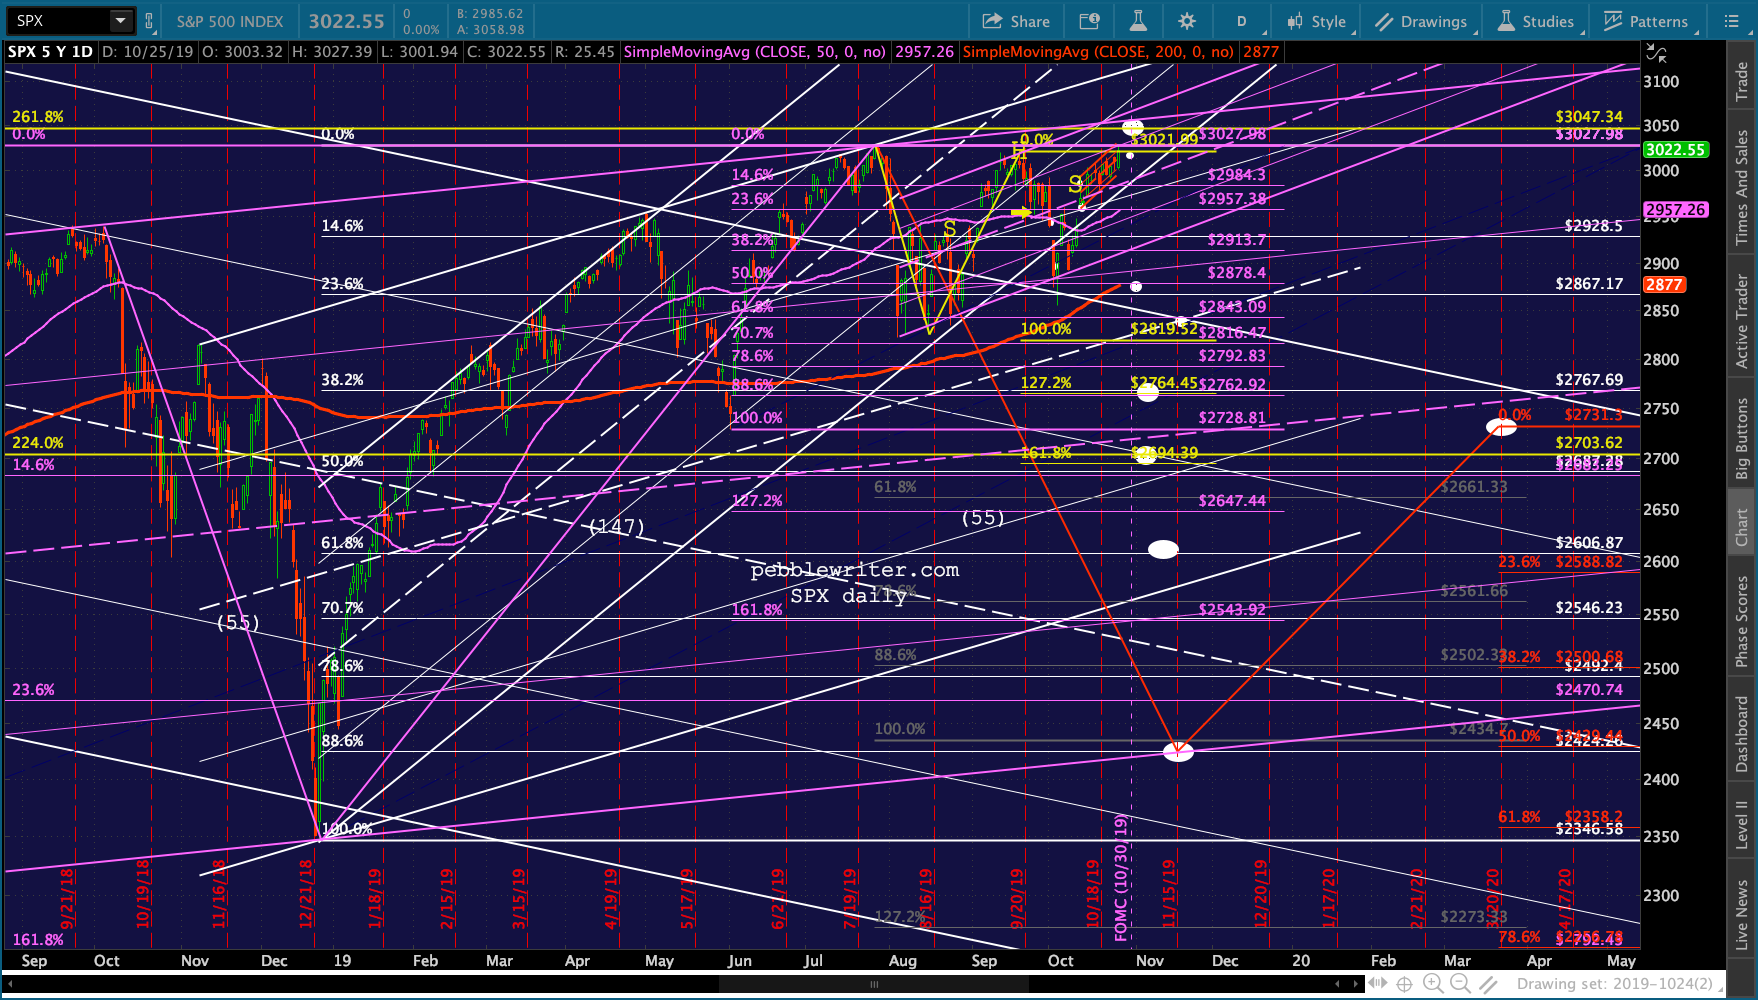 …this, as VIX approaches important support.

If SPX were to reverse at 3047.34 exactly, that would put the purple .618 and yellow C=A extension at roughly the same level: 2850. This would be well below the SMA200 which is currently at 2877, so it could be quite a sharp decline if permitted to occur. As we discussed last week, I see no reason for stocks to tumble before the meeting ends unless stocks cover all that ground before the 30th. Bottom line, be very cautious in chasing this breakout.
Keep May 1, 2019 in mind. SPX bested the Sep 2018 highs by 14 points and promptly tumbled over 200 points.
CL and RB continue to tread water by extending their backtests…
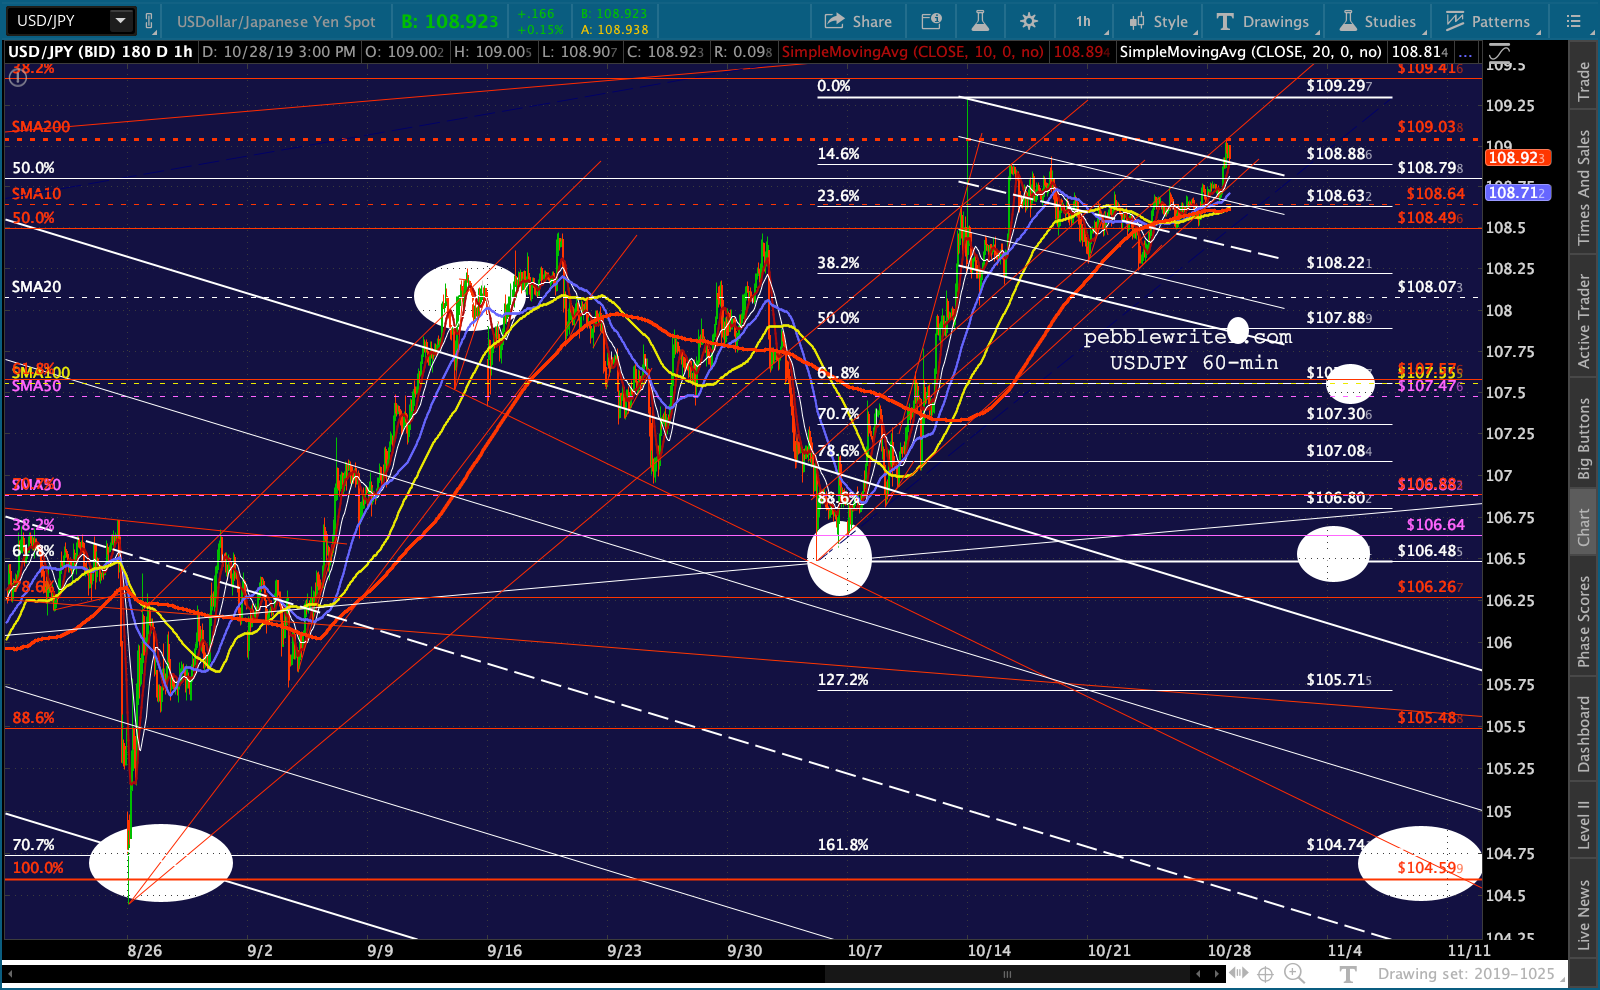
 …while USJDPY continues to levitate.
 The real daily action continues to be the collapse in VIX.
 Though the 10Y is now very much in on the action.
 The Fed is very much aware of stock prices which, with SPX being at all-time highs, will argue against a rate cut. The previous FOMC meetings — which did feature rate cuts — marked reversal points for the market. I see no reason why one which disappoints won’t produce an even more negative response.
UPDATE: 3:50 PM
Not much excitement since the initial push which came within 3 points of the 2.618. In 2015, the top was within about 4 points. I think this is probably close enough to matter.
VIX has clearly broken out of the little falling white channel, though technically it could drop a little further without breaking down on the daily chart.
 USDJPY has backtested its SMA200 again.
 CL could probably push slightly higher for an actual SMA200 tag.
 This leaves SPX at a natural turning point.