Category: Charts I’m Watching

  • Houston, We Have a Problem…

    While the talking heads seek to reassure us that the Greek problem is behind us, consider this little-noticed news from Moody’s.

    I doubt any of my regular readers own these bonds, and thus would likely feel unaffected by the news.  But, I’m seeing more and more of these little blurbs lately.  And, the cumulative effect could be devastating to the markets.

    Institutional investors (pension funds, corporations, insurance companies, money market/mutual funds, foundations etc.) are all about rules.  In almost every case, an investment committee establishes very precise rules governing what the fund may and may not invest in.  So, when an instrument formerly rated A1 is downgraded to Baa1, there’s a decent chance some investors will be required to dump it.

    Many bond issues lack the inherent credit-worthiness to be considered high grade on their own merits.  They purchase credit enhancement from a high grade bank, analogous to renting a co-signer on a loan.  When that co-signer’s credit takes a hit, as occurred here when Bayerische Landesbank was downgraded, everything the co-signer vouched for is suddenly affected.

    In a healthy, orderly market, it’s not a big deal.  The issuer finds a new co-signer and life goes on.  But, when there’s a systemic decline in the credit ratings of most of the co-signers out there… well, Houston we have a problem.  In the article accompanying the BL downgrade this past November, Moody’s noted:

    Moody’s said in July it initiated or continued creditrating reviews for 12 German banks on concern assumptions ofsupport for the lenders may be challenged as the political willto shoulder bailout costs weakens.

    Well, with CDS being triggered Friday, banks across Europe are being hit with costs they had assumed would never be realized.  And, with Ireland and Portugal scheming to snag their own bailout restructurings, the contingent liability is in store for the Euro Zone financial community is about to soar at a most inopportune time (Basel III.)

    Add in the fact that many of the affected countries are facing elections in the coming months — meaning even less support for the sweetheart deals the incumbents made with banks — and it’s pretty likely that more downgradings are in store for the co-signers.  Given the degree to which they partook of the latest LTRO, it would seem there are too many snouts in the trough as it is.

    So, to bring the idea full-circle, what happens when even more banks suddenly lose support from governments no longer willing to bend over backward to keep them from failing?  We’ll be seeing lots more downgrades from the rating agencies — which, of course, means lots more downgrades for all the instruments backed by said banks.  Institutional investors will have no choice but to dump the affected instruments — meaning even more underfunded pensions (another story getting no coverage whatsoever) and financial institutions which will lead to…yep… more downgradings.

    It’s a feedback loop that could get real ugly, real fast.

  • Charts I’m Watching: March 12, 2012

    UPDATE:  3:30 PM

    A companion chart to this morning’s NYSE Gartley — the Dow Total US Stock Market Index (DWC) daily (similar to the Wilshire 5,000 — which TOS inexplicably doesn’t offer.)

    Like SPX, DWC is performing a back test on two of its broken RSI trend lines.  Unlike SPX, DWC has so far failed to exceed its May 2, 2011 high (14,501).  In fact, the line of resistance around 14,500 goes all the way back to May 2008.

    While prices have come reasonably close to that trend line lately, the RSI tag remains elusive — leaving a bearish divergence that should play out as soon as the back test runs its course. 

    As we’ve all seen lately, the narrower indices (talking to you, SPX and DJIA) have managed to eek out slightly higher highs.  Apparently, it’s easier to ramp 30 or even 500 stocks higher than it is thousands.  It’s a huge test of bears patience, but this non-confirmation will play out.  With short interest and now VIX testing major support, I suspect it won’t be long.

    UPDATE:  2:00 PM

    Budget deficit was $231.7 billion in Feb, versus $222.5 billion for Feb 2011.  Receipts were down 6.3% Feb 2012 v Feb 2011, while outlays were up about 2%.  Meanwhile, the CBO projects the deficit will narrow by 16% (huh!?) but still remain over $1 trillion for the fourth straight year.  Not to dwell on the obvious, but an increasingly negative run rate is not the sort of thing you normally see in a recovery.

    UPDATE:  12:00 PM

    Continuing the discussion on VIX, here’s the daily chart we were watching last week.  In particular, it seemed the red RSI TLs would pick up the pattern going forward.  As can be seen, though, the trend line was broken by just a little on Friday.

    This morning’s crack in VIX not only killed off the latest IHS pattern, it sent the daily RSI well below the red TL — meaning that it will have to have a meaningful reversal in order to not remain below the TL on the daily chart.

    The 60-min chart better defines the path forward.

    Aside from obvious bullish divergence, the tag of the red dashed line indicates at least an interim bottom.   The yellow dashed line provides a threshold that, if broken, would likely allow VIX to recover its entire daily losses and leave the daily RSI TL unscathed on the day.  We’ll keep an eye on this chart during the day.

    Even if we didn’t have a full recovery, there’s the possibility that we’re simply making more of a channel with the red TLs.  The dashed line is drawn parallel to the presumed upper channel line and would still carry VIX higher — in line with the inferences drawn from the charts below.

    UPDATE:  11:25 AM

    Some follow-up perspective on VIX, which has formed 5/6 of an inverse head & shoulders pattern to match the 5/6 completed H&S; pattern on the NYSE (NYA.)

    VIX would have to drop to 13.60 or so to tag the trend line connecting its lows since 2007.  A closer look at the daily chart clearly illustrates what’s happened in the past when VIX approached this line.

    ORIGINAL POST:

    A little eye candy for the bears — a completed Gartley on the NYSE.

    It’s off 0.3% this morning, and SPX is off a few points, so why is VIX cratering? VIX just plunged into the 15s for the first time since days before the July crash, touching 15.23 moments ago.   In every instance except for December 2010, this was a very bad sign for the bulls.

    And, as Zerohedge reported this morning, NYSE short interest is back to the levels it’s been preceding every major correction of the past year.  This excellent chart says it all.

     ******

    There were quite a few good articles over the weekend regarding how the triggering of CDS will affect banks and insurance companies.  In short, while the debt directly affected has been reported as only $3 billion, there are quite a few more related issues which will also be able to take advantage of the ISDA declaration.

    More later.

  • Charts I’m Watching: March 20, 2012

    A quick summary of the major charts…

    RUT has completed a Crab Pattern (in red) within the last leg of a Bat Pattern (purple) off the 2011 highs.  Significantly, it hasn’t been able to clear the TL off the May and July highs.  The May 2011 high was a double-top to 2007’s.

    COMP is tagging a trend line off the 2007 highs which is exactly parallel to the line connecting the 2002 and 2009 lows.  A reversal here would make for four touches — i.e. a channel.

    While the largest potential Butterfly Pattern 1.272 completion is still some distance away (3295 v current 3071), it completed a small Crab within a small Butterfly at 3062 and 3048 respectively.  I think that between the TL and the smaller Butterfly, we should get at least an interim low in the short run — even though there’s more medium-term upside to the 3250-3300 level.

    DJIA peaked at 13,289, completing a Crab Pattern a stone’s throw away from a Butterfly Pattern completion at 13,338.64.

    Zooming out, we see that we’re also bumping up against the .886 of the Oct ’07 to Mar ’09 drop at 13,317.09.  Either of these patterns could be considered close enough to be complete, but a small intra-day bump to tag the actual target is very feasible.

    SPX is closing in on the .886 of the Oct 07-Mar 09 drop at 1472.43.  But, we’re reaching important resistance levels in the rising wedge — which is getting long in the tooth.


    On a smaller scale, the Butterfly pattern from last July is approaching its 1.272 extension at 1421 — assuming a Point X of 1347 on July 21.  This is the best fit for the Butterfly pattern, but it could be started at May 2’s 1370 or July 7’s 1356 — resulting in slightly higher 1.272 extensions.

    There is ample bearish divergence in every time frame.

    More later.

  • Charts I’m Watching: March 9, 2012

    UPDATE:  2:50 PM

    ISDA rules Greek use of CACs is a credit event.  Credit default swaps triggered. 

    UPDATE:  2:35 PM

    Updated VIX charts, as requested.  Note we made the tag on the RSI TL as discussed last night.  There appears to be a slight overshoot — as is also present on the SPX back test — which makes me think the candles setting up will close bearish.  VIX is ripe for a break out; next stop 26.

    UPDATE:  2:15 PM

    Watching paint dry here at the .786 I mentioned earlier…   The 15-min chart has a channel that could go on forever except for the fact that the RSI has broken a trend line and is showing negative divergence.  Too soon to be definitive, but it might be an early signal of the trend fizzling.

    It supports the look of the 60-min chart — which to these eyes is a potential break of the price and RSI TL’s, along with negative divergence on the histogram.

    And, of course, the daily chart — which still looks like a big back test of the RSI TL and a broken MACD TL to me.

    None of this is definitive, yet, but I’m going to add a little to the shorts (200 FAZ and 100 UVXY) and close out my FAZ puts for a nice gain.

    UPDATE:  10:45 AM

    SPX going where the Euro fears to tread, pushing 1373.  Just a reminder, the .886 retrace of the decline from 1378.04 is 1373.71.  There’s sort of a Bat pattern if you count yesterday morning’s opening surge as Point B.  It was just shy of the .618.

    Just above 1373.71 is the 1.618 from the recently completed Butterfly pattern @ 1375.47. 

    ORIGINAL POST:

    This is the big reaction to the salvation of the euro zone?  Thank goodness it didn’t go badly…  That’s a genuine RSI back test and reversal.  Next likely step is down.

    Employment report out this morning.  Generally considered a beat of expectations.

  • The Contest

    UPDATE:  Friday, March 16  4:10 PM

    We have a WINNER!  Our very own EWTNEWBIE, at 1400, was a scant 4 points away from today’s closing SPX price of 1404.24.   Who knew his keen analysis would prove to be so prophetic?

    For his brilliance, the newbster (or is he?) wins a free one-year premium subscription to the new pebblewriter website, which I hope to have up this weekend (fingers firmly crossed.)

    Kudos to 2nd and 3rd place finishers Roy Ponder and R M for their guesses of 1392 and 1385.  And, thanks to everyone who played our little game.   I know how humbling it can be to put your thoughts out there for everyone to see.  So, I appreciate everyone who participated.

    If you all enjoyed this, we’ll do it on a regular basis.  If you have a particular contest in mind, please post your thoughts below.  Again, congratulations ewtnewbie.  Great job!

    ****************

    UPDATE:  2:20 PDT

    I goofed when I posted that the deadline was 5pm PST.  Forgot that daylight savings time began last night.  Note that the deadline is 5:00 PM PDT (Pacific Daylight Time.)  Here’s the list, in the order in which they were received,  as of moments ago.  The mean is 1332.49, median is 1330 and std dev is 42.  A slightly bearish bunch… go figure.

    As someone pointed out, Friday is OPEX.  But, jeeze, what headlines over the weekend; lots to think about.

     Good luck!

    **************

    ORIGINAL POST:

    Sorry, but I love this kind of stuff.  If nothing else, we’ll find out who the real bears are!  From today’s daily post:

    I’m working this weekend to get the new website up. Take a moment to sign up as a follower of this blog; regulars will be offered preferential rates. And, while we’re on that topic, I’d like to offer the reader who comes closest to picking the price at which SPX closes on March 16, 2012 a free one-year subscription. Post your best guess in the Comments Section for all to see by this Sunday at 5pm PST.

    I’ll post all the entries I’ve received as of Sunday morning shortly after noon.  Any corrections should be submitted by 5:00 PST that afternoon.   Like the markets and – dare I say, life – timing is everything.  Please, no double entries, and don’t confuse me by picking a number already picked by a fellow reader.   To simplify things, all entries must be logged in the Comments Section of this post.

    Good luck to all!

    *********

    Here are the early birds from the comments section in yesterday’s post…

  • Charts I’m Watching: March 8, 2012

    UPDATE:  8:00 PM

    As all my regulars know, I love trend lines on RSI charts.  The VIX daily chart shows clearly just how valuable they can be.  Notice how clearly the yellow TLs guided VIX to its highs during the July crash.  And, the purple TLs guided it back down.  Now, we’ve broken out through the purple TLs and are following the red TLs up again.

    The purple circles mark many of the important reversals, break outs, shifts from one channel to another and back tests.  Here’s a close up, showing just how effective they can be.  Any guesses as to what will happen when we next tag the red line (at the bright blue oval)?

    I’ll be the first to admit that forecasting with RSI TL’s can seem a little like reading tea leaves or throwing bones.  But, more often than not, it’s helped me identify important events before they occur.  And, that’s pretty fun stuff.

    Speaking of fun stuff…

    I’m working this weekend to get the new website up. Take a moment to sign up as a follower of this blog; regulars will be offered preferential rates. And, while we’re on that topic, I’d like to offer the reader who comes closest to picking the price at which SPX closes on March 16, 2012 a free one-year subscription. Post your best guess in the Comments Section for all to see by this Sunday at 5pm PST.

    Good luck!

    Oh, and here’s a nice little article about TVIX.  Good blog in general, it seems.

    UPDATE:  3:20 PM

    VIX completing a back test and right shoulder for IH&S;?

    Buying a little insurance with 40 TZA Apr 17 puts @ .61 (2.5%).  And, put on a straddle in FAZ with 30 Apr 22 Puts @ .69 and 20 Apr 28 Calls @ 1.33.  Total cost is 2.02, so I want prices to move below 20 or above 30.

    FAZ is right up against a TL that dates back to October 4.  Its RSI has broken out to the upside.  I expect a big drop if the market rallies further, or a large increase in the event this rally is nothing more.

    UPDATE:  12:45 PM

    We’re pushing a little higher, topping 1365.  I suspect it’s an overshoot of the indicators mentioned an hour ago, but am watching closely.  Several positions in which we had gains are at break even.

    The daily chart continues to look bearish to me.  In particular, I’m drawn to the daily RSI, which has completed a back test of the broken TL (yellow, dashed).

    UPDATE:  11:30 AM

    This seems like an excellent spot for the rally to fizzle.  We’ve retraced .618 of the drop from the presumed top (1378.04) and have bumped up against the channel I theorized about yesterday.  Furthermore, 60-min RSI is tagging the TL that’s marked previous tops.  And, last we’ve completed a back test of the broadening ascending wedge (megaphone) that’s formed since Feb 1, and the SMA 10 is just ahead at 1364.

    I’ve added to several of my ETF positions in the model portfolio:

    +170 SDS @16.21
    +80 TZA @ 20.18

    Initiated a new position in the bearish financial ETF FAZ:

    +100 FAZ @ 25.55

    And closed the remainder of my SPY Mar 135 calls for a nice gain.

    ORIGINAL POST:

    Lovely day for a gap and crap?

    Big ramp overnight, follow-through to yesterday’s masterful ramp job that put the brakes on the downturn which began Tuesday.  Apparently, someone forgot to tell the guys at DOL — which just reported an increase in initial claims.

    Ignore the seasonally manipulated numbers and focus, instead, on the raw data, which relects a 31,513 increase from the prior week.  That’s a 9.4% increase, which the markets will not like.

    We discussed yesterday the possibility of a gap close from Tuesday’s plunge.  We’d need to reach 1359.13, which is going to be challenging unless the futures can hold on until the opening bell.  Eminis, which topped out at 1360, just broke their 60-min RSI TL.

    On the EZ front, despite CNBS’s rosy headlines…

    … ECB Presidente Supermario Draghi reports that the economic outlook for 2013 has been revised downward.  Recall that the 2012 forecast was revised from +0.3% to -0.1% a few months ago.  Now, 2013 — the year of the recovery — has been revised from 1.3% to 1.1%.  Wishful thinking, IMO.

    Please note:  UVXY reflects a 6:1 reverse split today.

  • If Only It Were Always This Easy

    In yesterdays’ closing post, I cynically remarked that the powers that be (TPTB) would manufacture a good-sized bounce after the drubbing the markets took:

    ” I expect at least some bounce (1355?) tomorrow morning — perhaps a result of overnight news designed to stabilize the markets… Keep an eye on news in the morning — euro zone, of course, but also the ADP employment figures (pathetically always great) and crude inventories.

    ADP reliably reported better than expected employment gains, gasoline inventories fell 1.6 MM barrels instead of the 100,000 gain expected, TPTB across the pond were all agog at how well the debt swap is going and — just for good measure — a QE rumor was leaked to WSJ reporter and Fed mouthpiece Jon Hilsenrath.  Even the WSJ’s Marketwatch thinks this PPT reaction was a little too obvious.

    Last Night’s Forecast
    Today’s Markets

    Bears could be excused for feeling like the deck is stacked against them — because it is.  The plunge protection cabal is alive and well.  Of course, it was alive and well last July, too, when the market fell 18% in a matter of 12 sessions.  Hmmm…

    [reprinted from today’s daily post]
  • Charts I’m Watching: March 7, 2012

    UPDATE:  8:30 PM

    If only it was always this predictable…

    In yesterdays’ closing post, I cynically remarked that the powers that be (TPTB) would manufacture a good-sized bounce after the drubbing the markets took:

    ” I expect at least some bounce (1355?) tomorrow morning — perhaps a result of overnight news designed to stabilize the markets… Keep an eye on news in the morning — euro zone, of course, but also the ADP employment figures (pathetically always great) and crude inventories.

    ADP reliably reported better than expected employment gains, gasoline inventories fell 1.6 MM barrels instead of the 100,000 gain expected, TPTB across the pond were all agog at how well the debt swap is going and — just for good measure — a QE rumor was leaked to WSJ reporter and Fed mouthpiece Jon Hilsenrath.  Even the WSJ’s Marketwatch thinks this PPT reaction was a little too obvious.

    Last Night’s Forecast
    Today’s Markets

    Bears could be excused for feeling like the deck is stacked against them — it is.  The plunge protection cabal is alive and well.  Of course, it was alive and well last July, too, when the market fell 18% in a matter of 12 sessions.  Hmmm…

    Interesting article here about the troubles small businesses are having in China.  Growing problems include rising labor and materials costs, rising yuan, shortages of labor, lack of credit.   We saw the markets react when China lowered their official growth projections from 8% to 7.5%.   Of course, if the carefully managed number is 7.5%, we can only assume it’s really closer to 2%.

    Most investors understand how important China’s continued success is to the global economic recovery story.  If China falters, it changes everything.  Stay tuned.

    UPDATE:  12:45 PM

    Slow and steady, SPX RSI working its way higher in a tight little channel that has taken SPX prices to the limit of the steeply declining channel established yesterday.  I think we’ll break out of it a bit, widen the price channel and possibly reach 1359-1363.  But, anything above 1354 is on borrowed time — as I still believe this to be a contra-trend rally.

    Big solar storm expected to hit tomorrow morning — could put a punctuation mark on this rally:  “biggest radiation and geomagnetic storm the Earth has experienced in five years.”

    UPDATE:  11:45 AM

    The retracement has picked up steam, reaching 1352.37 so far.  The contra-rally is losing momentum.  Will it have enough to close the gap at 1359.13?  Perhaps, especially if we get take a breather to reset the RSI and reach it on negative divergence.  Yesterday’s target of 1354 still looks doable.

    VIX also seems to be thinking about closing its gap (19.25.)  But, check out the RSI TL tag on the 60-min chart.  Any further weakness in prices will be a stretch.

    ORIGINAL POST:

    Getting a little bounce this morning, nothing to write home about yet.  Though from the 30-min chart RSI and MACD, I wouldn’t be surprised to see us up over 1350.  The key is the TL on RSI — if we break it we should easily reach 1354.  I’ll keep the SPY calls in place until I’m satisfied that the retracement has played out.

    I made two changes to the model portfolio this morning.  First, I sold our TVIX position and bought a 4.5% UVXY position instead.  It’s a leveraged ETF with 2X leverage, based on a blend of near month VIX futures.  It has been reported that investors are dumping TVIX since Credit Suisse suspended creating more units — creating overhang that’s hampering prices.  Yesterday, when TVIX was up 4.4%, UVXY was up 15.2%. 

    I also increased our EUO position — the ultra-short Euro ETF — to 4.5%.  This had mistakenly been listed on our spreadsheet as a short position.  The ETF profits when the Euro drops, but is itself a long position.   We now have a total long position of 250 shares.

  • Charts I’m Watching: March 6, 2012

    UPDATE:  5:30 PM

    Closing positions for the day. 

    I will likely close out the USO Mar 40 calls in the morning.  I opened a position of 30 SPY Mar 135 calls towards the end of the day strictly as a hedge, to play the bounce I saw developing.  They largely negate my portfolio’s short bias, as I expect at least some bounce (1355?) by tomorrow morning — perhaps a result of overnight news designed to stabilize the markets?

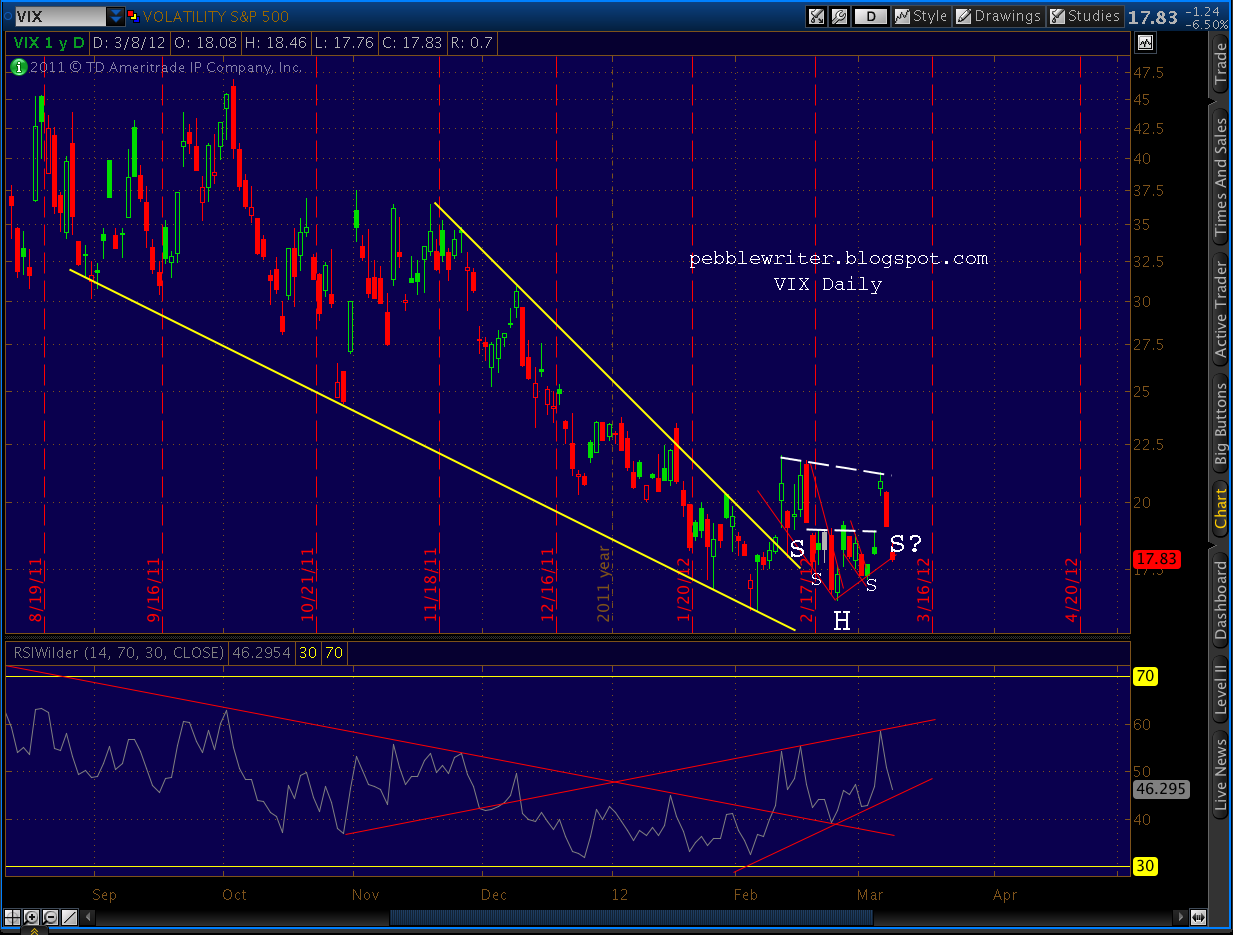
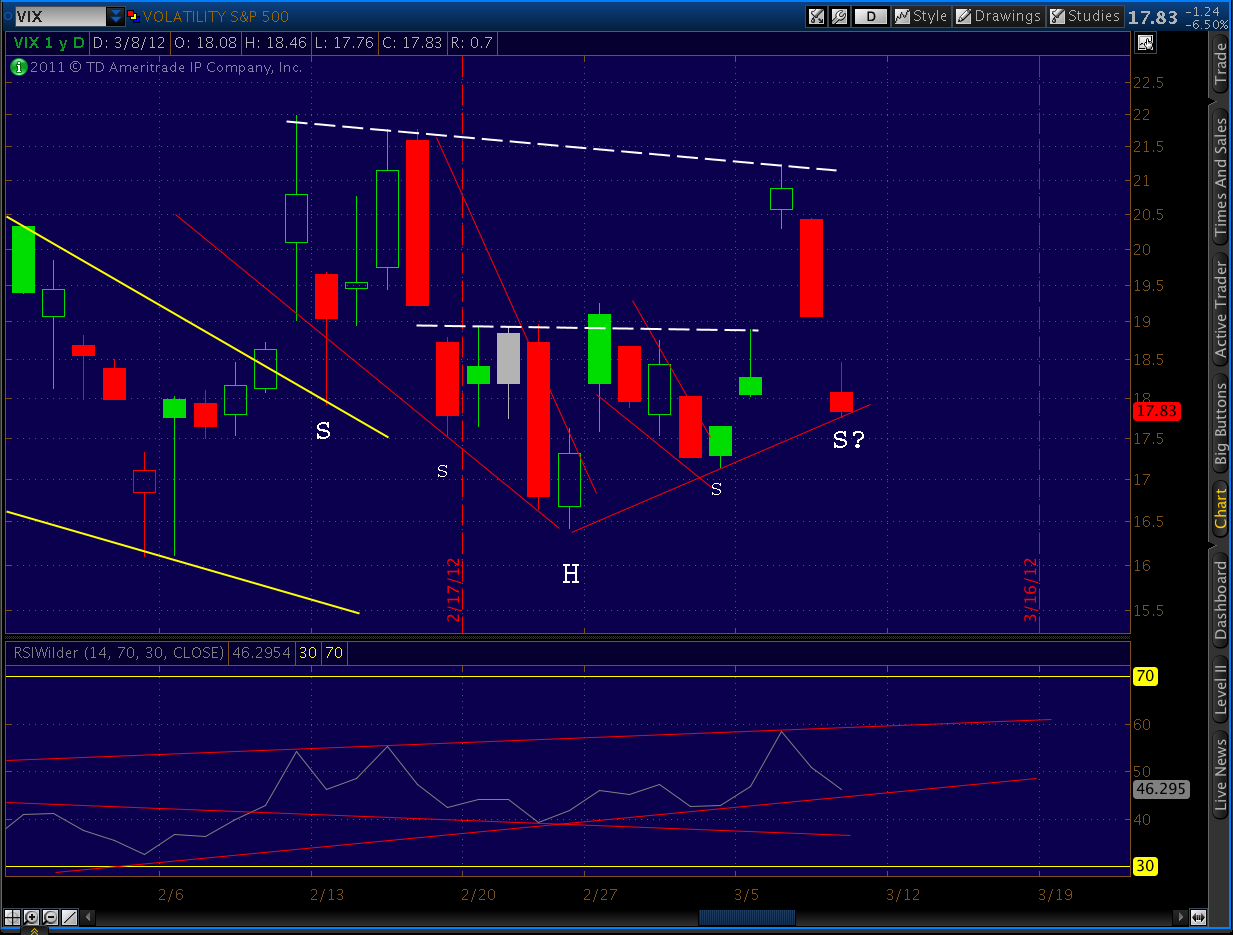
    In any case, we’re at a pivot point that might serve as a neckline for the next H&S; pattern to shape up, and we’ve yet to see a meaningful back test of the recently broken TLs.

    We’re currently at 19% for the options portion of the portfolio.  This will be reduced to our target 15% when the SPY and USO calls are closed out.  VIX is also due for a breather, and might deserve a little trimming back.

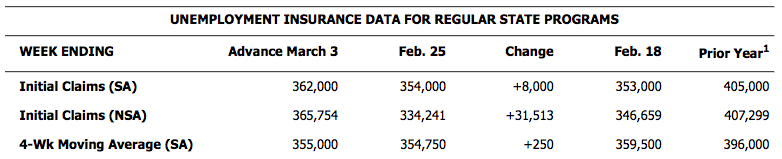
    I will shift much of this to ETFs in the next few days now that I see a sustainable trend to the downside.  Keep an eye on news in the morning — euro zone, of course, but also the ADP employment figures (pathetically always great) and crude inventories.  Oil is still a huge wildcard with respect to GDP both here and abroad.

    Just realized I hadn’t posted a gold chart lately.  I had been watching a Crab pattern that should have reversed at 1802 and was prepared to short around 1800.  Needless to say, the $100 instant meltdown on the 29th dashed those plans.  I’ve been waiting for a nice bounce back to short, aware of the SMA 50 at 1691 and the 200 at 1676.

    We got a $39 bounce, and have since eased down to the SMA 200 (closed at 1675 after an intra-day low of 1663.)  Also at this level, we’re back testing a fan line off the August highs and an important internal RSI TL (both shown in solid yellow.)  While gold is certainly vulnerable here, I’m leery of a flag pattern breakout, and will wait for things to sort themselves out before committing to a new position.

    The bullish scenario, if it were to play out, would see a bounce off the fan line and completion of a big inverse H&S; pattern coinciding with a breakout of the flag.  Such a scenario could see GC up to 2055 if we were to get back to the neckline at around 1780.  Note: this is not a forecast, just thinking out loud.  It’ll start to seem more a serious possibility if we bounce off the fan line over the next few days.

    UPDATE:  2:45 PM

    Possible bounce coming at 1337-1340.  Might play the bounce if the intra-day charts indicate.

    On the news front, an event everyone’s been wondering about…. Ireland to postpone its next interest payment.  As every parent knows, once you let one kid get away with something, it’s usually about a nano-second before the other kid cries foul.  This one payment from Ireland isn’t enough to do serious damage, of course, but the precedent is very, very dangerous.

    To torture the metaphor, the other kids are all watching…wondering why Greece always gets away with it.  Bankers are only too keen to stick to the deal; their allegiance is to the CB’s.  But, if someone comes along and stirs up voters to the point where they toss out the bums who sold them out, watch out.
     
    UPDATE:  12:40 PM

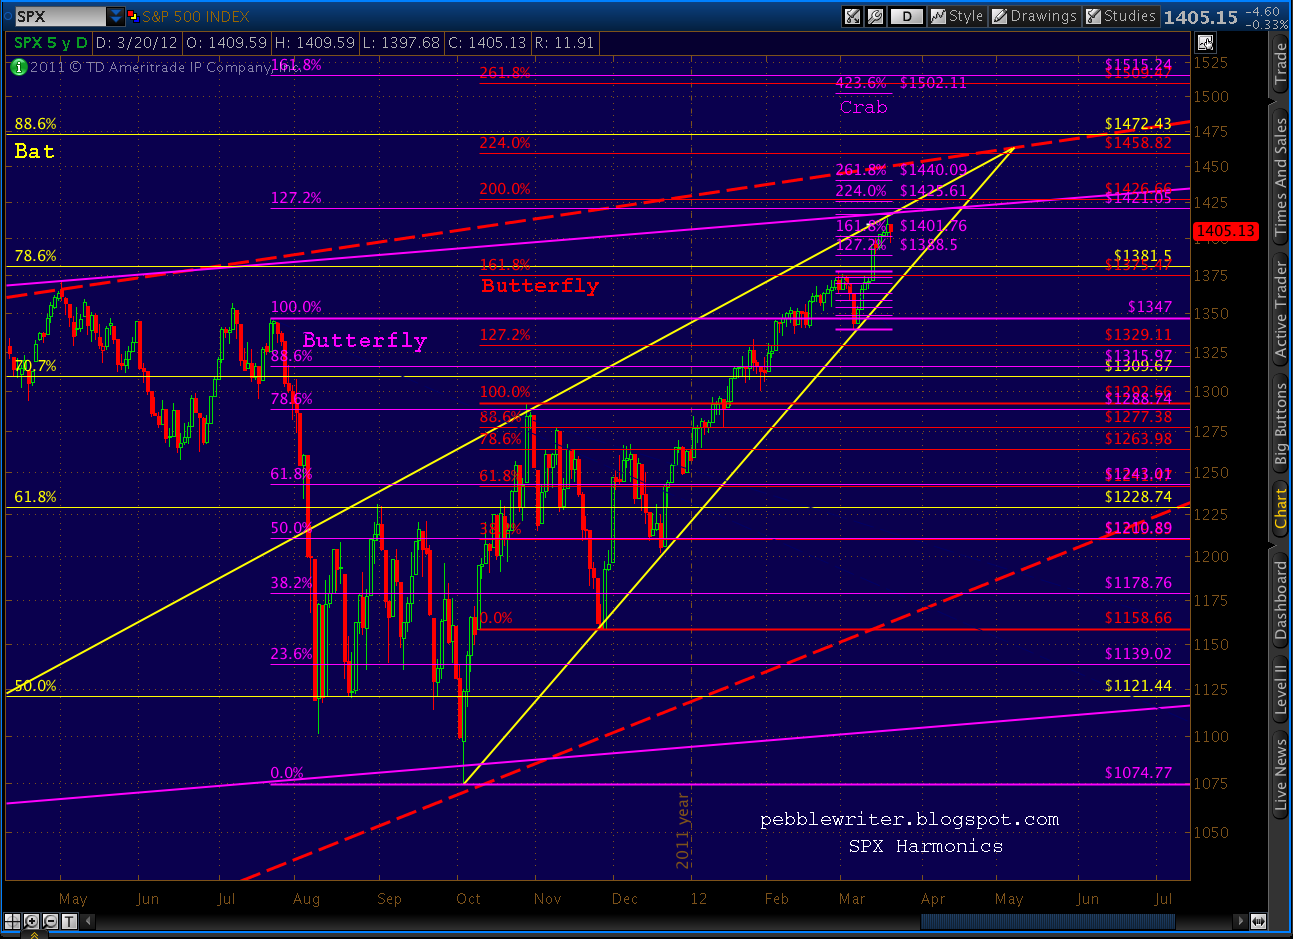
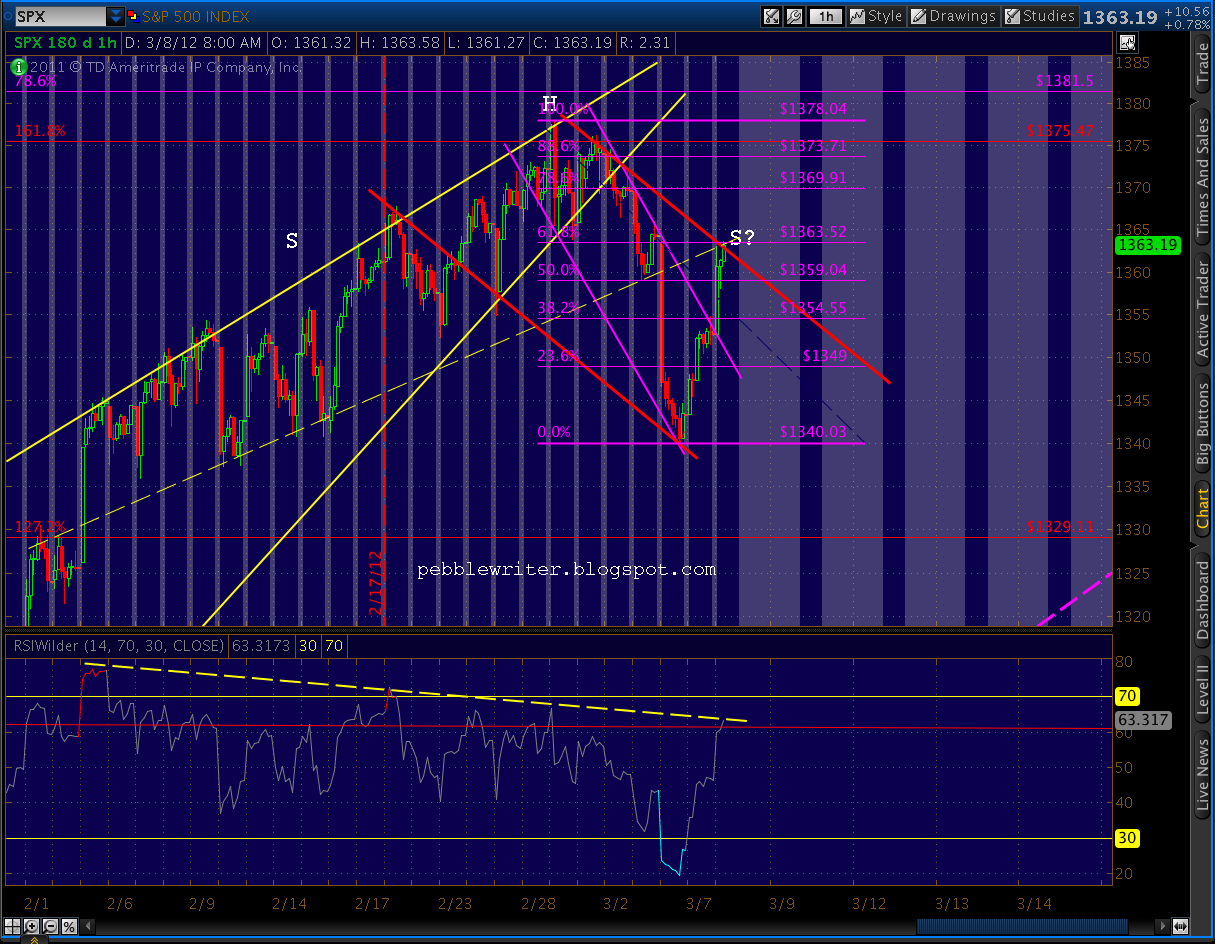
    Quick look at the SPX…currently off 20.75 to 1343.58.

    We’ve broken both the rising triangle (yellow) and the secondary supporting TL (red, dashed.)  Just below is the TL off the October 1074.77 lows (purple, dashed.)  It looks to be around 1325 currently.

    Recall that Butterfly patterns, like all harmonics, like to reverse by .618 of the AD distance.  In this case, that would work out to 1242.46 — which correlates with the .618 Fib of the original pattern (since we came so close to the 1.618 target — 1378 v 1375.) 

    This is also reasonably close to the .618 of the giant Gartley we’ve formed since the Oct 2007 top which targeted 1381.50.  I find it really interesting that SPX failed to reach it yet again — missing by 3 points this time versus 11 last May.   Coming that close to a pattern ideal point D, BTW, is a hit — not a miss — when you’ve traveled 1622 points to get there (dropped 910 and subsequently rose 712 points.)

    The 60-min RSI has hit a TL going back to last August (red, dashed.)  In each previous case, the initial tag proved to be an interim low.  Following a bounce, the index went on to make a new lower low while the RSI made a higher low — setting up positive divergence.  This pattern can help in determining when to take profits on or add to our shorts.

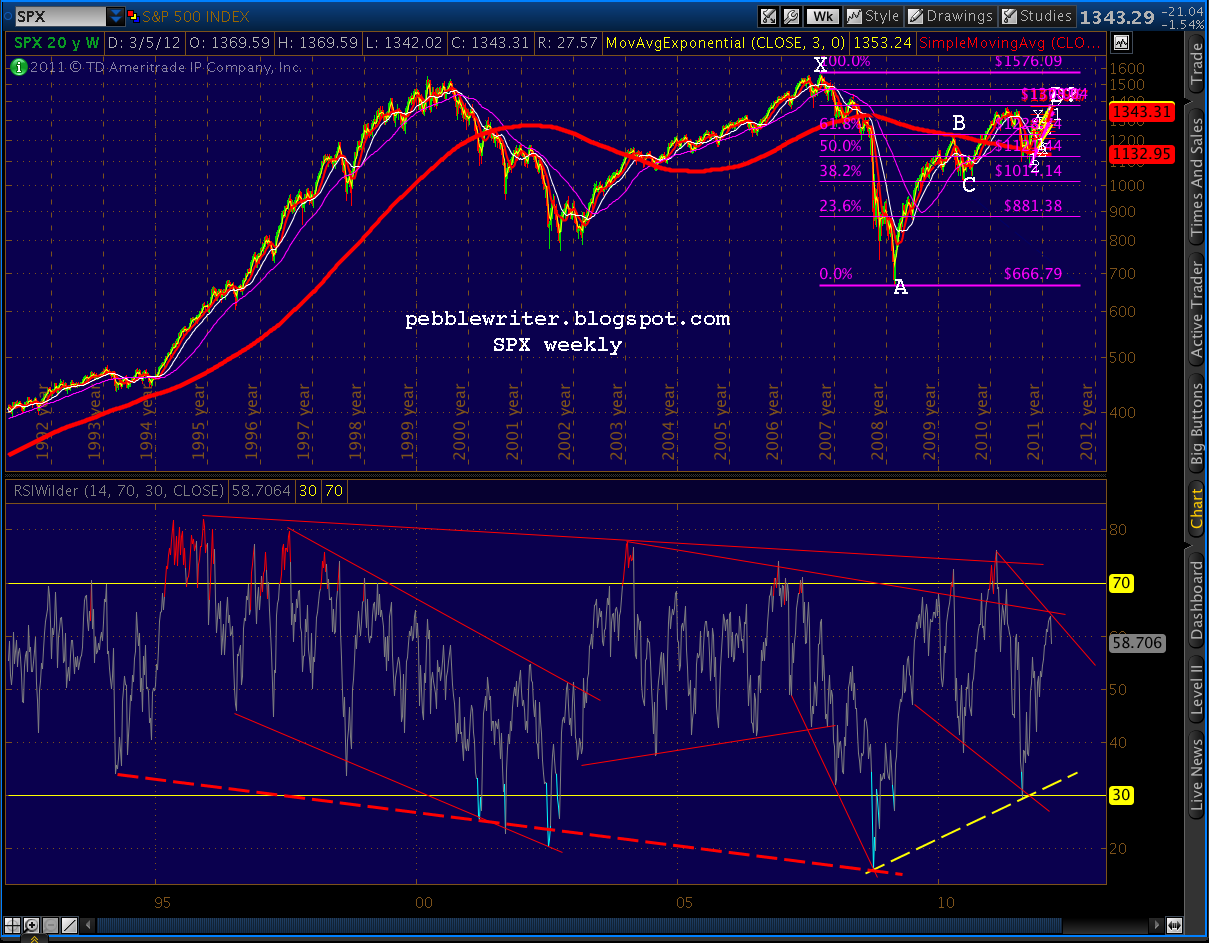
    Looking at the daily chart, we see a similar pattern.  A trend line going back to the summer of 2008 has stopped every RSI plunge except for one — this past July/August.  RSI dropped to a low of 16.46 on Aug 8, the lowest value since Sept 21 2001 when it dipped to 13.64.  On that day, SPX closed at 965, but went on to a low of 768 on Oct 10, 2002 — with RSI back at 41.

    On Oct 10, 2008 (hmm…) RSI made a low of 22.68 with SPX closing at 899.  Five months later, on Mar 6, 2009 (hmmm…!) SPX closed at 683 after making a low of 666.79 — yet RSI was way back up to 28.47.    The pattern continues on the weekly and monthly charts as well.

    I’m going ahead and taking profits on the QQQ Mar 65 puts — just to throttle back the option exposure in our portfolio and because they expire next Friday.  The profit is just shy of 50% —  $1,130 on a $2,400 investment.

    I’m also extending the USO option position out with 10 APR 42 calls.  Although CL is down 1.25%, we got a nice bounce off the SMA 20 and an internal RSI TL on the daily chart.  With our USO position at roughly break even, and the existing option position off less than 20%, I’m inclined to give CL a little more rope — but just a little.  

    I’m giving it the benefit of the doubt primarily because of the fan line from the 2008 high (yellow, dashed.)  We broke through it on Feb 21 and appear to be back testing it.

    In addition to the SMA 20 (104.62) we also have support at 103.7 — the .618 of the larger (purple) harmonic pattern.  That’s likely the line in the sand for the downside.

    ORIGINAL POST:

    Thrilled to see a serious sell-off overnight, but watch for a bounce.  The daily RSI on the e-minis is tagging a long-term trend line right here.

    More later.

  • Yelping for Fun and Profit

    Regular readers have heard me discuss the ongoing battle between “the powers that be” and truth sayers.  TPTB make more money when markets are going up.  They love the status quo.  They love assumptions that you can plug into a spreadsheet and take to the bank. They love steadily rising markets that encourage consumers to spend.  And, they especially love it when the public gets excited about stocks.

    Most of us have heard it said, “if you’re playing poker and you’re not sure who the sucker is, you’re the sucker.  On Wall Street, small investors are the suckers.  They’re the last to get meaningful research.  They’re the last to be presented actionable ideas.  And, they’re the last to clue in when something is overpriced — because they’ve been sold on the idea that it’s the deal of a century.

    If an investment is being offered to an individual investor, it’s because institutional investors have already turned up their noses at it.   When I was a newly minted stockbroker in my 20s, every other week the tax shelter product specialist would show up (with donuts!) and explain all about the next big thing being made available to our clients.  Whether it was Greyhound buses, mini-warehouses or luxury hotels — there were always glossy brochures, impressive pro-formas… and commissions.  Big commissions.

    Before long, someone would shout out “what’s the yield to broker?”  In other words, how much money can I make by peddling this crap?  And, it was a lot.  Typically, there was a 7-8% commission involved, of which brokers could keep 30-45%.  So, a client who brought in $100K in response to an ad they saw during TV golf on Sunday would get fleeced for $8,000 on Monday.  The broker could take home $3,000 at the end of the month.  Three or four of these per month made for a pretty good living for a young master of the universe.

    Best of all, these deals didn’t go south the day after the closing.  So, it took a while before the client realized how badly he’d been hosed.  In the meantime, he’d sign up for several more of these sterling deals — making the broker even more money.   Eventually the deal would flop, the client would get pissed and either leave or sue (oops, guess he shouldn’t have signed that arbitration agreement.)

    The broker would be sad to see him go, but was busy taking in more new customers who had yet to make their contributions to the cause.  There came a point, when Sears bought Dean Witter (“how ’bout some stocks with those socks?”) that it became apparent to many of us young Turks that the game had changed.  We were in the business of selling stuff.  And, our firms didn’t care so much about clients leaving by the back door because so many were coming in the front.

    I grew up watching my grandfather invest.  As the treasurer of a major corporation who cut his teeth at the Pittsburgh Fed during the Depression, he knew his way around the world of finance.  I thought it would be a noble calling — helping investors achieve financial independence.  When I realized during those first couple of years that I was simply a cog in the world of retailing, I lost all interest in being a stockbroker.

    Are all stockbrokers snake oil salesmen?  Nope.  Some have figured out how to maintain their integrity and put their clients first, even if it means being hassled by the sales manager.  But, if your broker is new and works for a firm that advertises a lot on TV, odds are he’s a salesman — not an investment advisor.  Might be the smartest, nicest kid in the world — but, still a salesman.

    When he calls with a very special deal for a very special client — 500 shares of Yelp! — it’s because he’s been told by his sales manager it’s a special opportunity.  It’s special because institutional investors won’t touch it with a ten foot pole.  And, the only reason [insert bulge bracket name here] was hired as an underwriter is because they happen to have thousands of other salesmen whose clients trust them when they call with a special deal.  That means more money for the sellers.  Period.

    In this greater fool world in which we invest, it’s entirely possible Yelp will make a lot of investors a lot of money.  But, remember when your broker calls — or when you see a politician or TV talking head doing their part to prop up the market — the only ones sure to profit are the stock’s sellers and the brokerage firms that do their bidding.