First, props to one of my favorite Daneric participants, Souljester, for the suggestion.

It got me to thinking — sometimes a dangerous thing, but always worth the effort. Here’s why I think P[3] is happening by mid-September at the very latest and before SPX hits 1436.
First, we all know the big picture. We’re nearing the .786 retrace (1381.50) of the Oct ’07 highs. A turn there would satisfy both Fibonacci and create a big, beautiful bearish Gartley pattern.

But, so what? Couldn’t we blow through there on the way to a .886 retrace? Or extend to a gigantic Butterfly pattern at 1800?
I don’t think so, and here’s why.
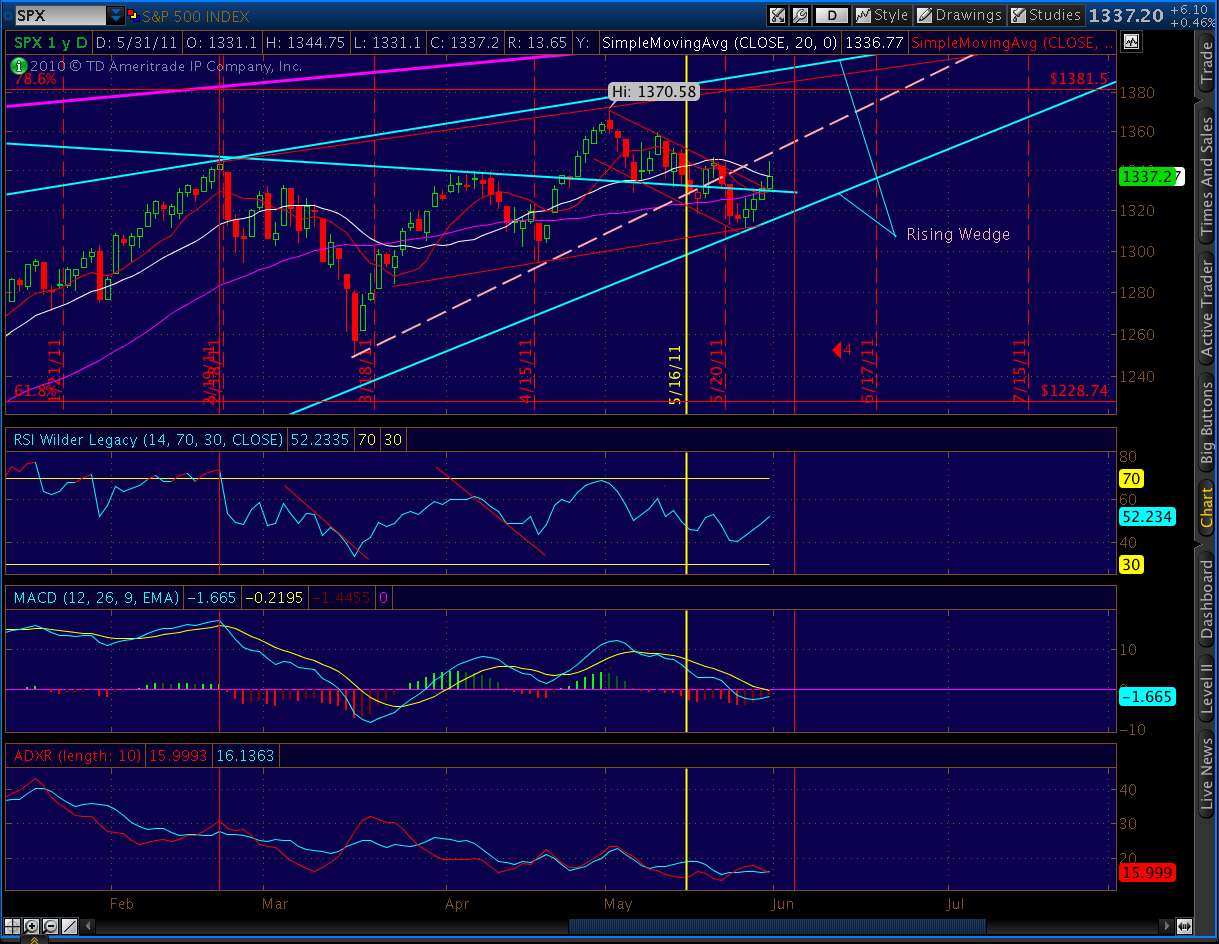
First, the rising wedge that started forming in Mar ’09. It really firmed up in April 2010 and has been a reliable guide to daily swings ever since. It’s apex is around September 12 at 1436. The last two multi-year rising wedges were 1998-2000 and 2003-2007. They broke for 730 and 910 points respectively. And, they didn’t get anywhere near as close to their apexes as we now stand.
To paraphrase, “rising wedges been bery, bery good to me.” I know they’re not foolproof, but I’ve yet to be let down by one in all my years of investing. According to my Handbook of Wedgology, when we break it, we return to GO — at 1010 or 667.
Second, there’s the trendline that goes way back to the 1990’s, seen on my very first blog on May 2. It currently stands around 1408. Guess where it is on September 12? Yep, 1436. Coincidence? I think not.
Third, the underlying economic picture. I know, I know. The stock market isn’t the economy. But, on a long enough time frame it correlates pretty darn well (as any 80 year-old would attest.) I don’t think anyone but a press secretary or a Fed governor would argue the economy’s looking up.

Last, there’s my own little concoction, the 87-day cycle. We’re not completely out of the May 16th woods, yet. The 105th day is Thursday. And, 105 was the longest period we’ve gone in the past 4 years without a good-sized drop (75 was the shortest.) If it doesn’t happen by Monday, then the drop from May 2 was IT. At 73 days it would be on the short side, and at 4.3% it would be on the puny side.
Keep in mind that the study measured the 30 calendar days after each peak, so there’s a few days left to go if May 2 was it. And, sometimes the study caught one peak, but there was a bigger one starting a few weeks later (such as May ’09).
But, if May 2 wasn’t IT, then the next 87th day is August 11 ( the 75-105 day range would be July 27th through August 28th.) Again, this is in the waning days of the rising wedge. It would dovetail nicely with those indicators.
There are other little niceties. Remember the giant inverted H&S; pattern? It indicated an upside of 1436 — hmmm, there’s that number again… I’ve also noticed significant similarities between the past few months and the tops in 2007 and 2000. More posts on that to follow.
Bottom line, I feel strongly that the next 3 months will mark a major top — although it could be as soon as this week. Rarely do rising wedges grow this long in the tooth before the eventual decline; and, like I said, we’re not out of the May 2 woods just yet.
We probably won’t be able to characterize the drop as P[3] until after the fact. Until then, it might be another significant correction on the way to QE-infused infinity. But, it should be enough of a move so that wily traders can amass enough dough/gold/farmland to survive what I expect to be very difficult times.