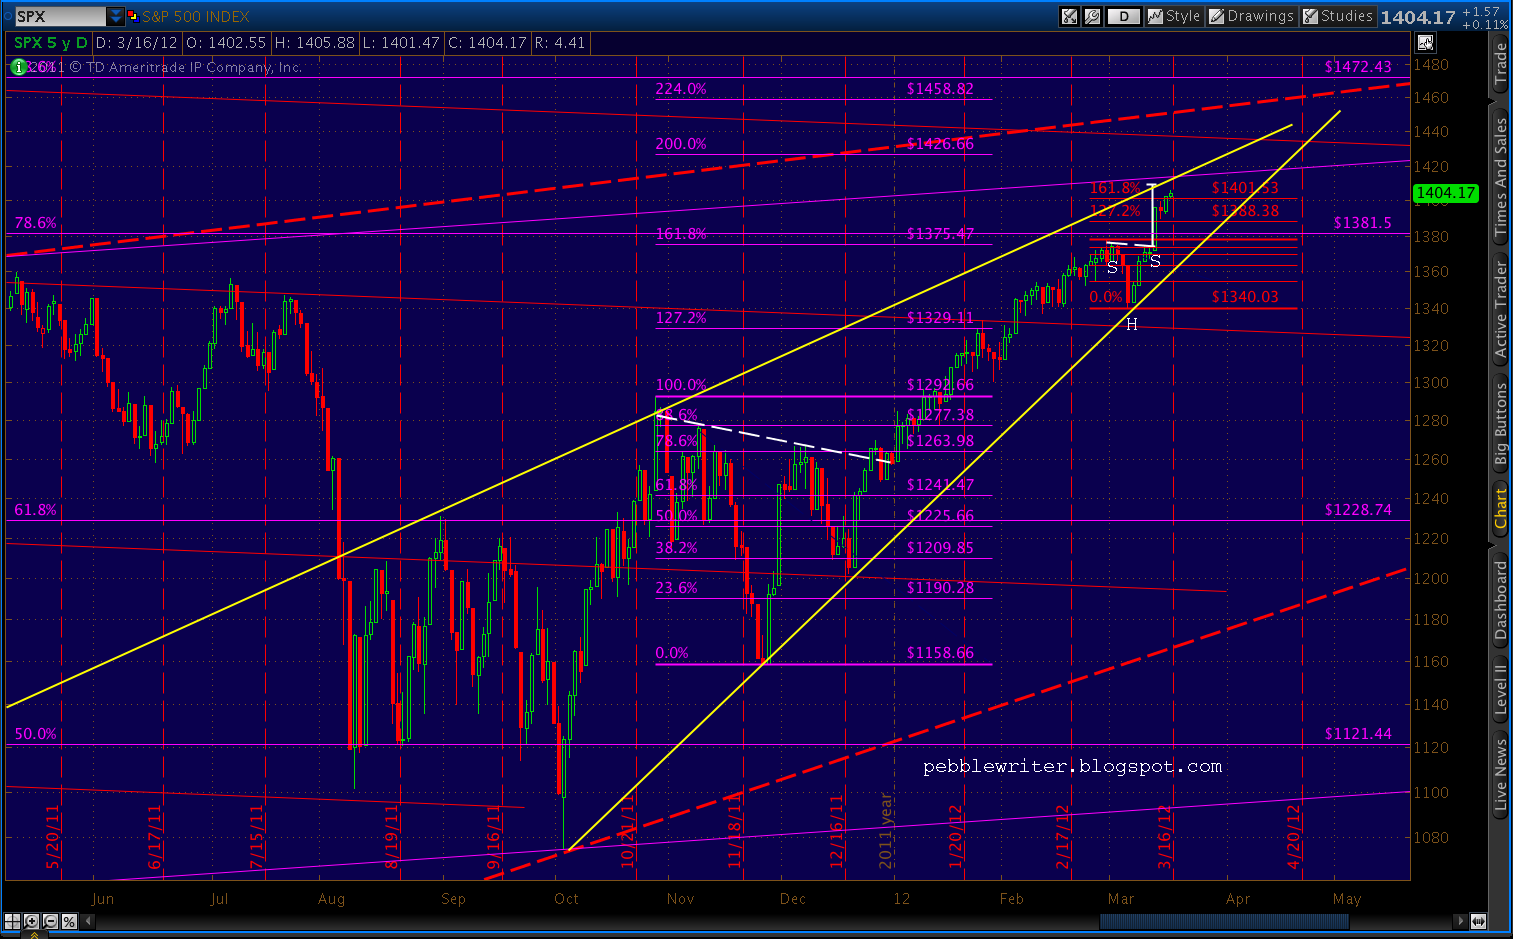
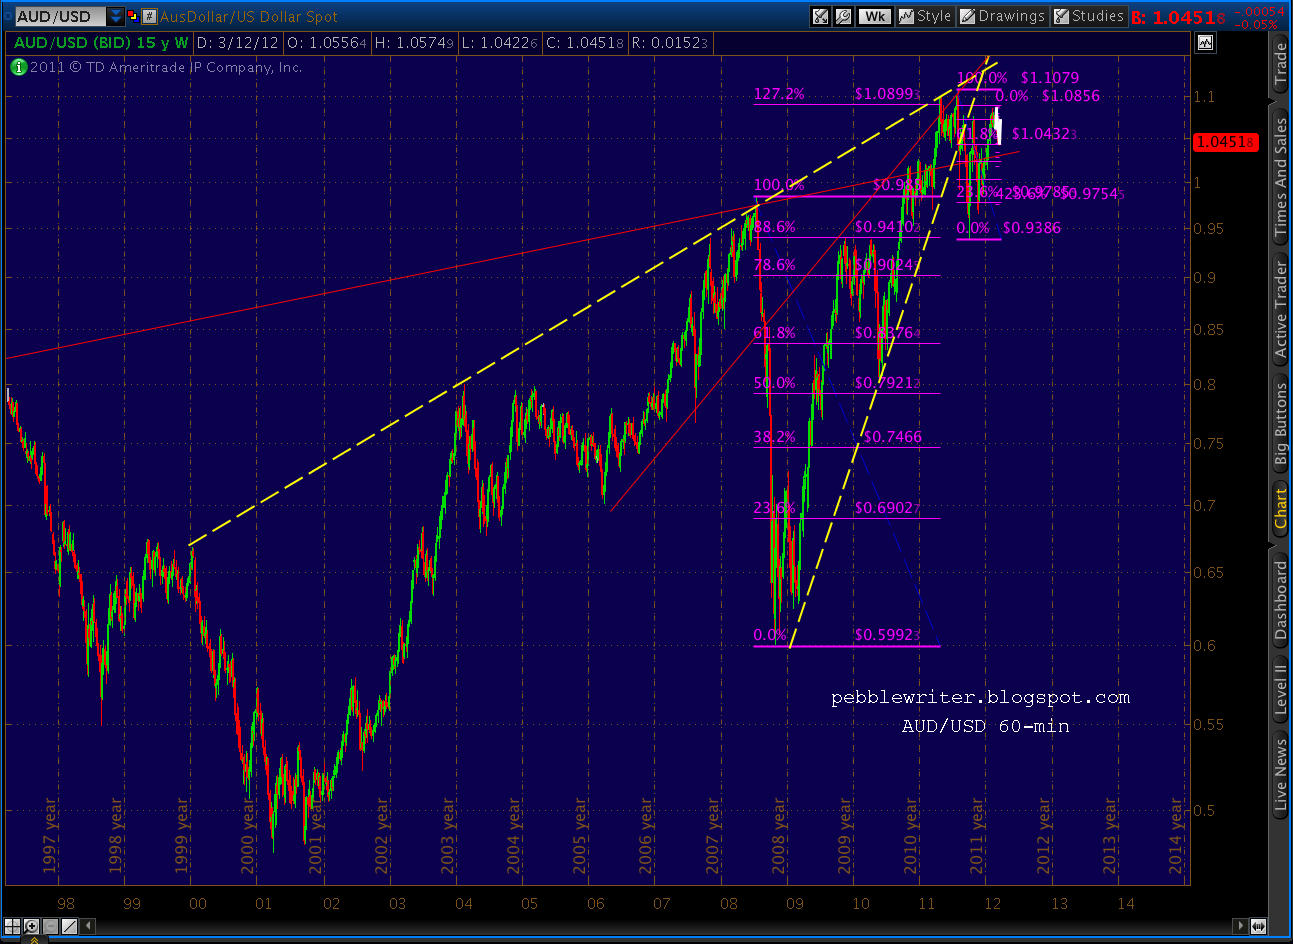
We’ll start with the weekly version of the chart of channels I posted last night…

The parallel diagonals are by no means the only way to skin this cat, but they do demonstrate the market’s tendency to relate future moves to past and present. Just about all the turns are guided by the red downward-sloping trend lines; most of those that aren’t are guided by the purple upward-sloping lines. The handful of turns that don’t relate to either all correlate with a Fibonacci level.

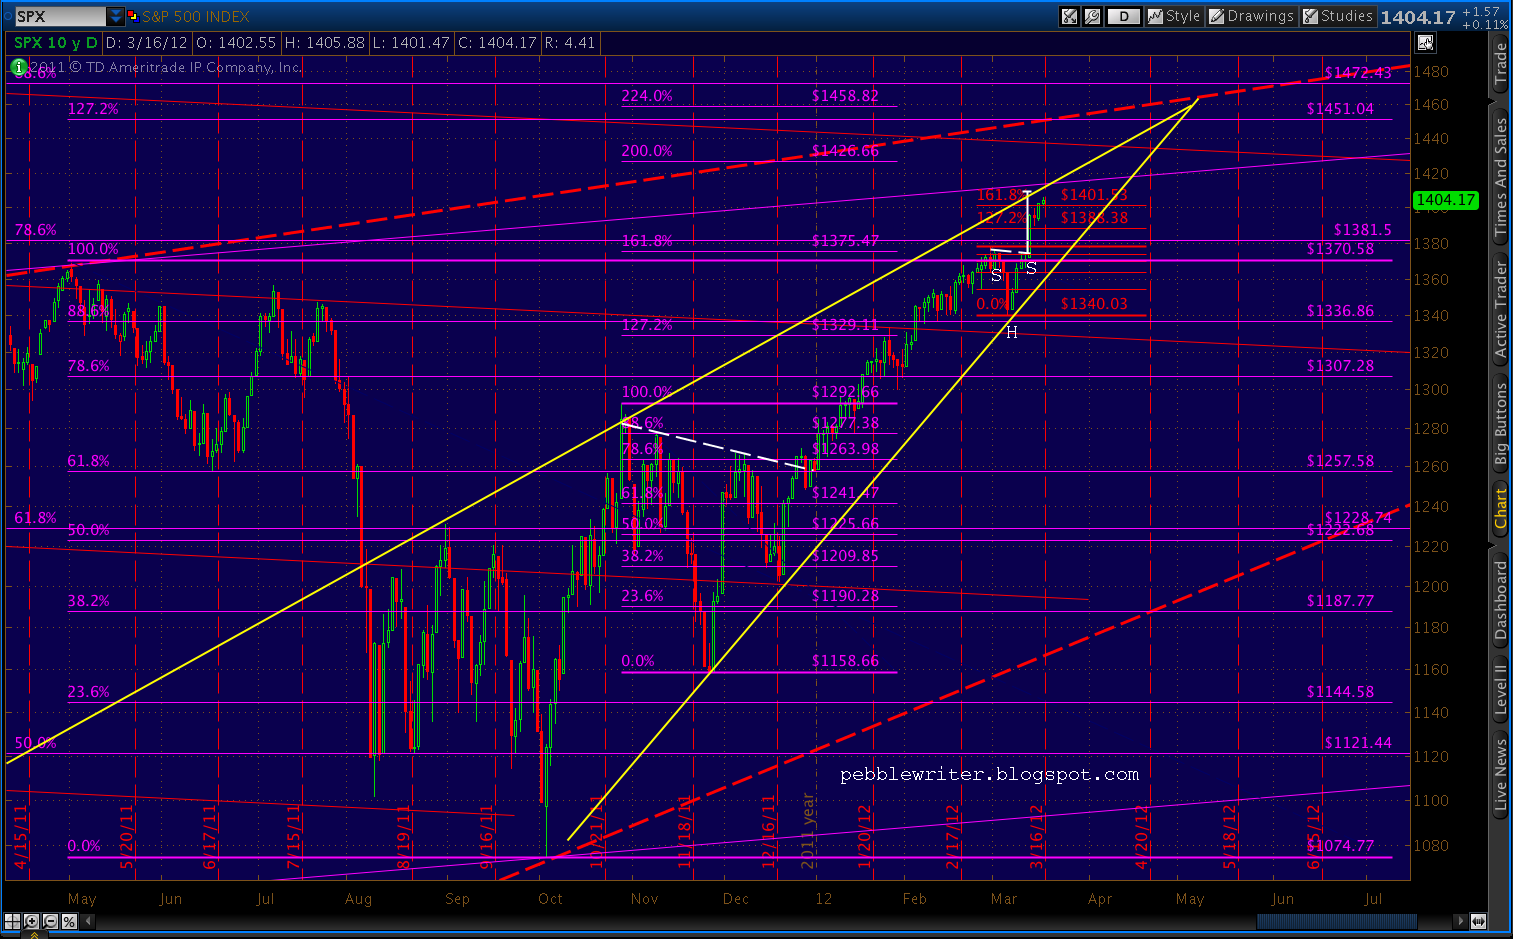
There are two rising wedges visible on the chart. The dashed red lines both originate off important lows — the late 80’s/early 90’s and the Mar 09 low and come together for an apex around January 2013 at about the 2007 high of 1576. The solid yellow lines originate off the Mar 09 and Oct 11 lows and feature an apex around May of this year at about 1472.
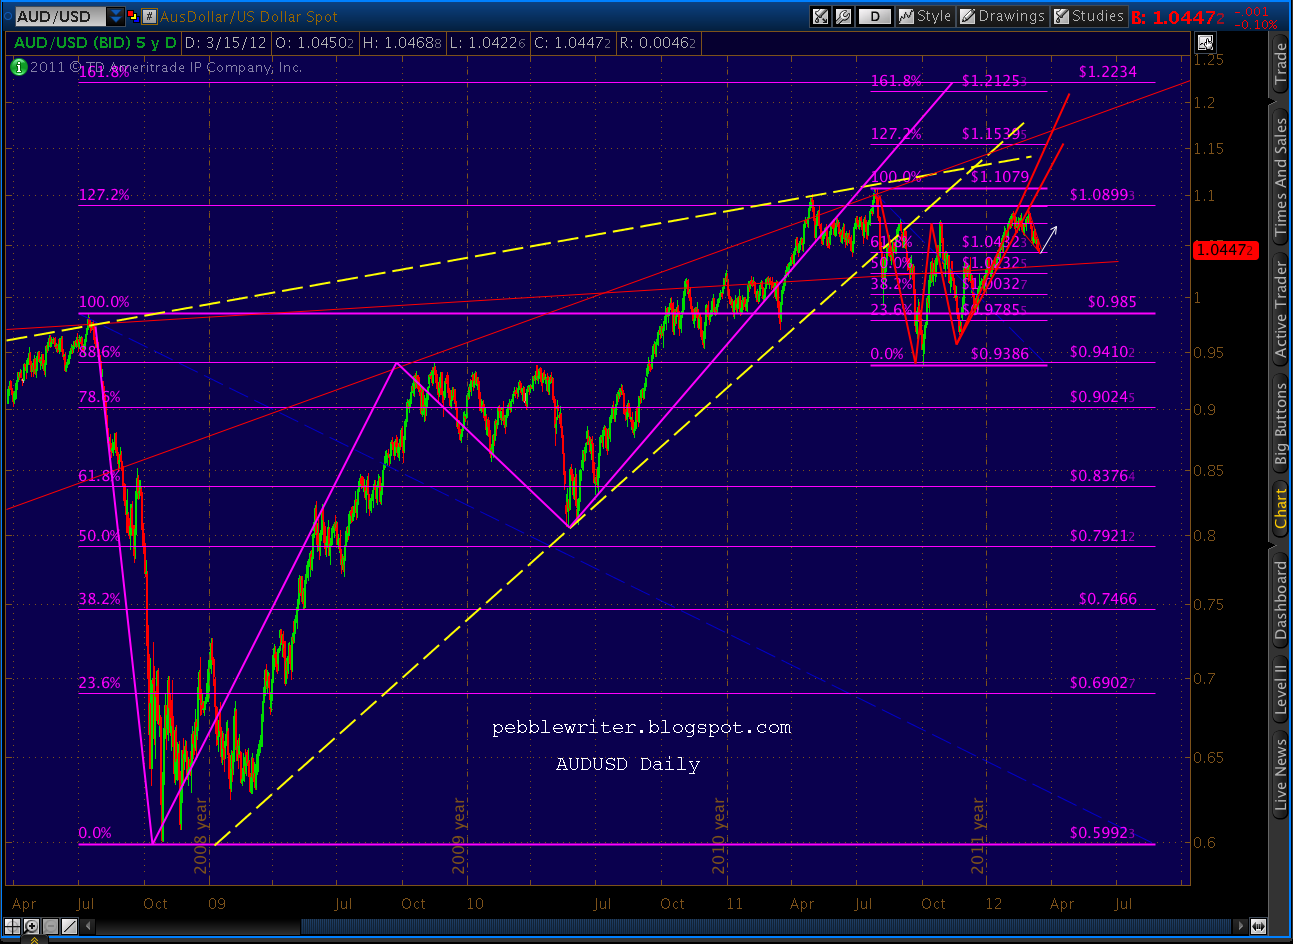
What’s particularly interesting to me about these two wedges, besides the bearish implications of rising wedges in general, is how they relate in time and price. Note that the average rising wedge breaks down at about a Fibonacci .618 of the time from its origin to its apex. And, in most cases rising wedges break down at Fibonacci price levels as well. Let’s look at our two wedges.
First, the smaller yellow wedge’s apex at 1472 comes in right at the .886 Fib level of the Oct ’07 – Mar ’09 decline — which is also at about a Fibonacci .886 of the red wedge’s rise from Mar 09 to its apex.
Second, the time from inception to apex for the small yellow wedge is 3.1 years. The time from inception to apex for the larger, red wedge is about 5 years. Divide the former by the latter and you find the time relationship between the two is a Fibonacci .618 — seen in the following graph.

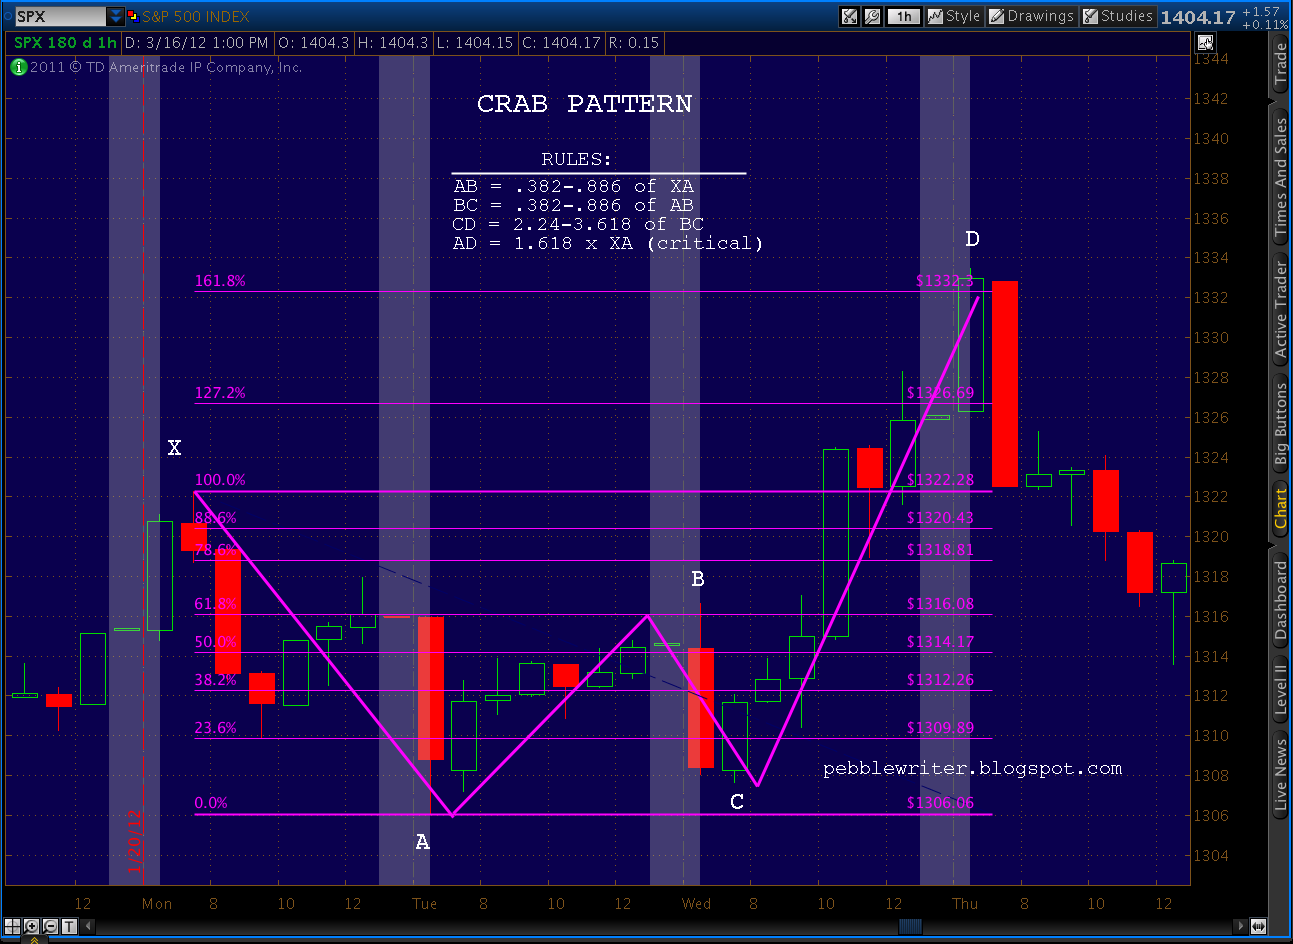
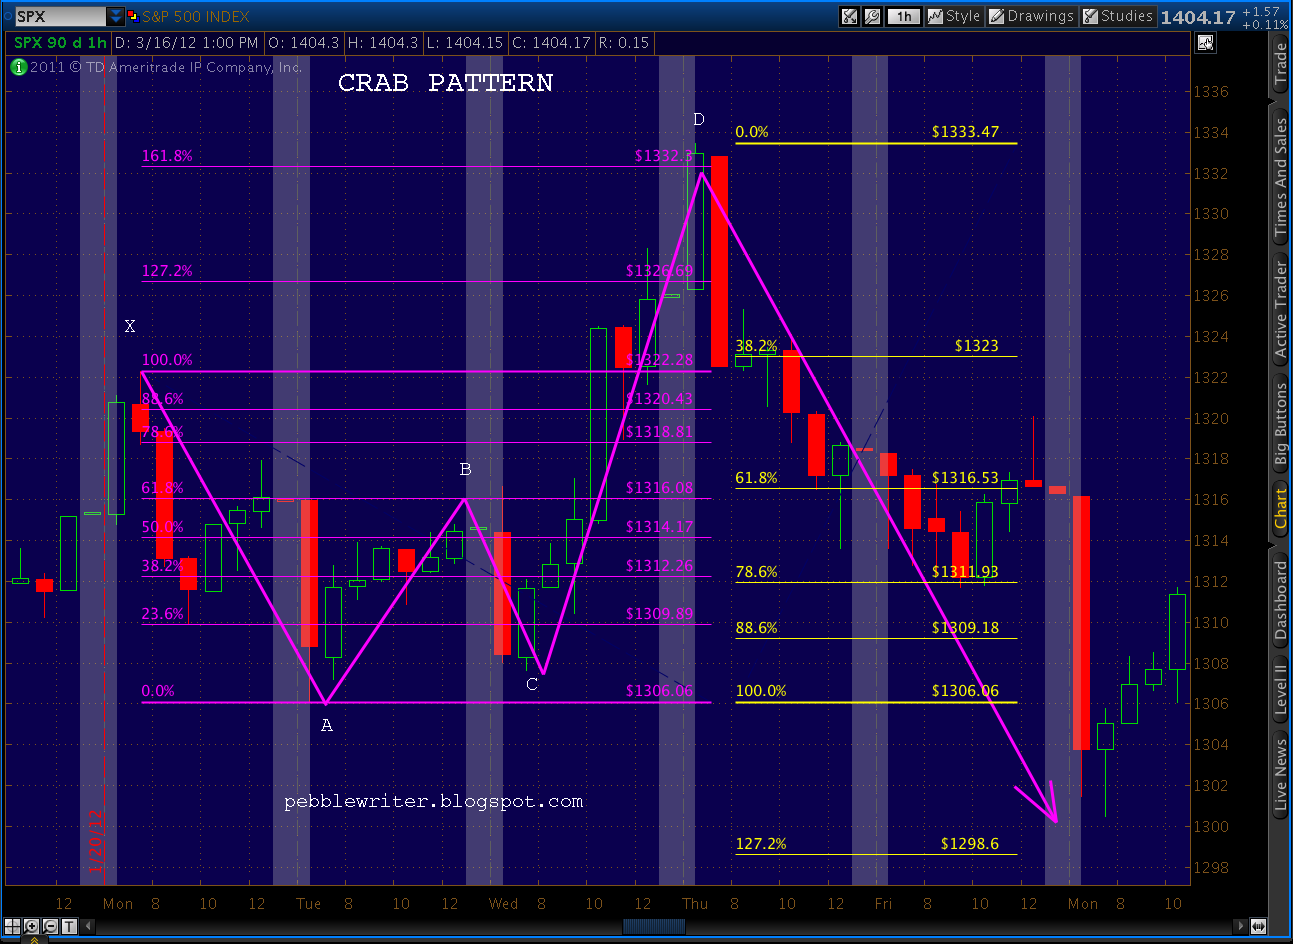
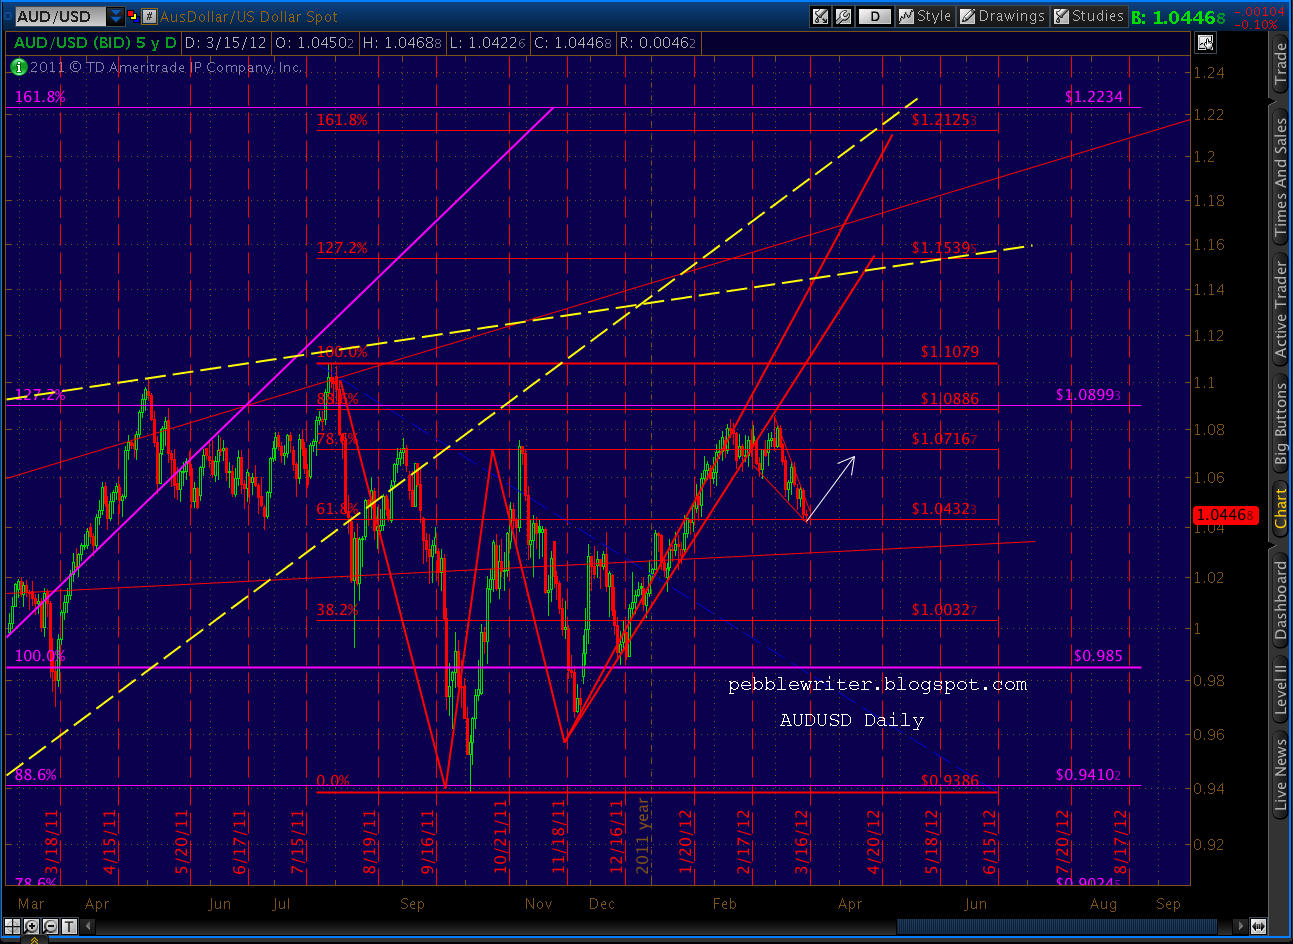
A close up reveals that movements within the small, yellow wedge are nearing some important Fib levels. Prices are very close to the .886 (1418) of the price range. And, Wednesday Mar 21 will mark the .786 of the time range. Again, both of these measurements assume an apex of 1462 on May 7 — a location which is as close as I can draw it, but a bit of an approximation.
Last, note that the intersection of these to Fibonacci levels occurs at the intersection of two of the channel lines we drew in that first chart above. While channel lines are much more guidelines than absolute rules, a bounce at that four-way intersection would certainly make a lot of sense.
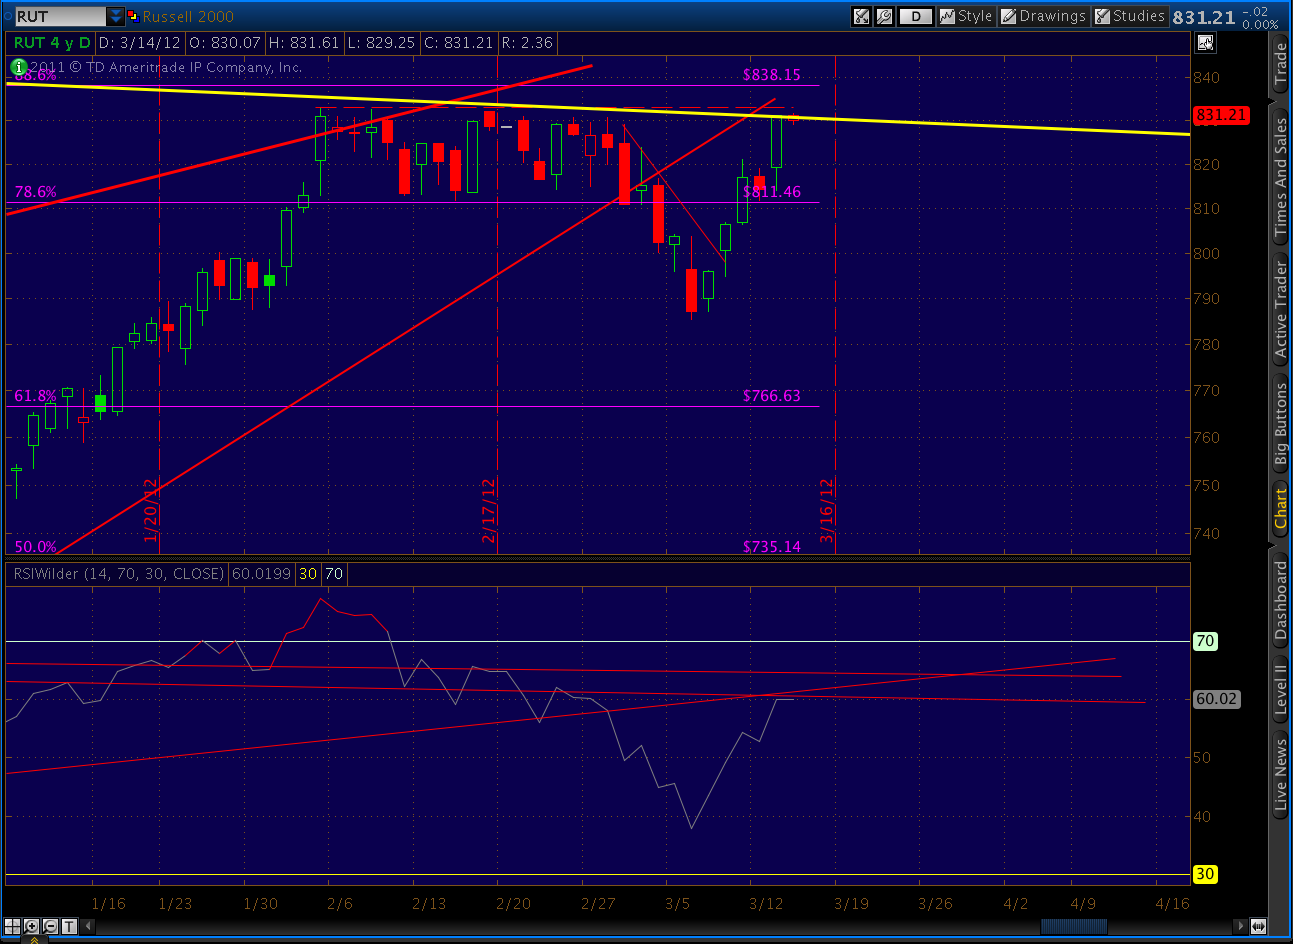
From what I read, the most logical Elliott Wave count is that we’re setting up for a wave 4 correction — unless this is the 5th and final wave up in this monster bear market rally. This would be a very logical place. Note also that there is very noticeable divergence on the daily chart, with the mother of all back tests on the dashed yellow TL that was broken two weeks ago.

One last note on this RSI chart… the drop in RSI from that brief downturn was massive compared to a measly 38-point price drop in SPX. Compare this to the RSI drop in July, for instance, and it’s pretty clear that the technical damage done to the market’s internals has yet to be reflected in prices. A strong downturn in the next few days could rectify that.
Last, thanks for your patience this week as I rush to finish the new website layout. Lots of moving pieces that I think folks will enjoy, but it’s taking time. I’m watching during the day, of course, as things develop (or not.) But, I’ll be keep my posts to a minimum unless there’s something important to say.
Good luck to all.