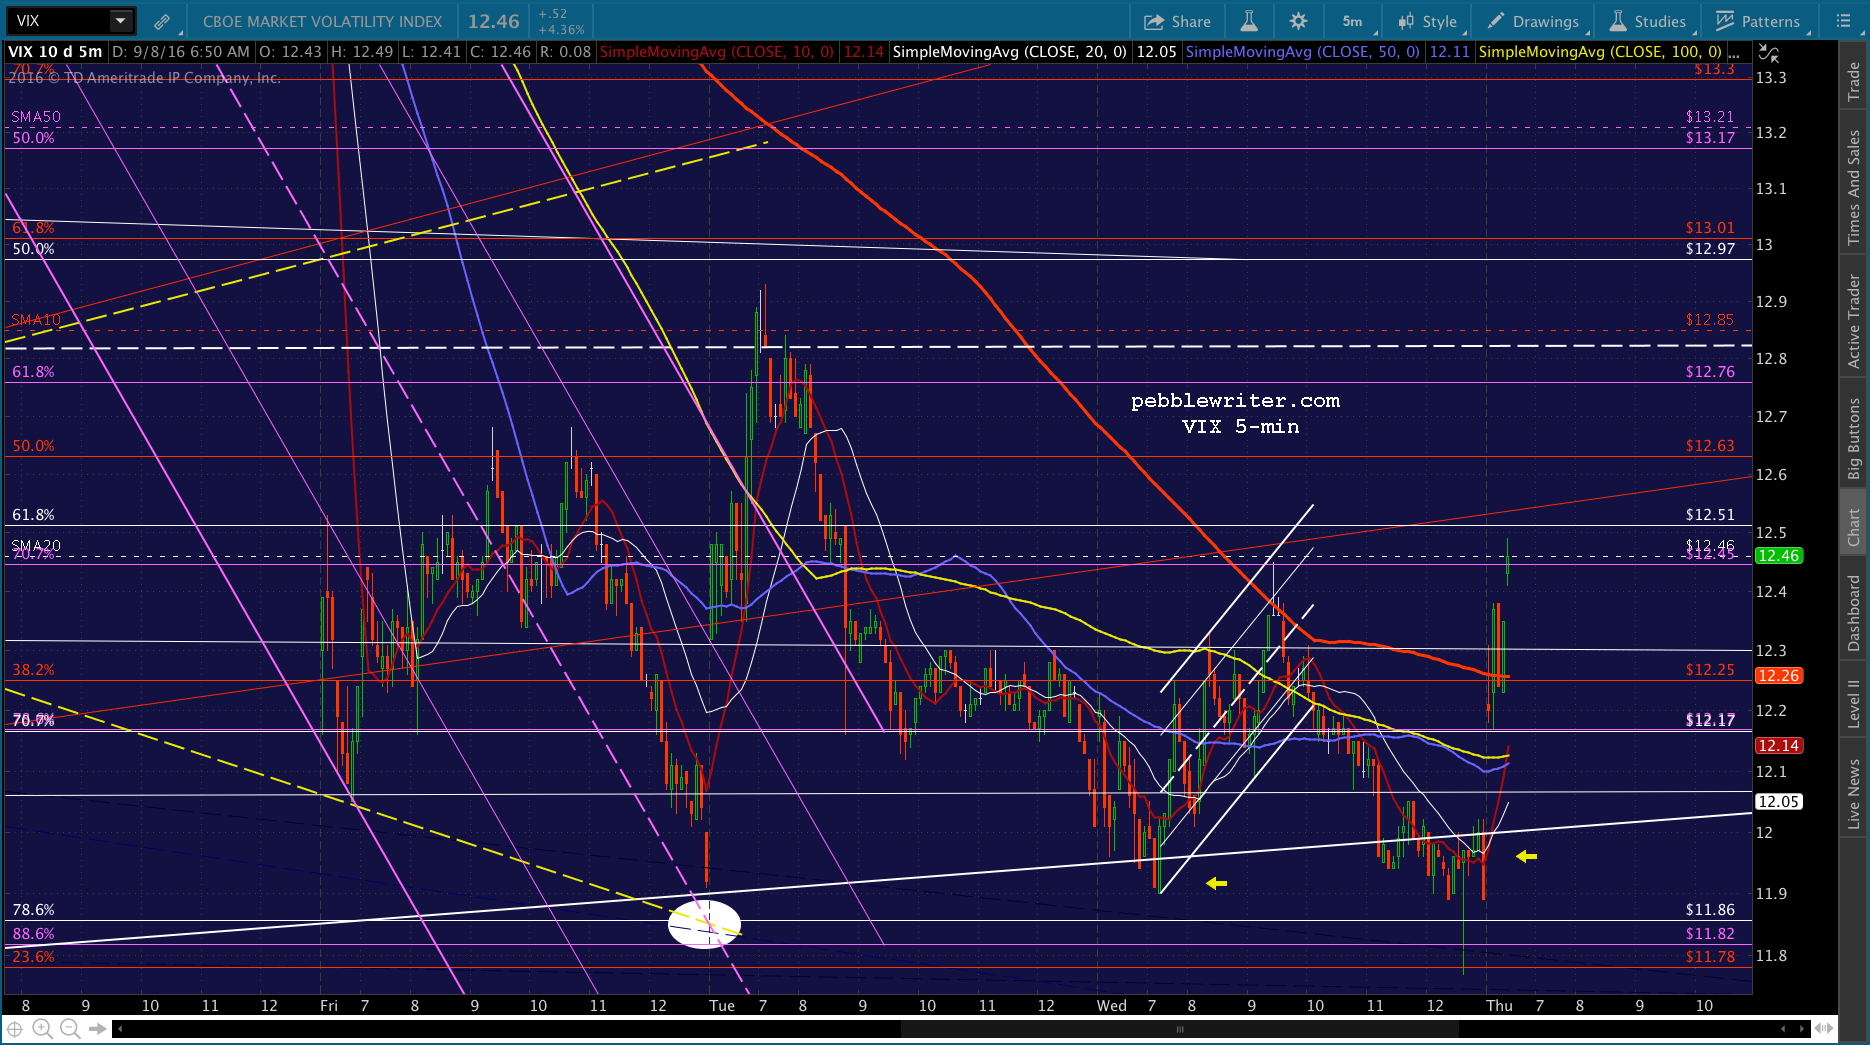

Category: Charts I’m Watching

  • Oil Makes Its Move

    The news has been pretty awful for oil over the past few days.  But, it’s been stuck at its SMA50 because to go lower would have meant a drop below critical support for SPX. 2016-09-14-cl-60-cu-0610With yesterday’s lame breakout of USDJPY, however, CL finally has some cover while it tags its own important support — which could set the stage for a real bounce.

    Of USDJPY and CL, only one can really bounce.  Higher oil prices are incompatible with a lower yen.  It’s part of the deal between the BoJ and FOMC.

    They are allowed to bounce at the same time for only a short period in order to, say, ensure SPX doesn’t make new lows.  2016-09-13-usdjpy-5-1058We saw this yesterday when USDJPY spurted higher, breaking out of a falling channel on a recycled news story in Nikkei (about even lower negative rates) that was released the very minute SPX needed propping up.

    2016-09-13-spx-5-1059

    It halted SPX’s decline at 1.15 above Monday’s lows.  It’s about all central banks can do, anymore — which is a little scary.

    As the past several sessions illustrate, the corner into which they’ve painted themselves is getting tighter and tighter.

    continued for members…

    Holding the white channel bottom is the key.

    2016-09-14-cl-60-0610

    Again, made possible by USDJPY’s breakout.2016-09-14-usdjpy-60-0600

    Equity charts for the day:  ES might be able to hold the red channel bottom. 2016-09-14-es-60-0610 But, if it breaks down, it will be so SPX can make a nominal new low that establishes a C wave to go with its A.
    2016-09-14-spx-60-0600

    I think this is what they were going for yesterday when the Nikkei story hit.  Recall that the bounce was extremely lackluster, and never got close to breaking out.2016-09-14-spx-5-0702

    My guess is they’re waiting for the EIA inventory report at 10:30 ET, at which point we’ll get a very quick spike down to CL 41.37 – 43.50.  SPX might or might not make a nominal new low depending on how fast it happens.  But, I think they’ll have CL bounce higher after finding support, which should allow everything else to recover and USDJPY to resume falling.

    It’s a little convoluted, I know.  But, that’s what I expect.

    UPDATE:  10:18 AM

    SPX is testing its SMA100 again, with the SMA5 200 just above.  This would be a good place for a reversal if CL takes much of a dive.  On the other hand, it would be great place for a breakout.  I’d try a short position here with tight stops.2016-09-14-spx-5-0718

    2016-09-14-cl-60-0722

    2016-09-14-usdjpy-5-0724

    The tricky part is VIX, which can prop things up pretty easily with even a slight dip below the SMA200 at 16.72.2016-09-14-vix-daily-0725

    UPDATE:  10:37 AM

    Inventories decreased 600K barrels versus last week’s 14.5M.  It’s mildly bullish for oil — which ran up to tag the falling red channel top and seems to be stalling there.  For its part, SPX was buoyed by VIX dipping below its SMA200 and a TL off recent lows.  It spurted up past the SMA5 200 (2136.65), where it will potentially backtest it as the SMA5 10 comes along in 10 minutes or so.2016-09-14-cl-60-0740

    2016-09-14-vix-5-0736 2016-09-14-vix-5-0730

    This is pretty much backwards of the sequence I expected, but it might turn out anyway.  Keep an eye on VIX and the white TL.  A rise back above it and the SMA200 would be a signal of lower stock prices to come.  Otherwise, we’ll get the backtest mentioned above and not much more.

    FWIW, ES just reversed off of overhead resistance — the purple TL.2016-09-14-es-5-0744

    UPDATE:  11:18 AM

    So far, so good.  VIX is back above its SMA200…2016-09-14-vix-5-0817…while SPX is back below its 2015 highs and the SMA5 200.2016-09-14-spx-5-0816 CL is continuing lower.  2016-09-14-cl-60-0819While, USDJPY is diving nicely…2016-09-14-usdjpy-5-0817…and even DX is cooperating.  If it were to drop through the support zone at 95.22ish, things would accelerate to the downside. 2016-09-14-dx-daily-0816It’s still unclear whether or not we’ll get a new low.  CL is probably nearing its downside potential.  Though, the bottom of its rising white channel was fairly tough to place with any certainty — thus the large downside target range.

    UPDATE:  12:17 PM

    CL is inching lower and DX is poised to do likewise.  But, VIX is propping up SPX by loitering at its SMA200 — switch they can throw any time SPX starts to dip.  I’d revert to cash here, as it seems unlikely to make any lower lows for now. If VIX bounces back above the SMA5 200 at 17.11, I’d look at shorting SPX again.  But, I’d hold off on a long position until CL reverses.

    I hesitate to cover the short, as I still believe in the premise of a drop to either new lows or, at least, the white TL down around 2128ish.  But, with VIX sitting right there ready to drop like a rock, it’s hard to feel comfortable with a short position.2016-09-14-cl-60-0916 2016-09-14-vix-5-0916 2016-09-14-spx-5-0915

    Note that while NKD broke down through its latest white TL, it has just about reached the .886 shown below.  So, they could be setting it up for a rebound.2016-09-14-nkd-60-0923

    UPDATE:  12:39 PM

    I’ll take another crack at a short position down to the white TL (2129ish.)  Probably a waste of time, but VIX seems to be getting a bounce and NKD is slumping a little.2016-09-14-spx-5-0939

    2016-09-14-vix-5-0941

    The key will be VIX getting past the SMA5 200 at 17.10.

    UPDATE:  2:24 PM

    Making progress toward a new low.  ES just reached its SMA10, so that will be a challenge getting below it.  Should get a bounce somewhere in here as CL is almost to its white channel bottom.2016-09-14-spx-5-1123

    At this point, I’d say CL is low enough.  The only remaining question is whether or not SPX wants to make a new low.  Since nothing is spiking higher, and VIX is still above its TL and SMA5 10, and NKD is still below its .886, I’d say yes, they’re setting it up for new lows.  It’ll likely happen right away, at the close, or first thing tomorrow morning.2016-09-14-cl-5-1133

    While it will be gratifying if it happens, it is likely to leave us with the issue of holding overnight.  New lows into the close is frequently a bear trap — triggering stops who then get creamed when it gaps higher the following morning.

    UPDATE:  2:55 PM

    Probably just a head fake, but VIX is dipping lower and NKD is testing resistance.  Odds are they’re just trying to get a SMA5 20 tag before another leg down, but I’d take profits here and reopen the short if it reverses after the top of the hour.2016-09-14-vix-5-1155 2016-09-14-nkd-5-1155 2016-09-14-spx-5-1155

    UPDATE:  3:00 PM

    One last shot at a leg lower.  If it does dip more, it’ll probably be CL, which looks like it wants a little deeper retracement before what should be a strong rally.2016-09-14-cl-5-1201 2016-09-14-vix-5-1201 2016-09-14-nkd-5-1201 2016-09-14-spx-5-1200

    UPDATE:  3:32 PM

    I’m not sure if we’ll get new lows or not, but this is close enough IMO — especially with VIX settling toward the white TL again.  Back to cash for the night, though if VIX started spiking I’d give some thought to shorting again.  And, if SPX makes a slightly lower low and VIX starts crashing, I’d sure think about going long for the bounce.2016-09-14-spx-5-1232

    2016-09-14-vix-5-1237

    UPDATE:  3:50 PM

    Probably nothing, but we could get another leg down from this little backtest.  Back to short with very tight stops with a target of 2119.  If it doesn’t start down right away, I’d blow it out.  I have no interest in holding overnight — even if it dips to 2119 and keeps going.

    2016-09-14-spx-5-1250

    UPDATE:  3:59 PM

    Covering.  I think we’ll get a little more in the morning, but can’t see making that bet overnight.  I have to run out for a little while, will post more later this afternoon.2016-09-14-spx-5-1259


  • Third Time a Charm?

    After collecting 64 points on last week’s short and 39 points on yesterday’s bounce, the past week has delivered over 5%.  I was gradually getting more comfortable with our swing positions, and yesterday felt a lot like many past melt-ups that barely paused — let alone corrected on their ascent.

    But, a little voice in the back of my head kept whispering “backtest.”  Seeing that S&P 500 futures are off over 17 points, I’m glad I listened yesterday afternoon and booked profits from our long at 2120 rather than holding overnight.

    This is exactly the sort of overnight move that has made swing trading so difficult.  Big gains during the day often mean gaps down overnight.  And, vice versa.  It’s a by-product of the constant manipulation of currencies and futures which has expanded over the past 5 years.

    continued for members… (more…)

  • Are We There, Yet?

    Friday’s sell-off came a day earlier than originally expected and pushed past our initial target by a few points.  But, of course, it was long overdue in a general sense — adding to the general sense of panic that would otherwise never be associated with a 2.4% dip.

    2016-09-12-spx-60-0545

    We saw futures continue lower yesterday, testing 2100 before a sharp upturn this morning.

    To be clear, there is a real risk of the Fed dropping the ball here.  They’ve done it before, and they’ll do it again.  If all depends on what happens when SPX tests our secondary target: the SMA100 at 2120.

    continued for members… (more…)

  • Psyops and the FOMC

    I’ve made no secret of the fact that I expect a rate hike in September.  Investors are weary of the drip, drip, drip of slightly higher indices, and SPX is very much in need of a backtest of the critical Fib at 2138.  In fact, I’ve had a 2138 target on Sep 12 ever since August 19 [see: The Big Picture.]

    We’ve talked about the importance to the Fed of maintaining a high US dollar.  It’s been painfully obvious from all DX’s stick saves over the past two weeks.  2016-09-09-dx-60-0545Without a high dollar, we’d have more noticeable inflation.  More noticeable inflation would raise too many inconvenient questions about the Fed’s easy money policy — which has been sold as the very solution to low inflation (as readers have known for years, its real purpose is to re-inflate asset prices.)

    That’s why a September rate increase which prompts a temporary decline to backtest 2138 — the biggest decline since Brexit at a whopping (sarc) 2.5% — makes so much sense.

    Or…is that simply what the Fed is trying to have investors believe?  We all know about open market operations; what about psychological operations?  With the US dollar back above its resistance zone through jawboning alone, is an increase still necessary?  What if SPX reaches 2138 today?

    2016-09-09-spx-60-0615

    We remain short from Wednesday afternoon.

    continued for members… (more…)

  • ECB Fails…Again

    No one believes Draghi anymore, but everyone’s too polite to call him on his ridiculous statements regarding his policy’s effectiveness.  Note the EURUSD’s spike higher this morning. 2016-09-08-euerusd-daily-0600If the falling white channel holds, it’ll be because central banks hold it there.  We’ve already seen the Fed turn backflips in order to support DX’s rising channel from May.2016-09-08-dx-60-0712

    And, does any of this really matter, if the folks scripting the “market” have things well in hand?

    continued for members…

    Yesterday, it was all about VIX again. 2016-09-08-vix-5-0600 2016-09-08-vix-60-0600The continuing push below the month-old white TL was enough to get SPX back out of the falling red channel again.  Of course, this morning, it’ll be right back within it. 2016-09-08-spx-60-0600ES, on the other hand, will backtest its falling red channel again.  The one it broke out of already.  So, it remains a tale of two “markets” – with ES broken out and SPX not.  One is correct.  But, which one?2016-09-08-es-60-0600CL has been a great help, breaking out of the falling red channel and establishing a new, more bullish uptrend.
    2016-09-08-cl-60-0600

    And, USDJPY, by breaking out of the falling red channel and going sideways for the last 24 hours, has at least done no damage to stocks.2016-09-08-usdjpy-60-0600

    NKD has formed a nice little H&S Pattern targeting 16500ish — about where the SMA100 is. Will they allow it to play out?  Lately, NKD declines have been used, along with VIX pops, to power SPX lower when necessary (backtests, etc.)2016-09-08-nkd-60-0600Last, RUT broke above its .886 yesterday on VIX’s smackdown.  Now, to see if it can hold…2016-09-08-rut-60-0630

    Look for ES and SPX to hold their SMA10s at 2176 and 2176.79 today.  Anything lower, and ES’ yellow TL should kick in as it always seems to: about 2174.35.

    Today’s response to the ECB decision should tell us whether 2138 by Monday is even a possibility.  Clearly, investors are disappointed that the ECB isn’t dropping cash from helicopters or buying equities (something Draghi says the ECB hasn’t even discussed – calling bullshit on that one!)

    So, stocks have every reason in the world to decline, and would if we didn’t have this happening in USDJPY…2016-09-08-usdjpy-5-0649…and, this in CL…2016-09-08-cl-5-0650…and, this in VIX.2016-09-08-vix-5-0750

    As long as SPX remains below the purple channel midline, 2138 is a possibility.  But, the fact that it keeps bouncing up above it by the close makes a short position dicey, to say the least.

    I’d look to get long again around SPX 2176.79.  If the important SMA10 doesn’t hold, then we might get some excitement going.  The next support is down around 2167 – the bottom of the rising purple channel.  There, it’s only 31 points to the 2138 backtest, presumably on Monday.  After staring at these charts every day, I’m still only 50:50 about it.

    I have some things to attend to today, so will probably peel away about midday.

    UPDATE:  11:15 AM

    ES reached its SMA10, but SPX came up a little short.  While it was vacillating between a breakout and another leg lower, the EIA report came out, confirming yesterday’s API report of a huge 14.5 MM barrel inventory drawdown.

    VIX plunged .50 in seconds ( a deep retracement of yesterday’s purple .886 tag) and SPX raced up to close this morning’s gap.  At this point, SPX is back at the purple midline that it’s had so much trouble breaking above.

    For anyone not still short from yesterday, I’d short here with relatively tight stops.2016-09-08-spx-5-0815 2016-09-08-es-60-0813

    2016-09-08-vix-5-0820 2016-09-08-cl-5-0820

    UPDATE:  3:41 PM

    SPX has made a couple of attempts to get down to 2176.79 — the SMA10 based on yesterday’s close.  But, it might not.  Its low for the day was 2177.49.  If SPX closes right here, the daily SMA10 for today would be about 2177.46.  So, it’s entirely possible that they’ll consider it close enough and move on.

    It certainly appears as though VIX is readying itself for another last minute hammering – which would get SPX back above the red channel top.  I get tired of saying it, but don’t hold overnight unless you can carefully monitor your position, hedge it, or stand the possibility of a gap higher overnight.

    Of course, with 20 minutes to go, there’s still a chance that ES will dip down to its yellow TL at 2175 and SPX will close at 2176.79 today instead of tomorrow morning.  TPTB have pulled out all the stops to prevent a serious decline after the ECB bombed this morning.  They hate to admit it when the “market” pukes on their press conferences.  Maybe allowing a small decline into the close would be a good way of reinforcing the importance of additional easing…

    CL, having “broken out,” has run out of room and should return to test the white channel bottom (43.50ish) it missed the other day.2016-09-08-cl-5-1241 2016-09-08-vix-5-1241 2016-09-08-spx-5-1241

  • Tick, Tick, Tick…

    To watch C-SPAN’s coverage of today’s House Financial Services sub-committee on Monetary Policy and Trade featuring Esther George and Jeffrey Lacker, CLICK HERE.  Watch for the two bubbly central bankers to make their best case for unchecked power.Screen Shot 2016-09-07 at 7.12.03 AM

    I read this morning that the volatility in the Dow over the past 40 sessions (high to low range of 2.27%) is the lowest since at least 1915, possibly ever.  While it fits nicely with our analog, and is therefore somewhat heartening, it also suggests a great deal of volatility lies ahead.

    Consider the US dollar’s continuing climb in the same channel for over four months.  If the FOMC really isn’t going to raise rates in a few weeks, is there any reason for DX not to have sold off by now?2016-09-07 DX daily 0600

    continued for members… (more…)

  • Update on Analog: Sep 6, 2016

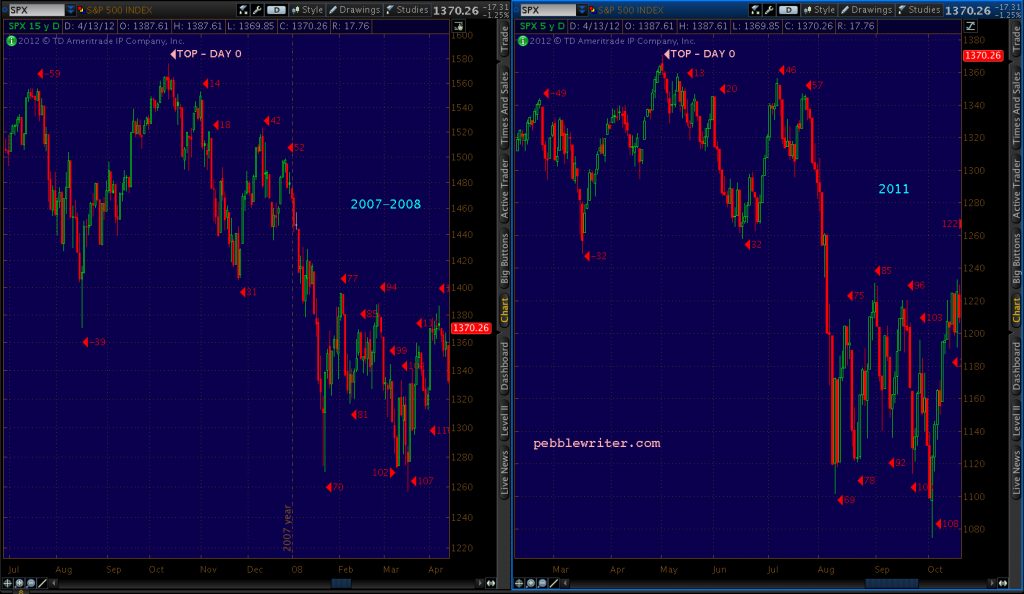
    This morning we’ll take a look at the analog first offered on Aug 3 and updated in the Big Picture on Aug 19.

    continued for members… (more…)

  • Update on RUT: Sep 2, 2016

    When we last took a look at RUT [see: May 30, 2016 Update] it was pushing higher within a steep channel, but was going to run into resistance very soon.  I closed my eyes and threw a few darts, and this is what stuck: upside targets at 1200 and 1255.77, and a downside target at 1070 (just in case the channel broke down.)

    2016-05-30 RUT daily ECU 1900

    Little did I know at the time that all three targets would end up coming into play.  Here’s the same chart, updated with the price action for the three months since then.2016-09-02 RUT daily 1155

    RUT reversed at 1190.17, 10 points shy of the purple target, then plunged 9% to 1085, 15 points shy of the yellow target.  It then spiked over 12% to come within 5 points of the white 1255.77 target — where it now sits.

    Aside from the ugliness of the channel breakdown (Brexit) that magically healed itself a few sessions later (price manipulation) it makes for a pretty nifty Bat Pattern.

    Is this the end of the road, or is RUT destined for new highs?

    continued for members... (more…)

  • More Bad News: Ain’t it Great?

    Futures shot up 10 points after this morning’s disappointing jobs report, meaning the bounce off our 2157.47 target, yesterday, is for real.  So, is the “market” out of the woods?  Not necessarily.  CL plunged through channel support yesterday, and has further to go if the longer term channels mean anything.

    The upshot is that while SPX will most certainly pop on algo response to the jobs report, it’ll just as surely drop if CL can’t break out.

    continued for members… (more…)

  • TPTB: Intentionally Whiffing?

    Oil reached our next downside target yesterday, then did something funny.  Instead of supporting the “market” as it’s done countless times before with a bounce at support, it kept going. 2016-09-01 CL 60 0616Likewise, DX and EURUSD ignored opportunities to tag their nearby SMA200s, which would easily have allowed SPX to close in the green.2016-09-01 DX 5 0625

    Whenever TPTB ignore opportunities to have the “market” rebound, it can mean only one thing.  They don’t want it to.  At least, not yet.

    We remain short from 2171.22 just before the close yesterday.

    continued for members…

    USDJPY is the only market mover doing its job this morning, but it’s almost to our upside target.2016-09-01 USDJPY 60 0600

    Which was enough to get NKD through its SMA200.  It was as much a function of the falling SMA200 as it was the rising BoJ supported index.2016-09-01 NKD 15 0636

    Everything else is intentionally whiffing the ball.2016-09-01 DX daily 0615

    2016-09-01 EURUSD 60 0600

    Futures are flat, with that 2152 still looking rather juicy.2016-09-01 ES 60 0600Which still lines up with SPX 2157.  If it gets there, or even breaks 2161, then we’ll reevaluate the prospect of 2138.

    2016-09-01 SPX 60 0600

    As yesterday, keep an eye on VIX and the purple TL from last Friday.2016-09-01 VIX 5 0640

    For those who watch gold, note that it reached the yellow TL from December overnight.  It could leak a little lower to tag the SMA100 at 1298.40, but this is its moment of truth.2016-09-01 GC daily 0644

    UPDATE  10:35 AM

    SPX just reached the bottom of the falling red channel, so will likely get a bounce here.  It should fall a little further to tag the .786 Fib, which would allow ES to tag its yellow TL and .786 at 2152.20.2016-09-01 SPX 60 0733

    Note, however, that ES has almost reached its 1.618 from the 2007-2009 drop, at least on an unadjusted basis.  So, ES traders might think this is quite enough.  However, SPX’s 1.618 is clear at 2138, the equivalent of 2136 in ES.2016-09-01 ES 60 0758

    Note that the yellow TL we’ve been tracking (I’ve sometimes erroneously referred to it as a channel midline) was drawn to emphasize the bottom of the rising purple channel. 2016-09-01 ES daily 0747ES dropped through the bottom of it for the first time in January, which began the frenetic doubling of CL in order to get stocks back on track.   2016-09-01 ES daily CU 0754But, CL is still slumping towards 43.07, and VIX looks like it wants to tag 14.68, so I’m inclined to think we have more coming.2016-09-01 VIX 5 0743

    UPDATE:  11:05 AM

    SPX just tagged its .786 at 2157.47.  I’d say we’re due for a reversal, though ES didn’t quite reach its, nor the red TL connecting the two previous lows.  And, VIX looks unfinished.  I might regret it, but I’m not quite ready to pull the plug.  We’ll see what happens when the SMA5 10 catches down in a few minutes.2016-09-01 ES 60 0805 2016-09-01 SPX 60 0803

    UPDATE:  11:19 AM

    Looks like an extended bounce is coming, as VIX just dropped through the red TL.  Back to cash here, though I’ll be ready to go short again on any sign of a reversal — probably when the SMA5 20 catches down.2016-09-01 SPX 5 0819

    Swing traders, I believe you’re safe staying short for another 5 points, but it’s too close to call.  Sometimes ES needs to tag its targets, and sometimes it’s enough that SPX did.2016-09-01 VIX 5 0824

    UPDATE:  11:37 AM

    Probably close enough, especially with the euro close.  I’d revert to short here with tight stops.  We’ll make the target ES 2152.20, which is about SPX 2154.  Since SPX’s .886 is just below at 2152.85, I’ll use that as my SPX target.2016-09-01 SPX 5 0837

    UPDATE:  12:02 PM

    SPX seems to be looking for support here at the SMA20.  It’s not unusual for it to climb on top for a little bump, only to finish a move later in the day or the next.  And, this drop does look like it got a little ahead of itself.

    Technically, the H&S has completed.  And, I doubt they want traders to start shorting it like crazy with the expectation that it won’t be propped up as usual.

    I don’t see any effort on the part of CL, USDJPY or VIX to reverse it here.  But, you never know.  Watch your stops.  We’re coming up on 12:09, which often marks the end of a bump higher.

    2016-09-01 SPX 5 0901

    UPDATE:  12:15 PM

    VIX is dropping a little lower, so I’m assuming this is going to be drawn out for a while.  Back to cash, here.  The SMA5 50/100 are up ahead at 2165ish, and the rising red channel bottom is around 2164ish.  We might see either of those as another reversal point.  But, I think the issue is more timing than anything else.  They don’t want the channel to break down too badly.  CL hasn’t budged yet, so I’m leery of going long.2016-09-01 SPX 5 0915

    2016-09-01 VIX 5 1217

    UPDATE:  12:50 PM

    Well, that escalated quickly.  Looks like one more spurt up to the SMA5 200 or white TL before we get another chance at lower.  2016-09-01 SPX 5 0950Note that VIX didn’t quite reach the purple TL, which will intersect with the yellow TL and the SMA5 200 at 13.58ish.2016-09-01 VIX 5 0951

    UPDATE:  2:07 PM

    Well, that was tricky.  SPX reversed without having tagged the SMA5 200 or TL.  CL started dropping and VIX started popping (without having tagged its SMA5 200), and that’s all it needed.  I’ll try a short position here, but there’s a 50:50 chance that this is a head fake — as those catalysts are most often involved in an upside reversal.2016-09-01 SPX 5 1107Note that CL has almost reached 43.07, our next downside target from last week.  We’ll look for a bounce there up to the cluster of SMAs and white channel line, say 46.24.

    2016-09-01 CL 5 1108 2016-09-01 VIX 5 1107

    UPDATE:  2:13 PM

    Yep, looking very much like a head fake that got away from them a bit.  Back to cash here on any sustained push through the SMA5 100 at 2165.77.  A rally to the white TL by the close (ideally 2:50) looks fairly likely at this point.  My hesitation is that CL continues to settle lower.  It just tagged the .618 at 43.07, but is showing no signs of rebounding yet.

    2016-09-01 NKD 15 1113 2016-09-01 USDJPY 5 1113 2016-09-01 SPX 5 1113

    CL is approaching the rising white channel bottom.  Will it run all the way down there or respect the .618?  TPTB love to gap down on the opening for these things almost as much as they do a close at a bearish low.  Either way, I’d be prepared to short at 2167-2170.2016-09-01 CL daily 1131

    UPDATE:  2:49 PM

    There’s the SMA5 200.  Might be a little early, as VIX still hasn’t reached its SMA5 200, but I’d short here for another leg down.  The risk here is that CL runs down and tags 42 after the close and then spikes up to 46-47.  This would leave folks short overnight facing a big gap higher in the morning.  Dirty pool, but hardly unusual these days.

    But, we’ll cross that bridge when we come to it.  At this time, there’s still a chance that CL will spike lower before the close, leaving a big dragonfly candle on the day and giving us a chance to cash in on SPX’s drop to 2150-2152. 2016-09-01 SPX 5 1148 2016-09-01 ES 5 1150 2016-09-01 VIX 5 1150