We’ll start with a peek at the Big Picture posts for each month so far this year, and wrap up with a look at what to expect going forward.
The Big Picture, January 5, 2016
On Jan 5, I was focused on the fact that USDJPY had dipped below the critical Fib line at 120.11.
Did you feel it? Something big happened yesterday, and it had nothing to do with China, Saudi Arabia, Iran or Donald Trump. Of course, I’m talking about USDJPY, which closed below the key Fib line at 120.11. Is it important? Well, the last time it dipped below this level, stocks were in the midst of a 12.5% plunge.
 With SPX at 2020, I identified two important levels of support: 1984 and 1962.
With USDJPY below 120.11, and CL potentially plumbing new depths, 1962 should be doable. After that, we’ll have to see what tricks TPTB can come up with to maintain the purple channel. If they don’t, then we’re obviously in for much more downside than we’ve seen in a long, long time.
The following day, SPX dropped below 1984. The day after that, SPX plunged through 1962 and didn’t stop until it reached 1812 — a 12.9% (versus 12.5%) drop from the end of the year highs.
By Feb 8, I was on crash watch. USDJPY had dropped below the bottom of a huge, 15-month old huge channel, with devastating results for stocks.
Now, as USDJPY drops through the channel bottom again, the “market’s” fate rests on whether or not the central planners will elevate the USDJPY yet again.
SPX, already down nearly 15% from its peak, had completed a huge Head & Shoulders Pattern that threatened to send the index tumbling another 17%.
 When the FOMC increased rates two days later, it completed an even more bearish H&S Pattern. On Feb 11[see: USDJPY Finally Relents], I wrote:
USDJPY, along with CL and SPX, should bounce here. If you’re a bull, they must bounce here. The only question: is it too late? [Keep] an eye on CL, USDJPY and NKD for signs of a turn. You’ll know, because all three will be screaming higher.
CL, USDJPY and SPX all reversed sharply that day. CL screamed 50% higher (currently about 100% higher) in about five weeks, producing a 12% rally in SPX and a 17% rally in NKD. It was a massive, highly successful intervention that cemented CL’s role as the primary driver of stock prices. I set a target at 2000 for SPX by Mar 12.
SPX had already reached 2000 by Mar 4, over a week ahead of schedule. The FOMC and BoJ were both due to announce next steps the week of Mar 14.
And, now we face the question of whether SPX will reverse strongly or merely take a breather here. With Kuroda announcing any BoJ policy changes tomorrow and Yellen doing the same on Wednesday, “markets” remain in the hands of the central planners. Wouldn’t it be nice if they’d just publish future stock prices while they’re at it?
Given their success in rallying SPX off its Feb 11 lows, it seemed they were more likely to break out than down. I placed targets of 2050-2065 around Apr 1 and 2087 (later increased to 2098) by Apr 22.
 The central banks obliged. SPX reached 2065 by Mar 30 and 2087 by Apr 18. SPX topped out two days later at 2111, 13 points beyond our upside target.
This was another post centered around the coming FOMC and BoJ actions. SPX had managed a rather extreme rising channel that was built entirely on CL and USDJPY intraday rallies.  But, I had little faith in the BoJ’s ability to keep the USDJPY rising.
That’s probably about it for this leg. If you’re a contrarian and can hedge overnight and don’t believe BoJ has any ammunition left, this would be a great place to short. I still believe the yellow .786 at 2065 is in play…
If there’s a silver lining for bears, it’s that tilting the rising red channel over a bit theoretically presents an opportunity for a backtest of the SMA200 down at 2014 (the red dot above.) Though, it sounds ludicrous to talk of a 73-pt drop in the next day or two.
The following day, the BoJ Screwed the Pooch, and SPX began a 3-week decline to 2025, not quite to the SMA200.
On May 5, I focused on a potential bottom for SPX, identifying a backtest of the broken white channel at 2039 as the most likely scenario.
It could happen any time between now and then, and it could even wait until Friday or Monday. But, the point is to backtest and, thereby, firmly establish support in order to legitimize another push higher.
 SPX bottomed at 2039 the following day, then bounced 81 points to 2120 in the lead up to the Brexit vote.
This post was all about the FOMC’s rate decision the following day.
Tomorrow, I expect the Fed to punt. I expect the dollar to try and sell off, but be propped up by central banks when the yen carry trade unwinds a little more. And, I expect oil to rise to compensate. If SPX sells off, and if you’re very careful not to get whipsawed, I’d look for opportunities to short SPX, possibly down to 2017 or even 2000.
The Fed did punt. The dollar did sell off. Oil did rally to compensate. But, SPX’s sell-off was limited to 35 points in the lead up to the Brexit vote on the 23rd. It was then that we got a 122-pt plunge in line with our updated forecast two days before the vote:
Our big red target…would put SPX at 2010-2020. An overshoot to test 2000 is also a good possibility.
It overshot our “overshoot target” just a bit, finally reversing at 1982. The vicious, CL and USDJPY-driven rebound erased the losses in only four sessions, with the 4th (incredibly) being the same day the UK lost its AAA rating.

SPX rebounded absurdly quickly following the Brexit sell-off. As it neared the .886 retracement of its drop, I thought we’d get a decline that would help SPX establish an Inverted H&S Pattern. But, I had my doubts whether it would play out.
…either the white .500 at 2050 or the white .618 at 2036 would make a nice right shoulder for an IH&S Pattern targeting 2235. And, depending on when it occurs, either would leave the yellow channel top unbroken. That’s the bullish scenario.
SPX fell only to 2074 before an astounding 10-day 7.3% rally in USDJPY turned it around. It wasn’t much of an IH&S Pattern, but SPX went on to make new highs anyway — reaching 2193 so far this past week.
In this latest post, I focused in on the various tools which have been used to push stocks higher, and laid out a path for SPX for the next several months.
continued for members…
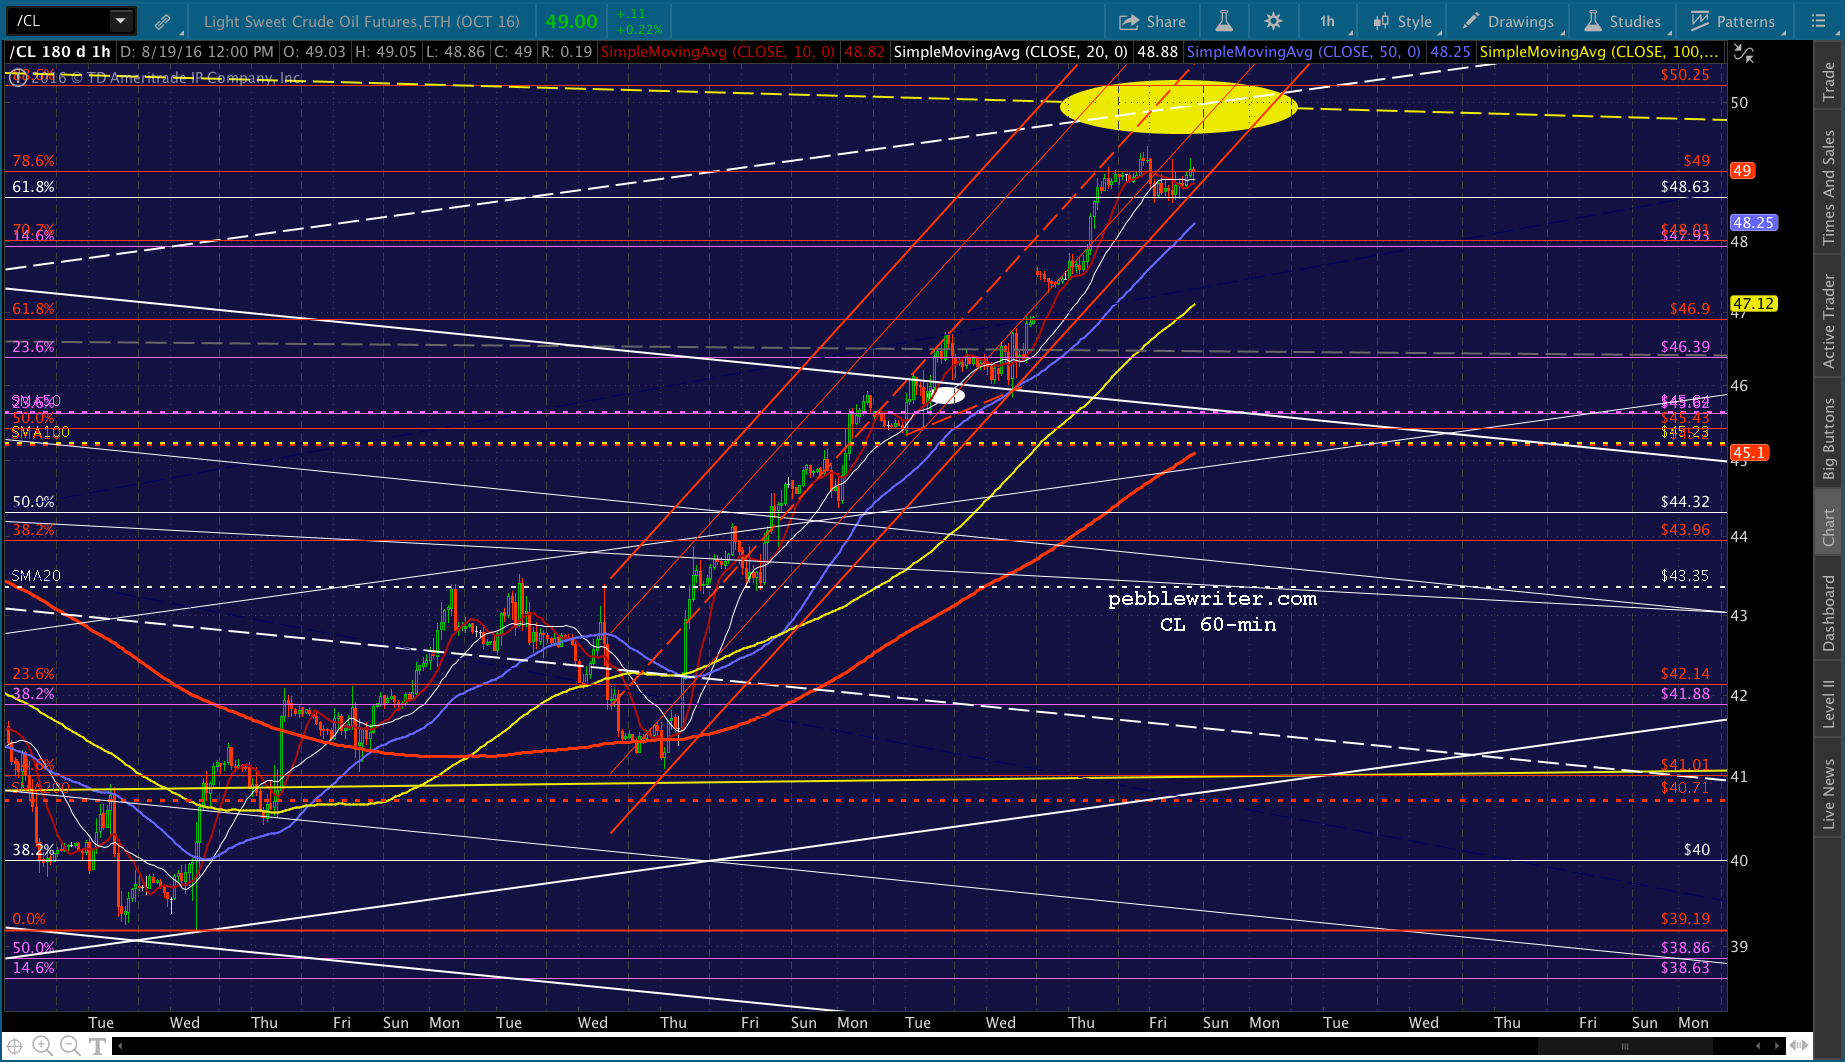
I saw CL as the key to additional upside, as it’s been driving the majority of SPX’s gains since February.
CL could continue backtesting the broken purple channel for another month … up to 46 or higher without breaking a sweat.
I chose 46 as a key price level because it represented the top of a falling (albeit rather messy) corrective channel seen below in white. 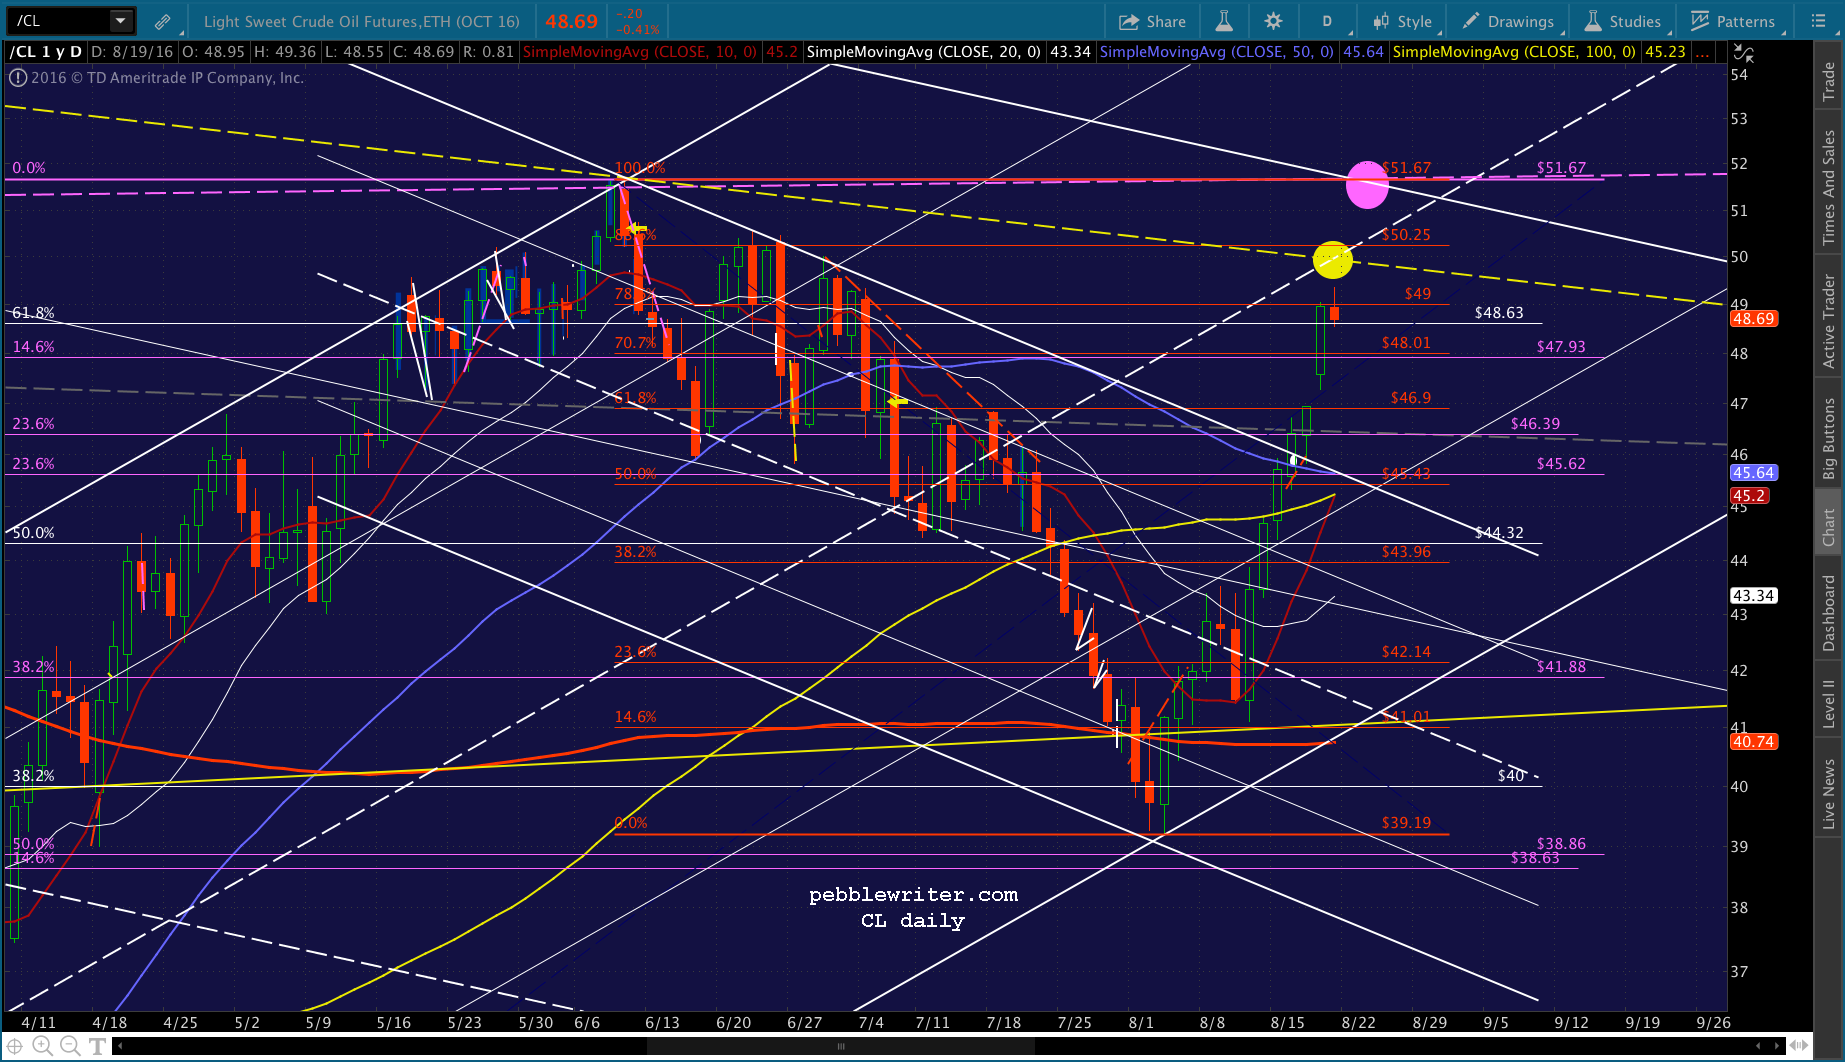 As recently noted, CL broke out of this channel, which gave SPX permission to break out of its latest falling channel yesterday. Is this the breakout we’ve been looking for in order for the analog to play out? That was the message delivered yesterday.
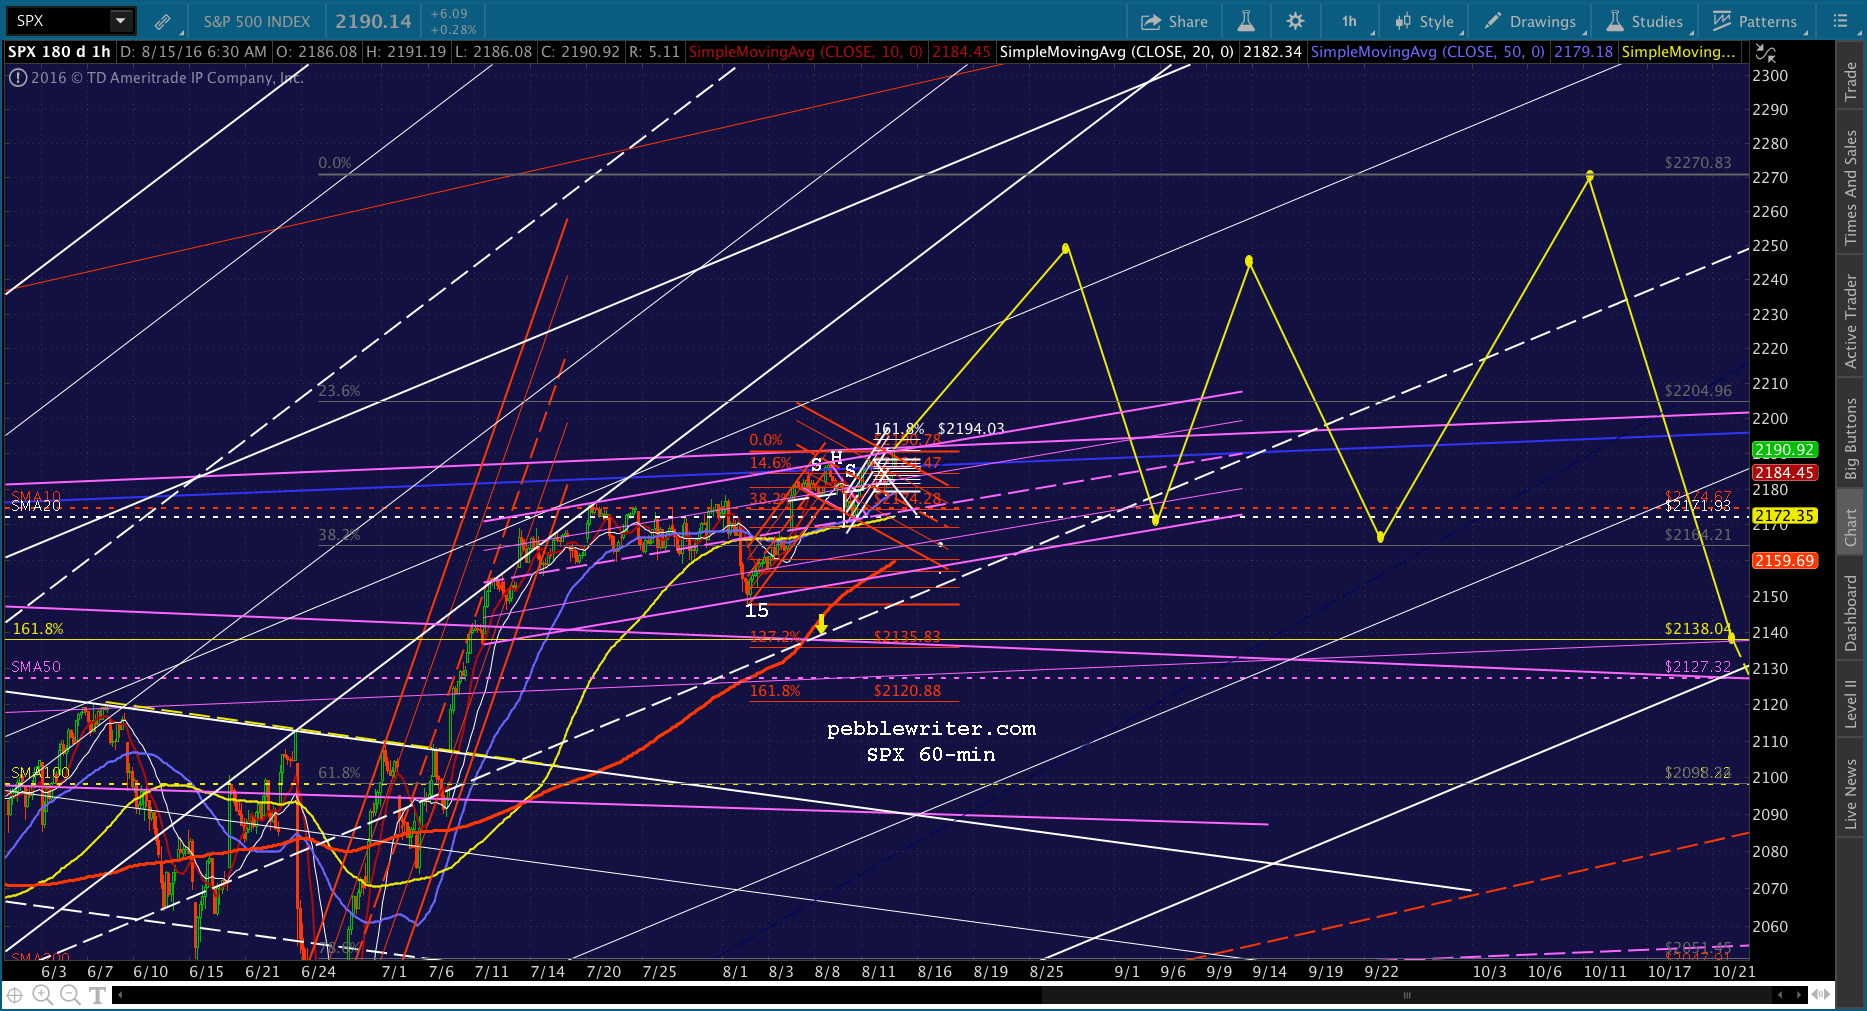 But, this morning, we see that the breakout failed. Our downside targets of 2165 and 2157 are suddenly looking likely again.
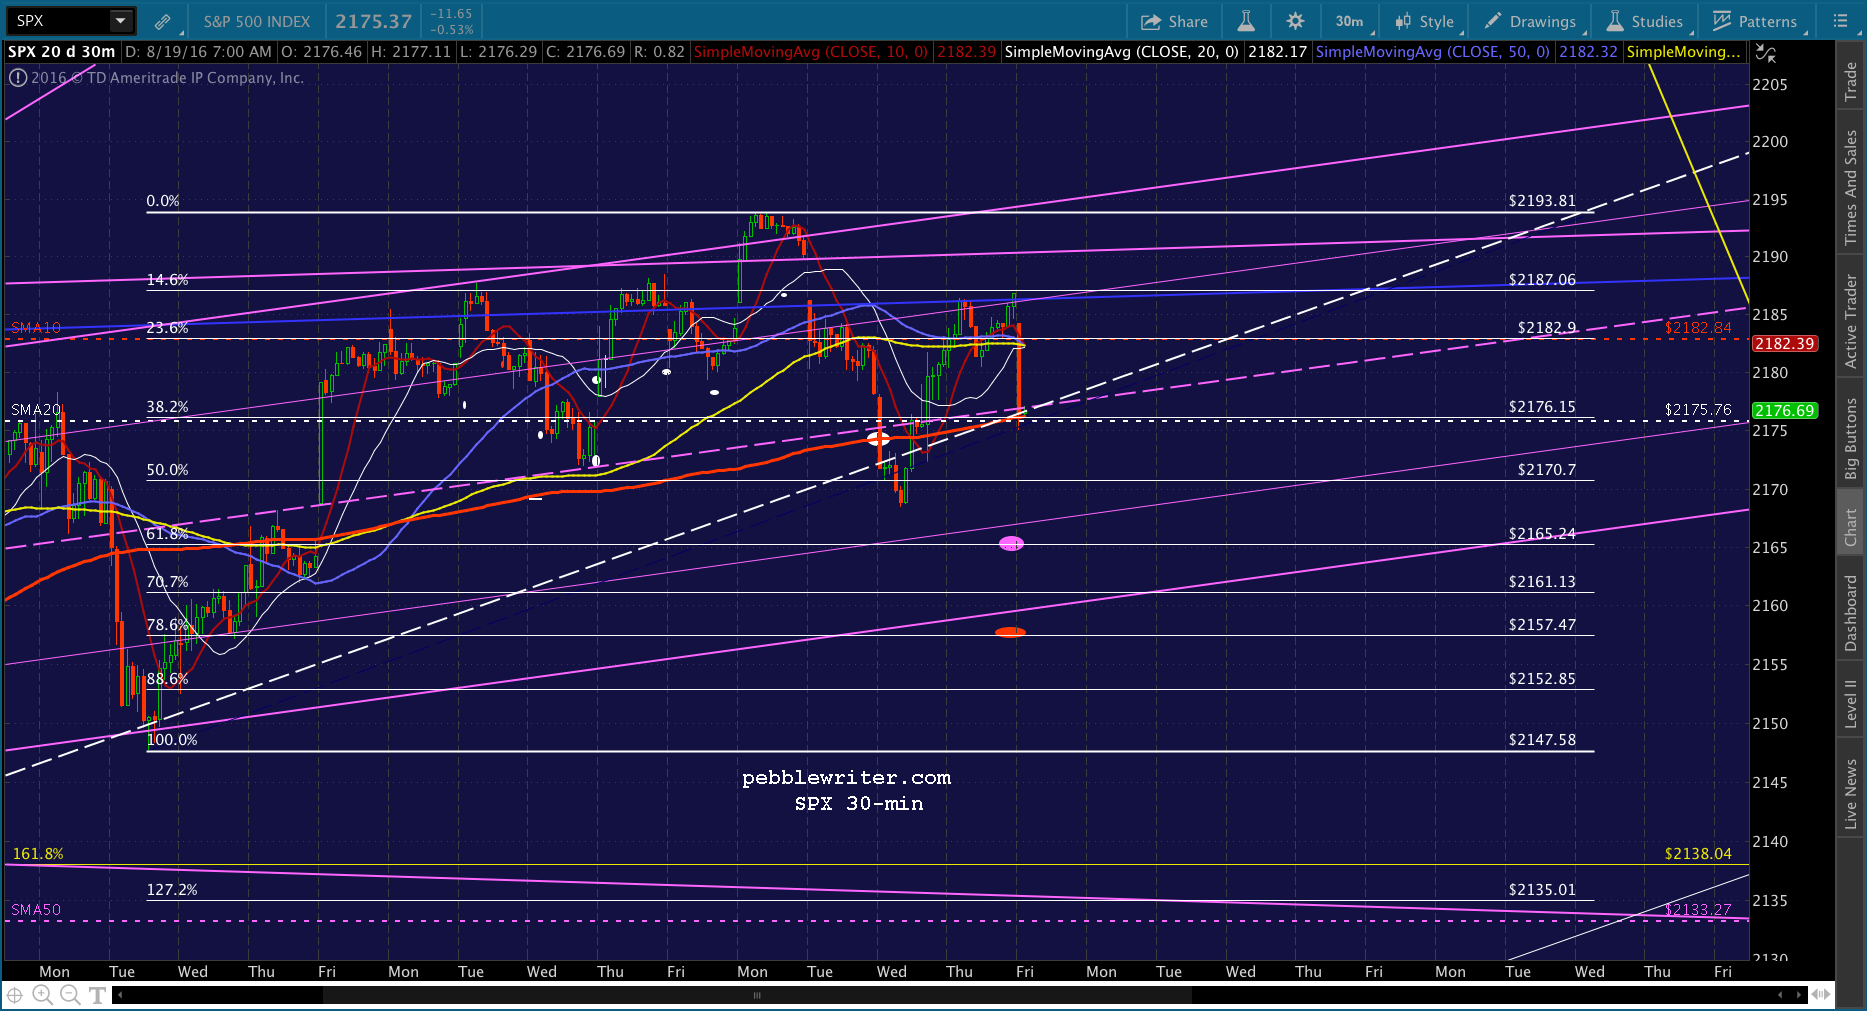
CURRENT BIG PICTURE: Aug 19, 2016
CL and USDJPY have been taking turns driving SPX higher ever since CL first bounced in Jan 2015. Each bounce, even though it eventually failed, provided significant upside. This latest bounce from 26.05 on Feb 11 has been by far the biggest.
Note that the yellow target at about 50 represents a neckline (below, in yellow) in a very large and significant IH&S Pattern targeting 78.71 — a very bullish potential development. But, the emphasis is on “potential.” Lately, it’s taking larger and larger moves in CL to effect even a minor rally in SPX.
And, there are obviously major problems with running CL back to its former highs — namely, inflation. It’ll be difficult for the Fed and other central banks to cry “deflation!” when folks are paying 3.50-4.00 per gallon at the pump. It’ll pretty much crush the (false) argument they’ve been using to retain and expand QE.
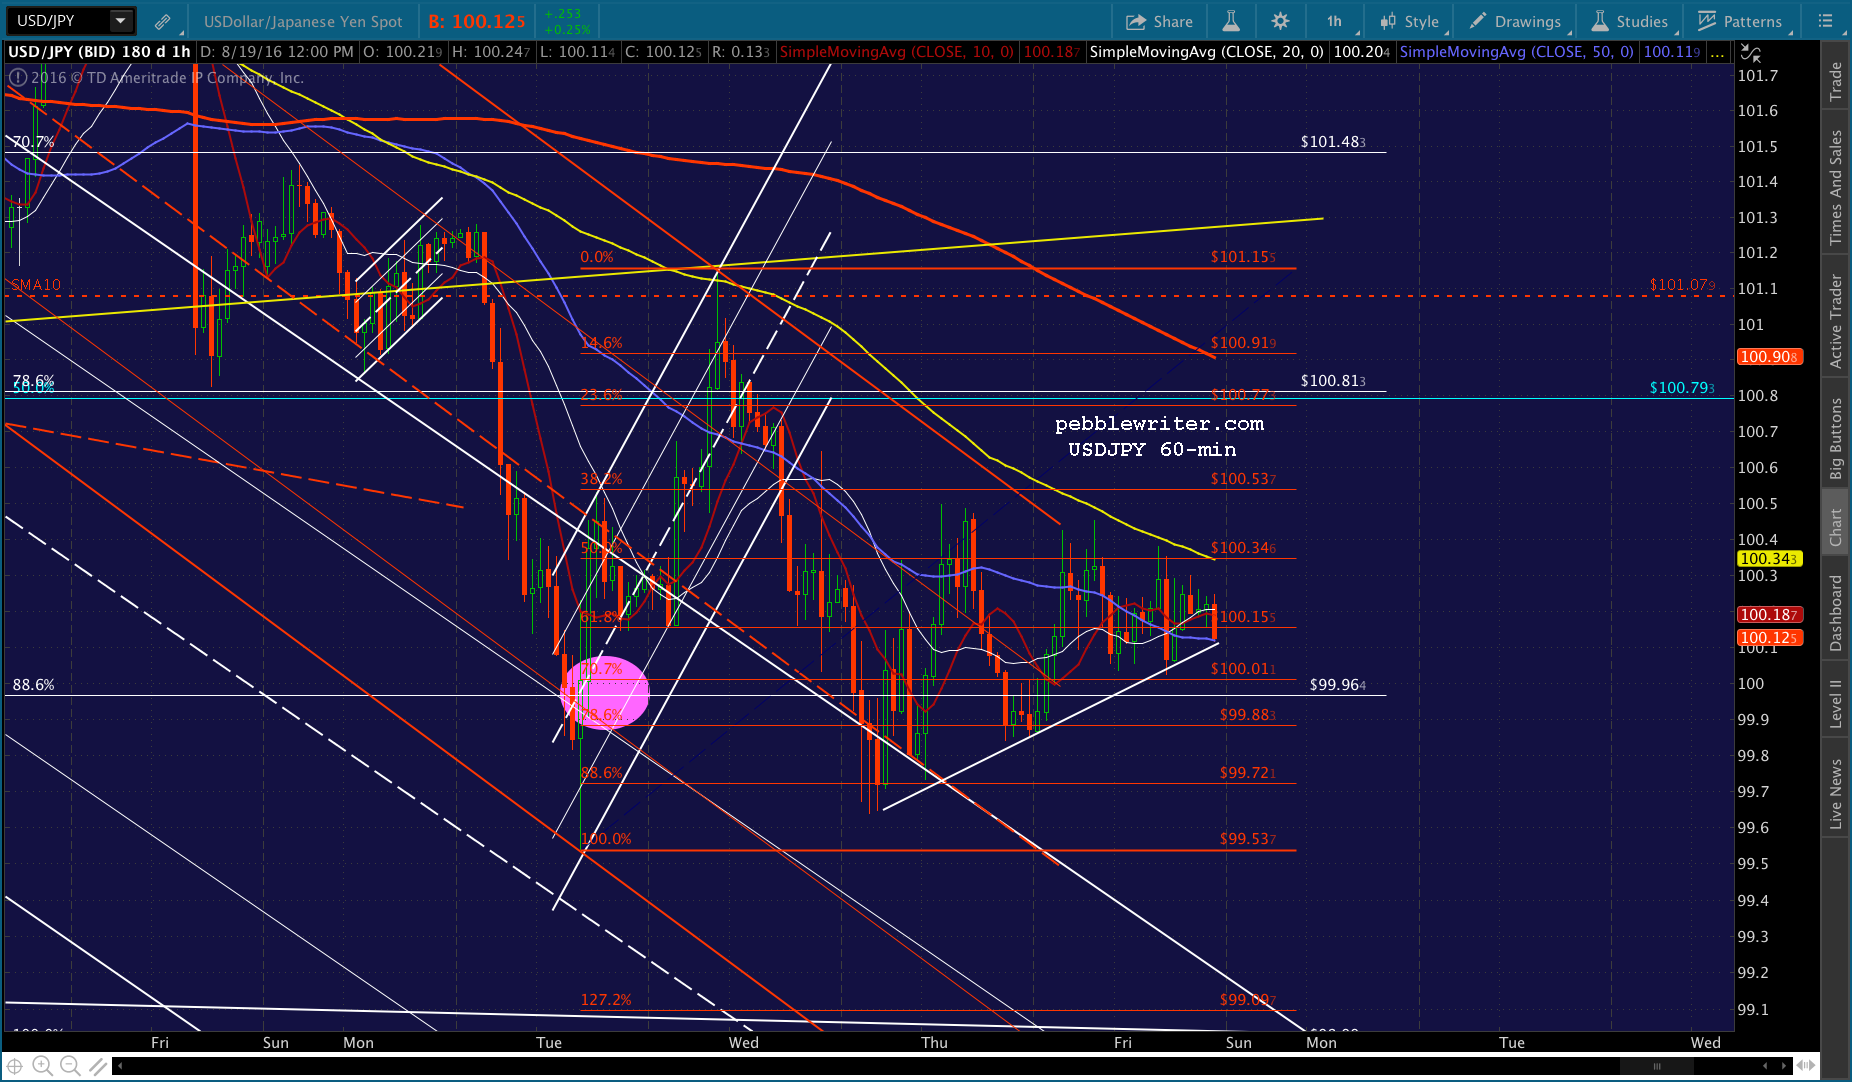
So, we have to accept that CL has probably run its course. Higher prices would amp up the pressure on the Fed to raise rates, which would obviously hurt the “market” in other ways, as seen last December.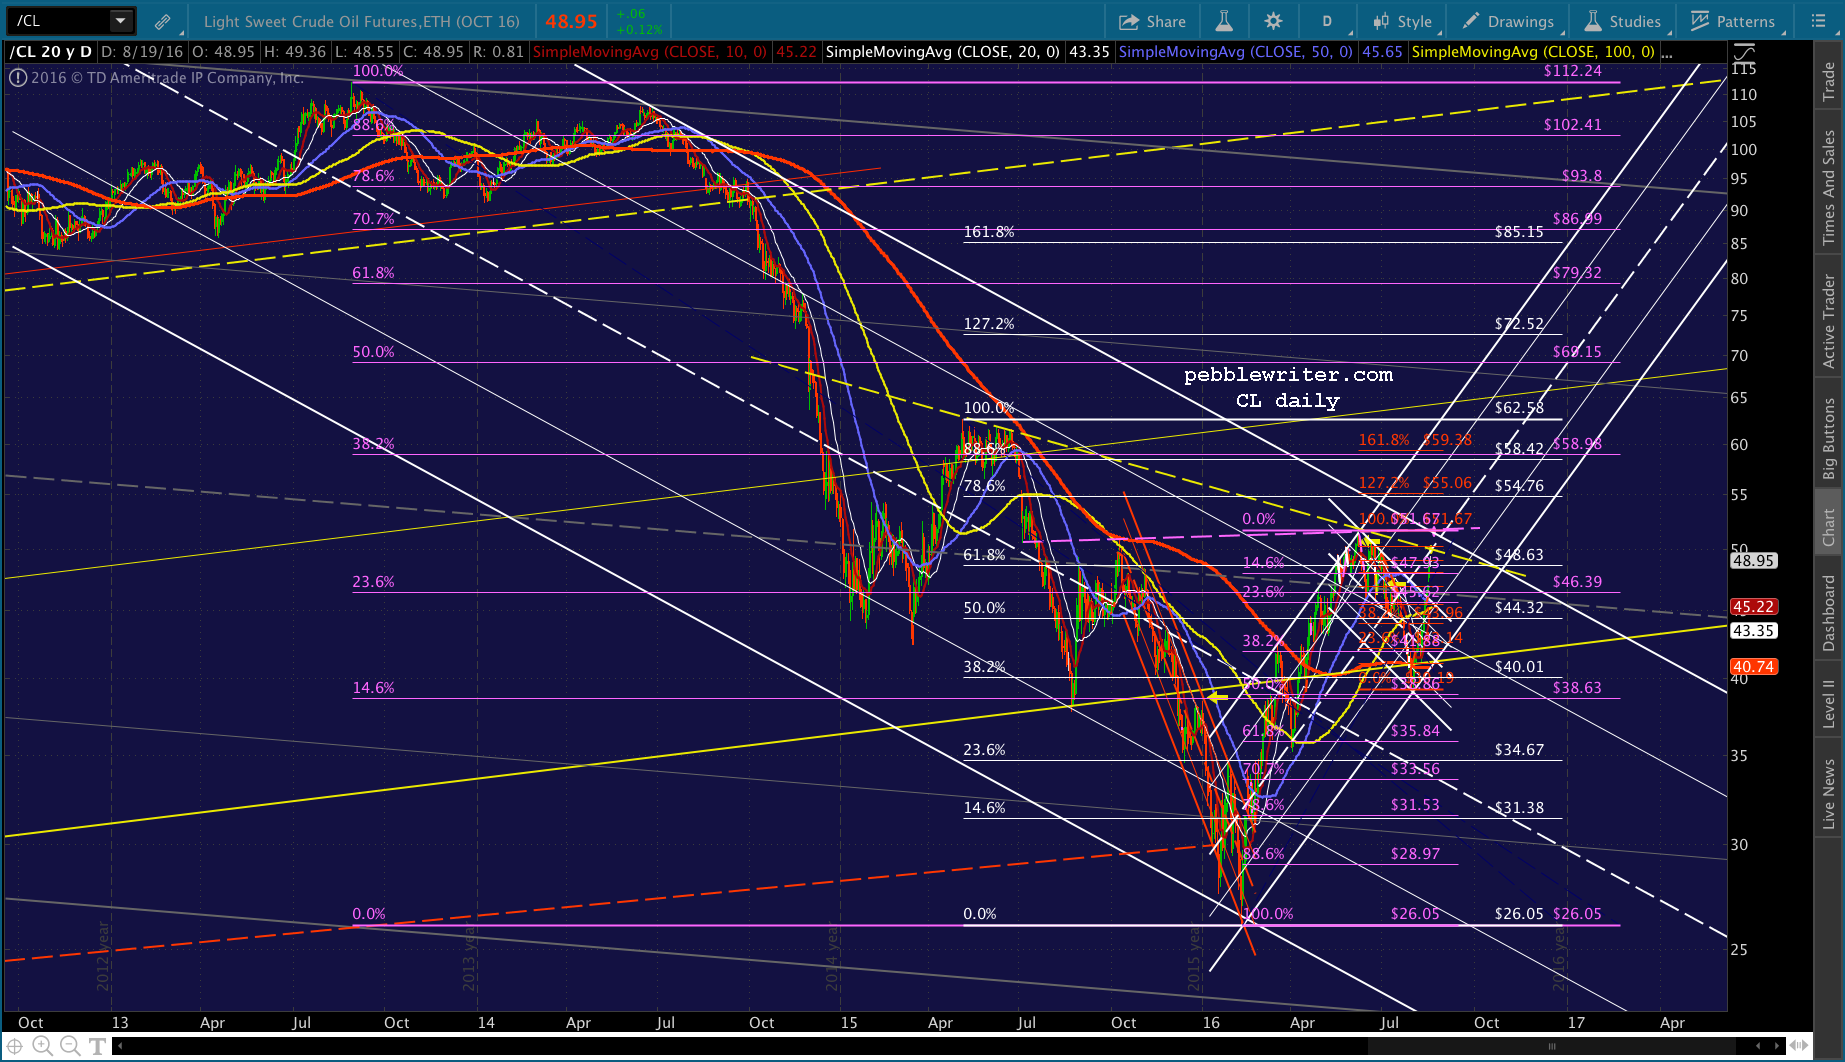 Let’s look at the other driver of equity prices: USDJPY. It broke down from a large flag pattern on Tuesday, and is making an effort to backtest it.
 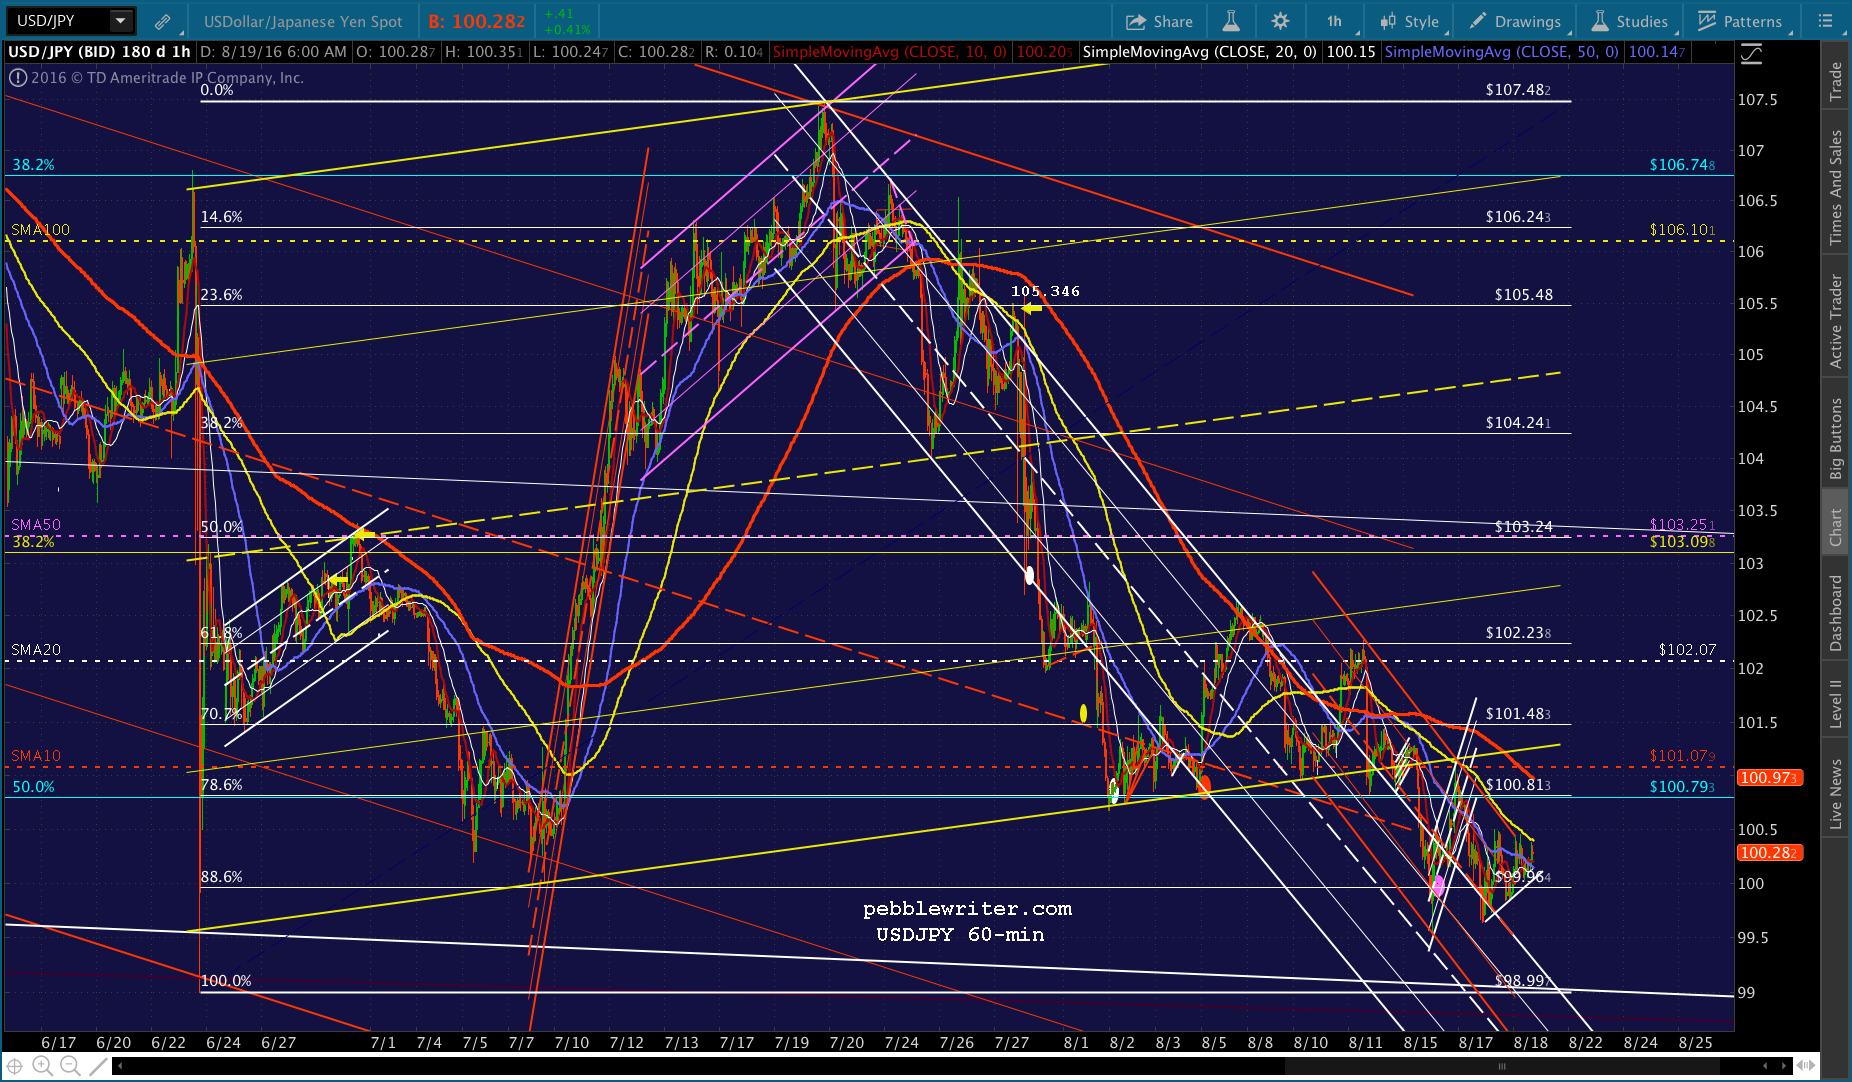 But, the overall picture remains dire. For all the well-timed bounces and pre-opening ramp jobs, it remains in the same falling channel it’s been in for almost a year. The breakdown of the yellow flag appears to be just one more defeat in a losing battle.
Investors looking at these big picture factors, let alone anachronisms such as earnings and economic influences, are increasingly bearish. It’s understandable. I feel it, too.
But, there’s no denying that, when used in tandem, USDJPY and CL are still capable of driving prices higher. While it might make no sense for CL to top 50.25 — the .886 of the drop from 51.67 to 39.19 — it will if that’s what’s needed. There are at least 2-3 weeks of intraday ramp jobs (that are reset overnight) that could be inserted between here and there.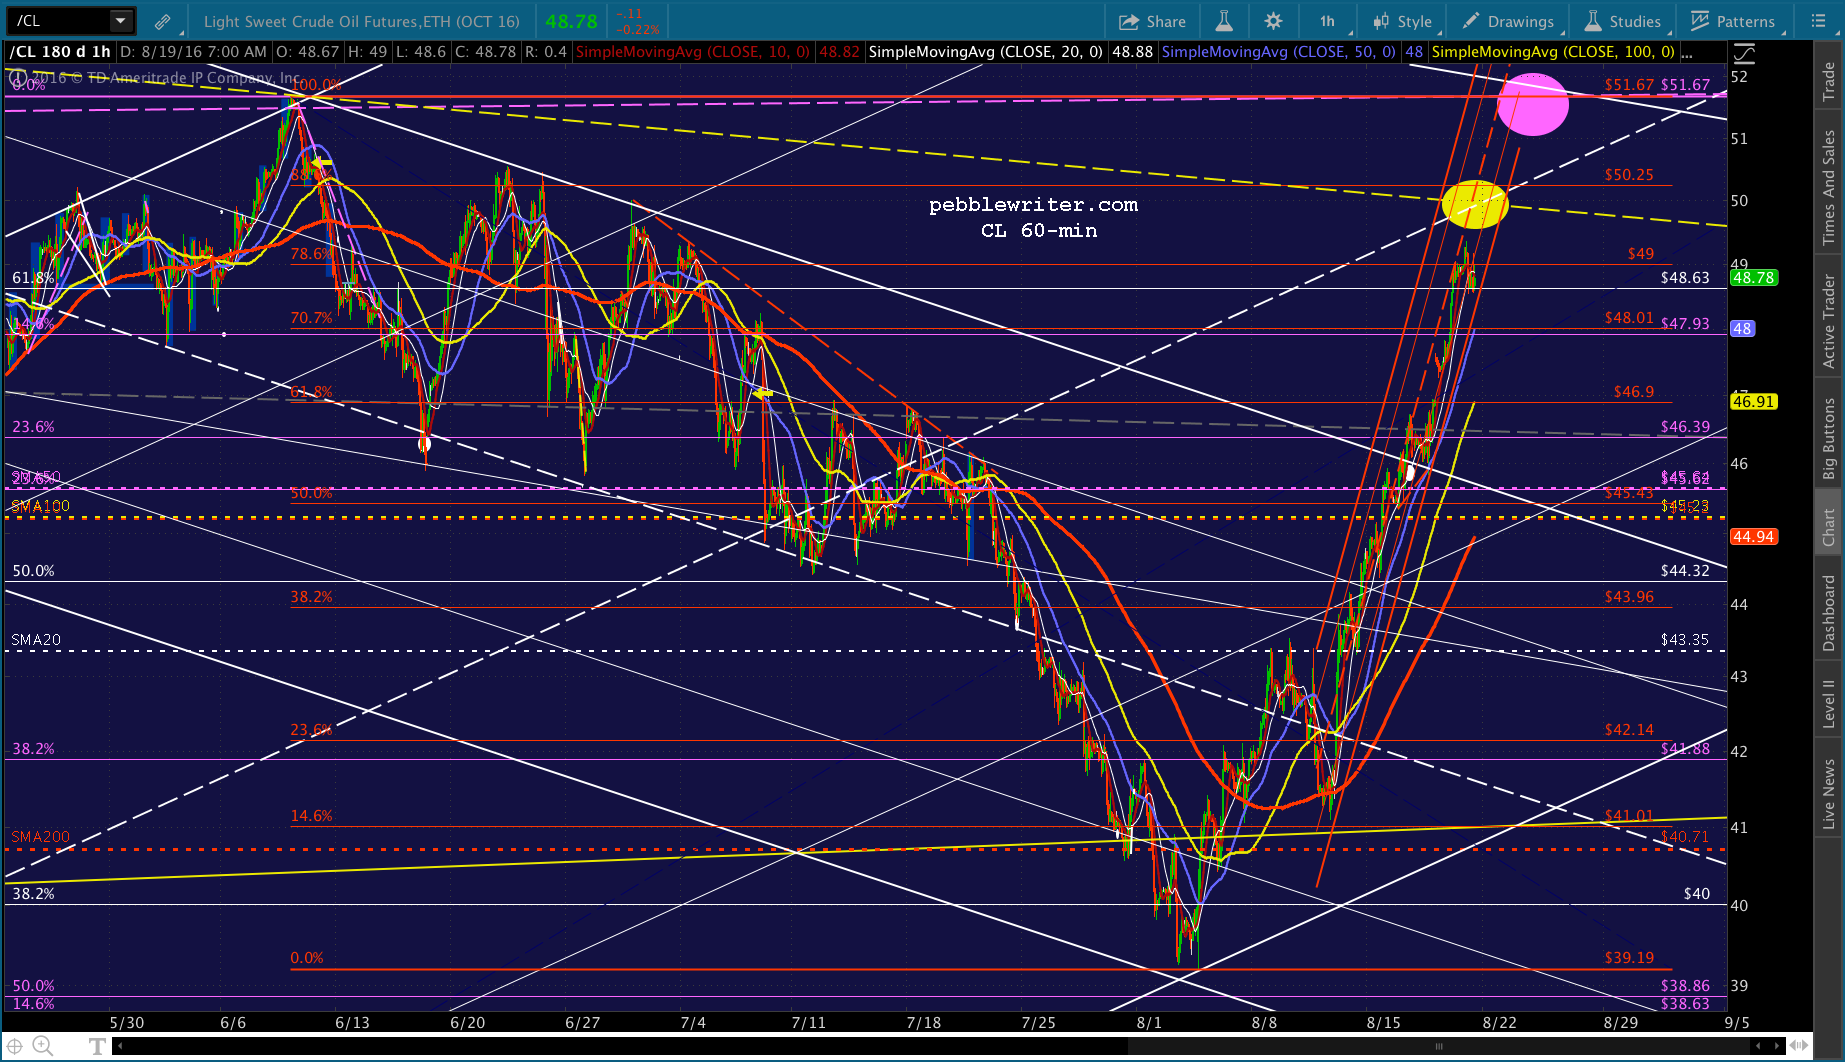 If necessary, it’ll pop up through the .886, completing the IH&S and threatening to take out the former high at 51.67.
USDJPY can feel free to continue falling. It will need to, as rising oil prices cost Japan dearly. The only way to mitigate this is to make sure the yen appreciates. CL can support SPX without USDJPY. And, when CL needs to reset, USDJPY can always make an eye-catching bounce for a few days while it does.
The Fed will eventually feel the pressure to raise rates, which will hurt stocks. But, by then, SPX will be well beyond 2138. So, a backtest to 2138 won’t be such a big deal — much like the backtests of 1823 in 2014 and 2015.
The questions, then, are how and when does SPX get to its new highs, and when will it drop back to 2138? The analog gives us one potential path. And, the new rising white channel I proposed last week is, so far, looking fairly legit.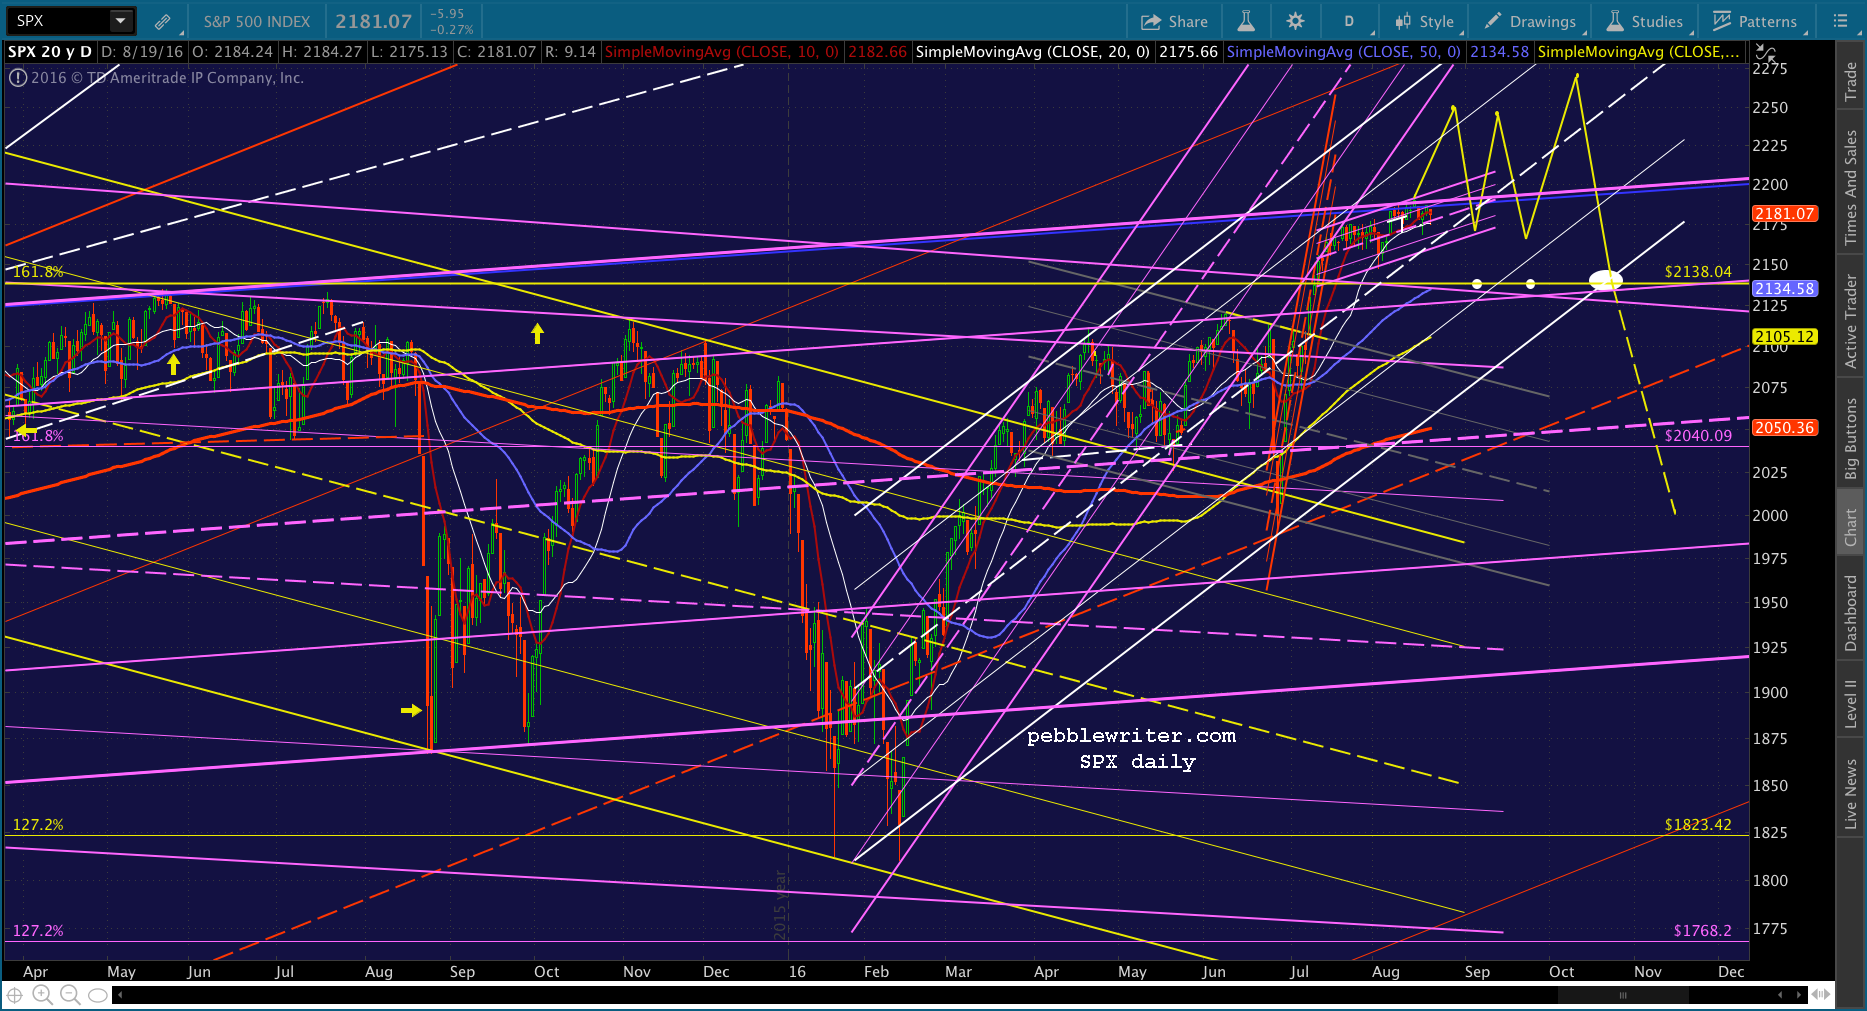
Remember, the rising purple channel from February broke down when Brexit happened, and the steep red channel took prices higher — through the 2134 2015 highs — before breaking down itself. Like the purple channel, though, the breakdown yielded higher highs.
The small, rising purple channel has been ratcheting SPX higher ever since Jul 12, and measures about 30-35 points from top to bottom. If the analog plays out exactly as in 2007, SPX would break out of this channel in the next few sessions, topping around Aug 29 — the session after the GDP 2nd estimate and the day before an API inventory report. Either could be a catalyst for a break out.
The other highs and lows also involve potentially important data releases:
- 9/6 low – the day before the Beige Book is released and another EIA inventory day
- 9/14 high – an EIA crude inventory report day and two days before OPEX
- 9/23 low – two days after a Fed meeting (with press conference, possible rate increase?) and an EIA inventory day, the day after an IPA inventory day
- Oct 11 high – API crude inventory day, day after Fed survey of consumer expectations, bond market closed for Columbus Day.
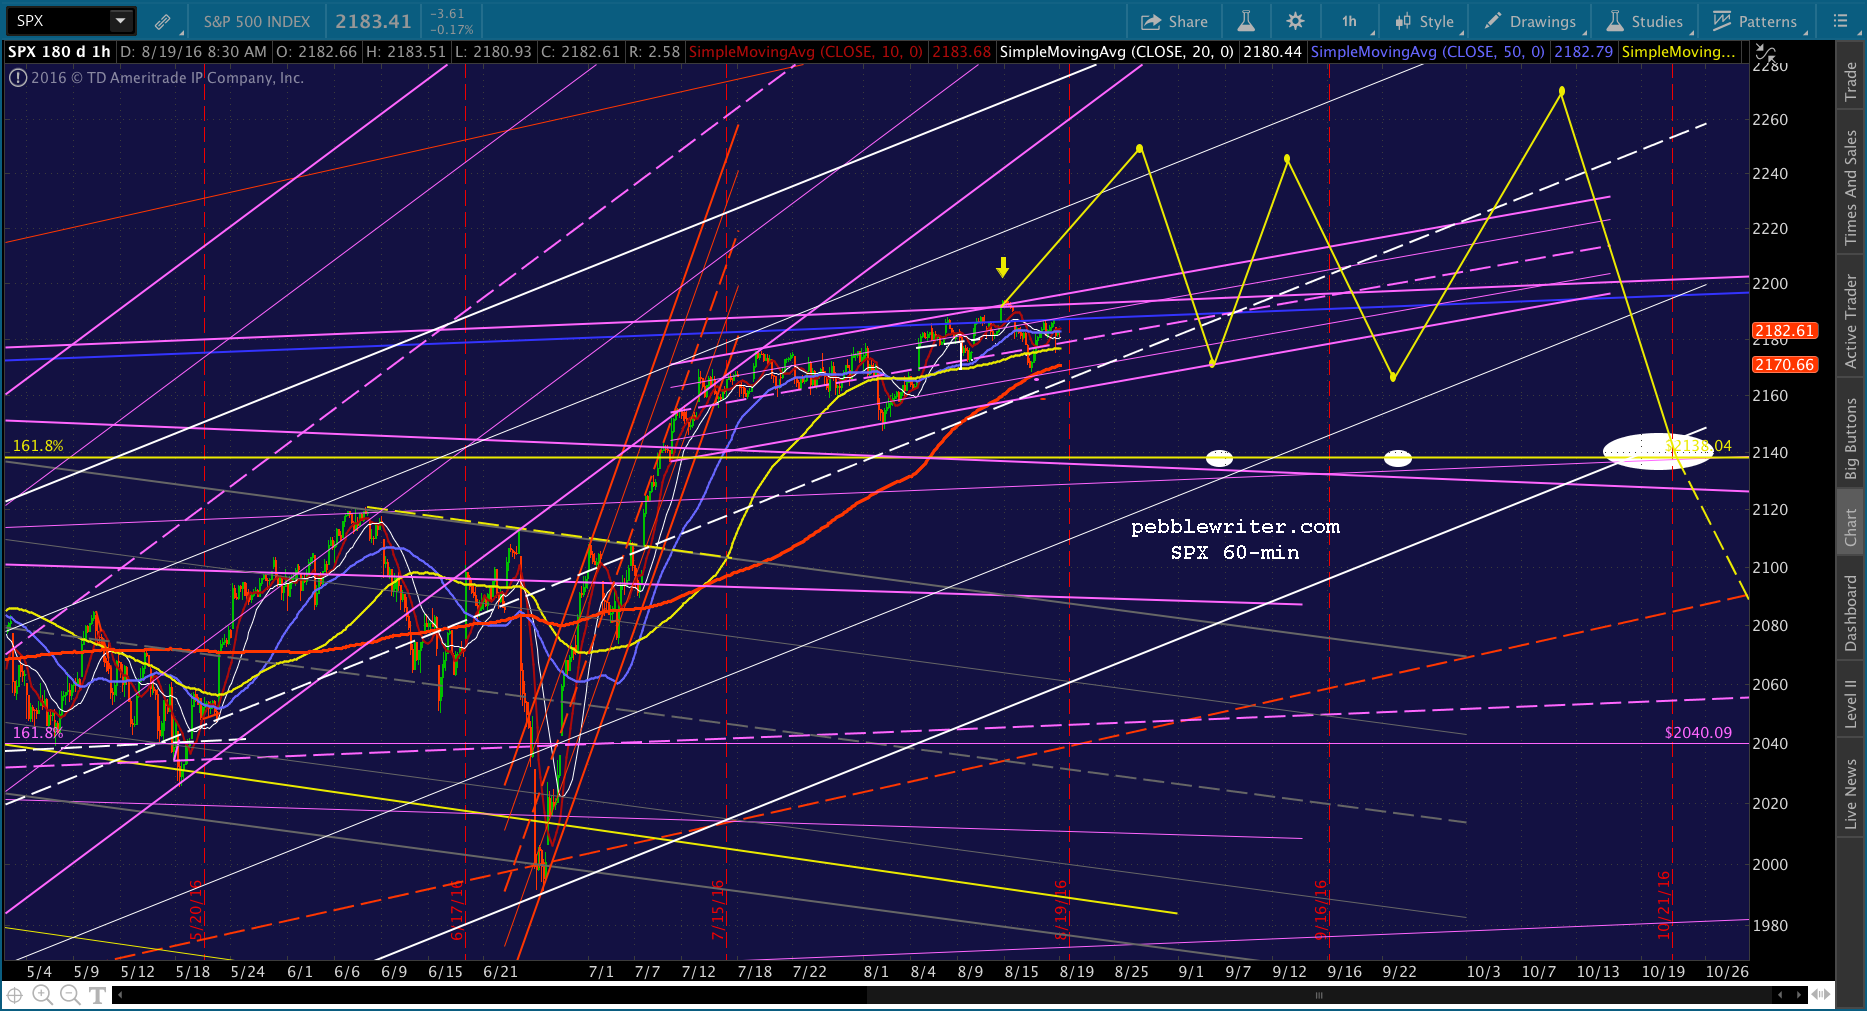 Note that the small rising purple channel ran into the top of the huge purple channel on Aug 15. The larger channel can be seen in the chart below.
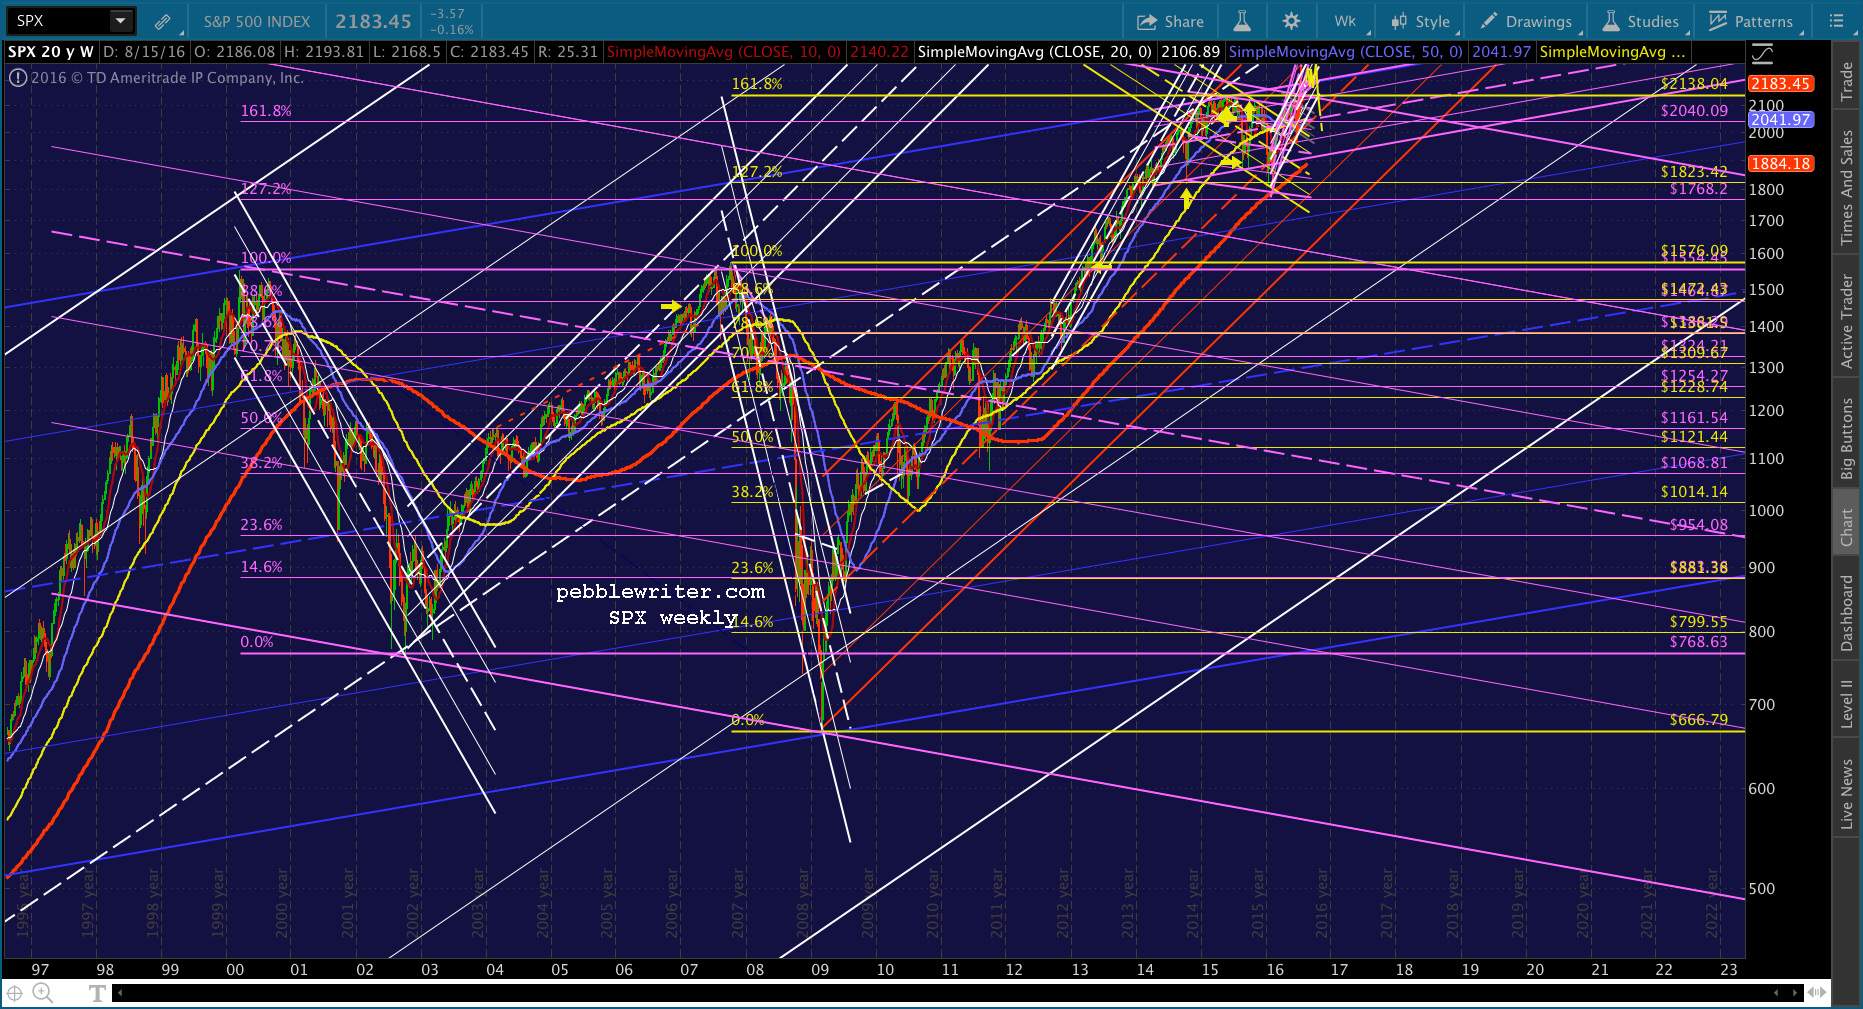
Breaking out of the larger channel might prove problematic, which raises an important question regarding the analog: would wild swings like the ones shown be excessive, especially given the upcoming Nov 8 election?
A drop from the top of the smaller purple channel at, say, 2211 to 2138 would be 3.3% — in line with the 3.55% drop the analog predicts. Likewise, a drop from 2200 to 2138 beginning on Aug 29 would amount to 2.8%, close enough to the analog’s 3.45% prediction.
A rebound to the IH&S target of 2250 in the weeks leading up to the election — in order to help prevent Trump from being elected and, presumably, gutting the Fed — would surprise no one.
I realize this is a lot of conjecture. But, it has a nice ring to it, and it sorta fits with the other chart patterns, including the white channel. Put it all together, and it would look something like the TLs shown below in purple.
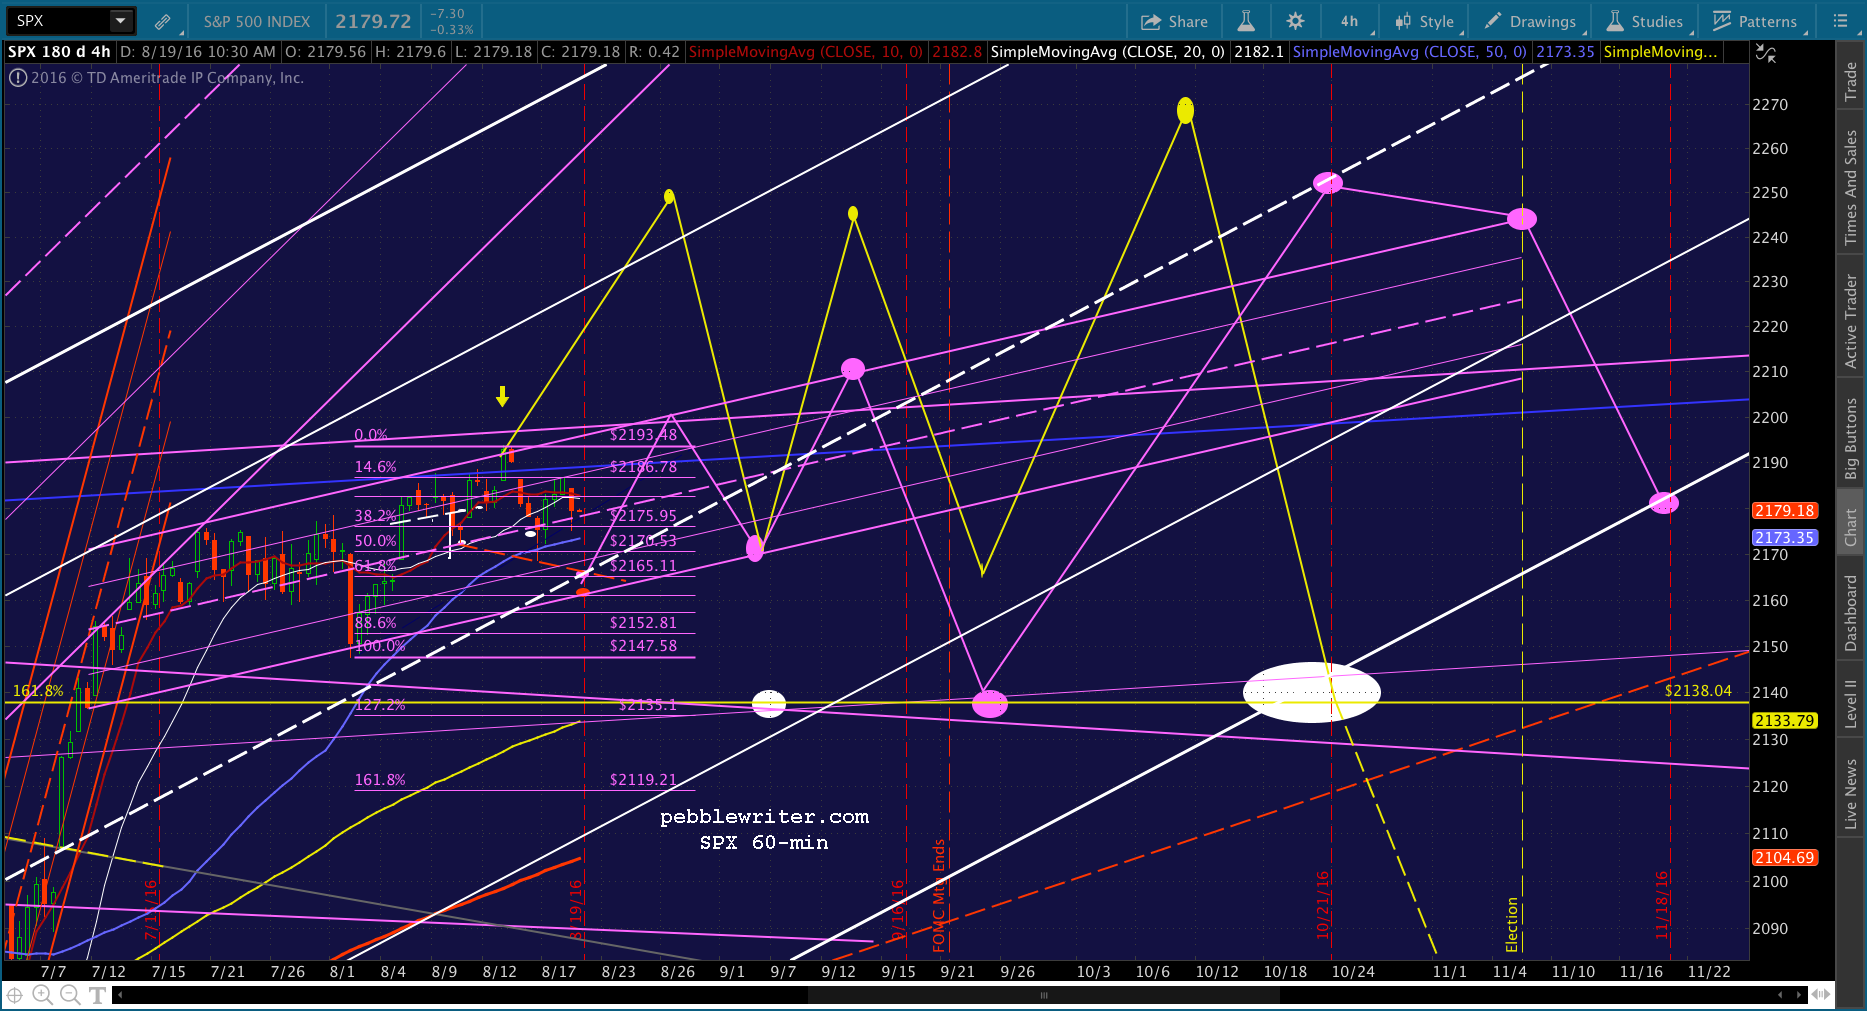
We’d get a drop to 2160-2165 by Monday to flesh out the purple channel, followed by a bump up to the channel top by next Friday. We’d get one more swing down to the channel bottom and back to its top on 9/6 and 9/13 — setting us up for a FOMC rate increase on Sep 21.
We’d get the 2138 backtest over with around Sep 23, then rebound to new highs by OPEX on Oct 21. From here, it would be a matter of holding on to those levels until after the election. After the election, SPX could finally decline to the rising white channel bottom which, coincidentally, would be about equal to current prices at 2170-2180.
The biggest flaw I see in this pattern is that ES suggests a drop to about SPX 2149 next Wednesday, Aug 24. This would trash the rising purple channel, but would fit better in many other ways. It would also be a small overshoot away from 2138, which would represent a 2.5% decline from the 2193 highs.
Either way, I think we’re likely to see a sell off between now and Monday. The point at which it reverses will tell us whether or not the rising purple channel is correct.
UPDATE: 3:53 PM
Going into the weekend, no clear direction. But, I’ll stick with my expectation of a drop to 2160-2165 early next week unless it breaks out (again.)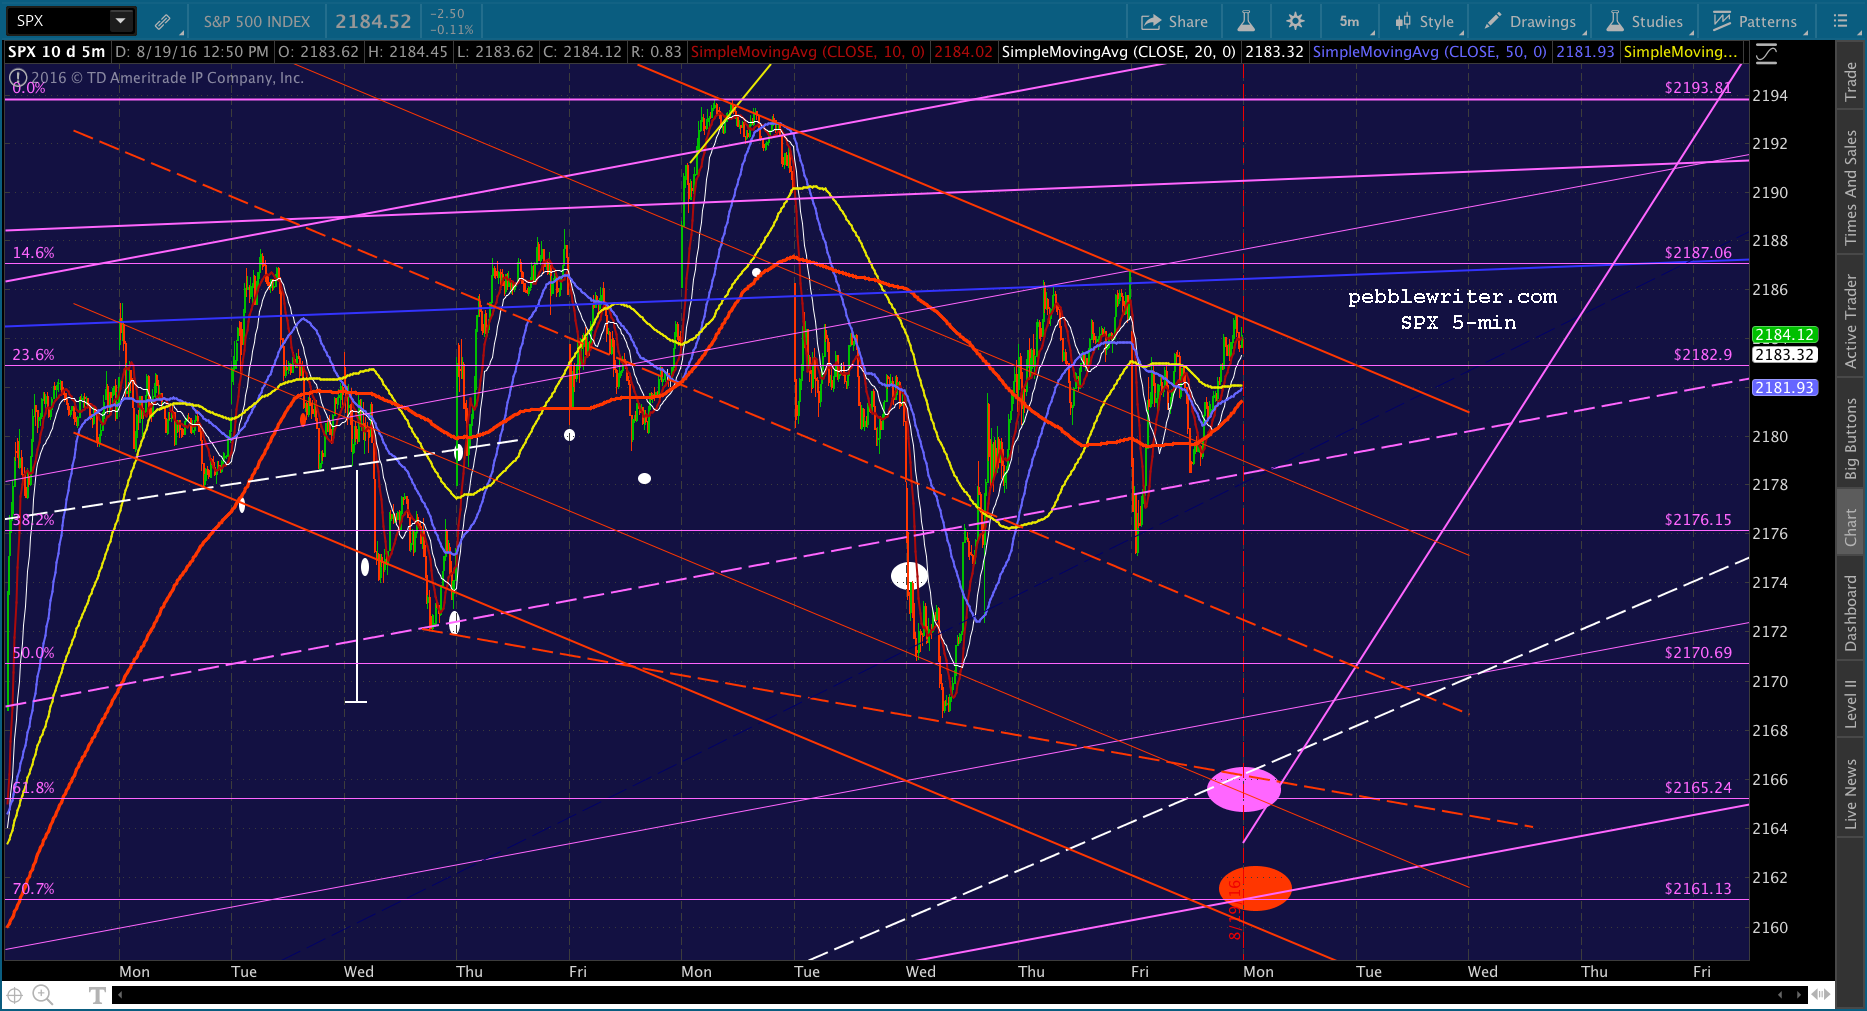
VIX’s manipulation is getting old. 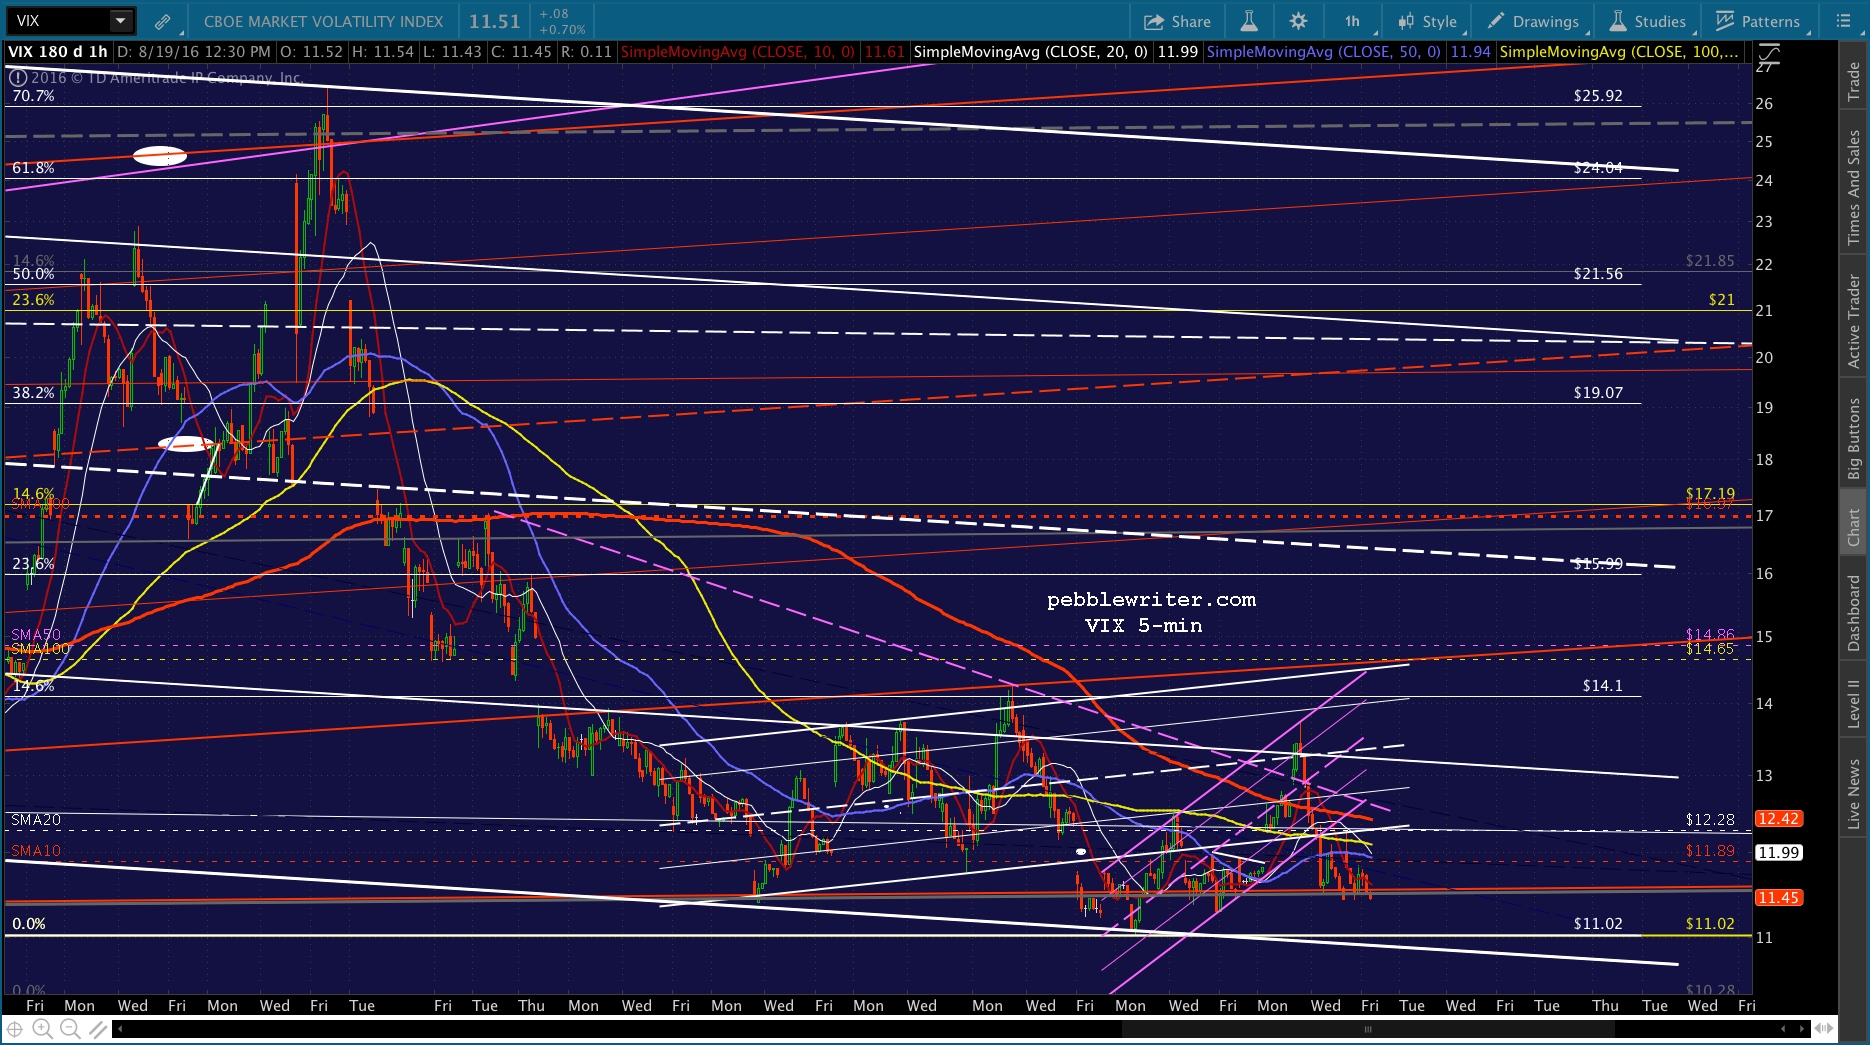
And, USDJPY will probably correct after the close, as usual.
While, CL remains within striking distance of a big breakout, but is susceptible to a drop to 45.13 on a backtest of the broken white channel.