

Last week [see: Oil Takes a Breather] we identified key support for CL at 45.34. At the time, that represented a nifty intersection of the SMA100 and the top of the broken white falling channel. 
It looked likely to happen within a few days. And, CL was kind enough to trace out a well-formed falling channel pointed right at it (seen below in red.)
The following day, however, someone pulled the plug on the falling channel. CL spiked out of the channel (on reports of much higher inventories, at that!) then spent the next five sessions going sideways.
Until today. Moments ago, API reported a smaller than expected inventory build (which should have sent prices higher.) CL, which spent all day going nowhere, suddenly spiked lower, reaching 45.75 and finally tagging the (now higher) SMA100.

The move wasn’t terribly difficult to see coming, and it provided a nice guide to stock prices. Again, from Aug 22:
The big question now, is whether it can properly flesh out something resembling a channel, and backtest the large white channel it left behind on the 16th. If it doesn’t spike higher, SPX should have no trouble reaching 2165 or even 2161.
SPX tagged 2160.39 four days later, the low over the past 3 1/2 weeks — yet again, validating oil’s value as a great tool for influencing stock prices.
My son, a bright and successful financial planner in Austin, asked me today what I thought were the three biggest drivers of global oil prices. Without hesitation, I answered “BoJ, ECB and FOMC.”
The bigger questions remain: will CL bounce here, and what are the repercussions if it doesn’t?
continued for members…
On the 18th, I posted a chart showing a rather large IH&S for CL. The yellow neckline passed right through the yellow dot that marked our last upside target at 50. Had CL completed the IH&S, it would have targeted 78.29. That target is still out there, and it’s close enough to the purple .618 that I don’t doubt its legitimacy.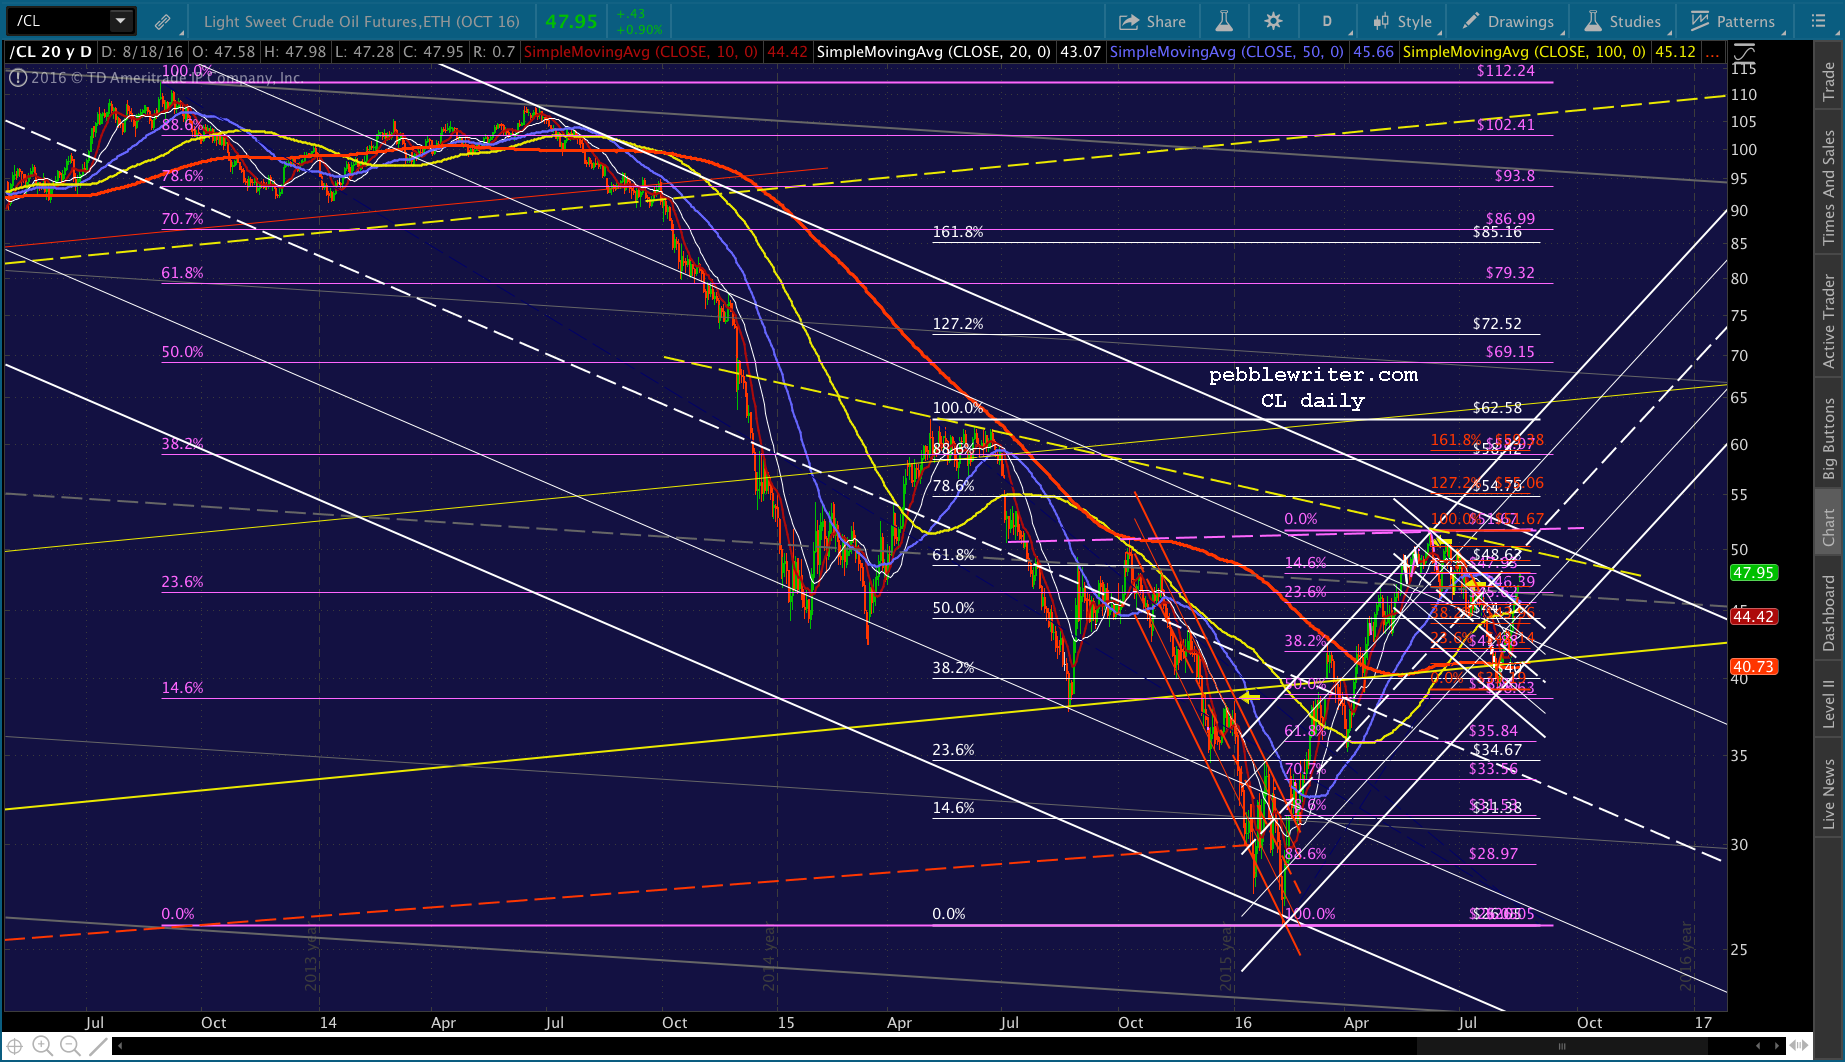
Here’s the close up posted at that time.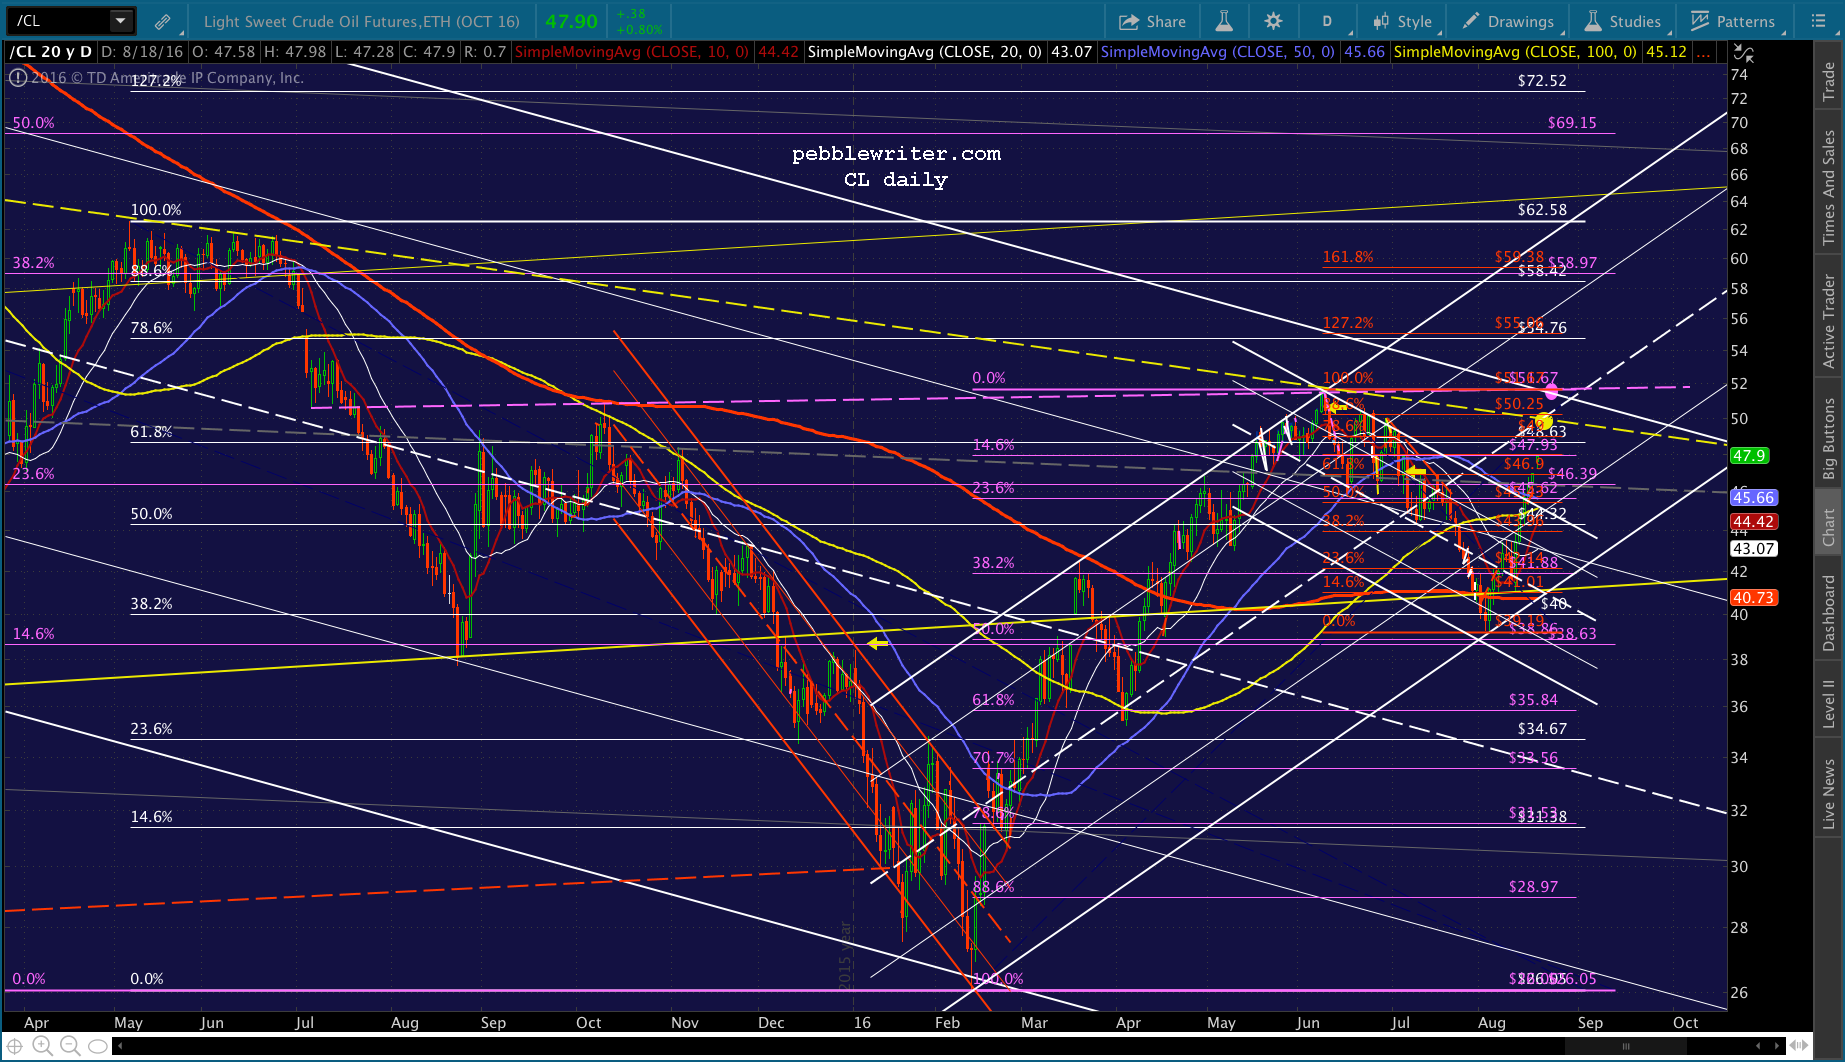
By backing off the neckline, however, CL didn’t complete the IH&S Pattern. At the very least, it delayed the spike up to 78.29 that would have resulted. It potentially did even more damage.
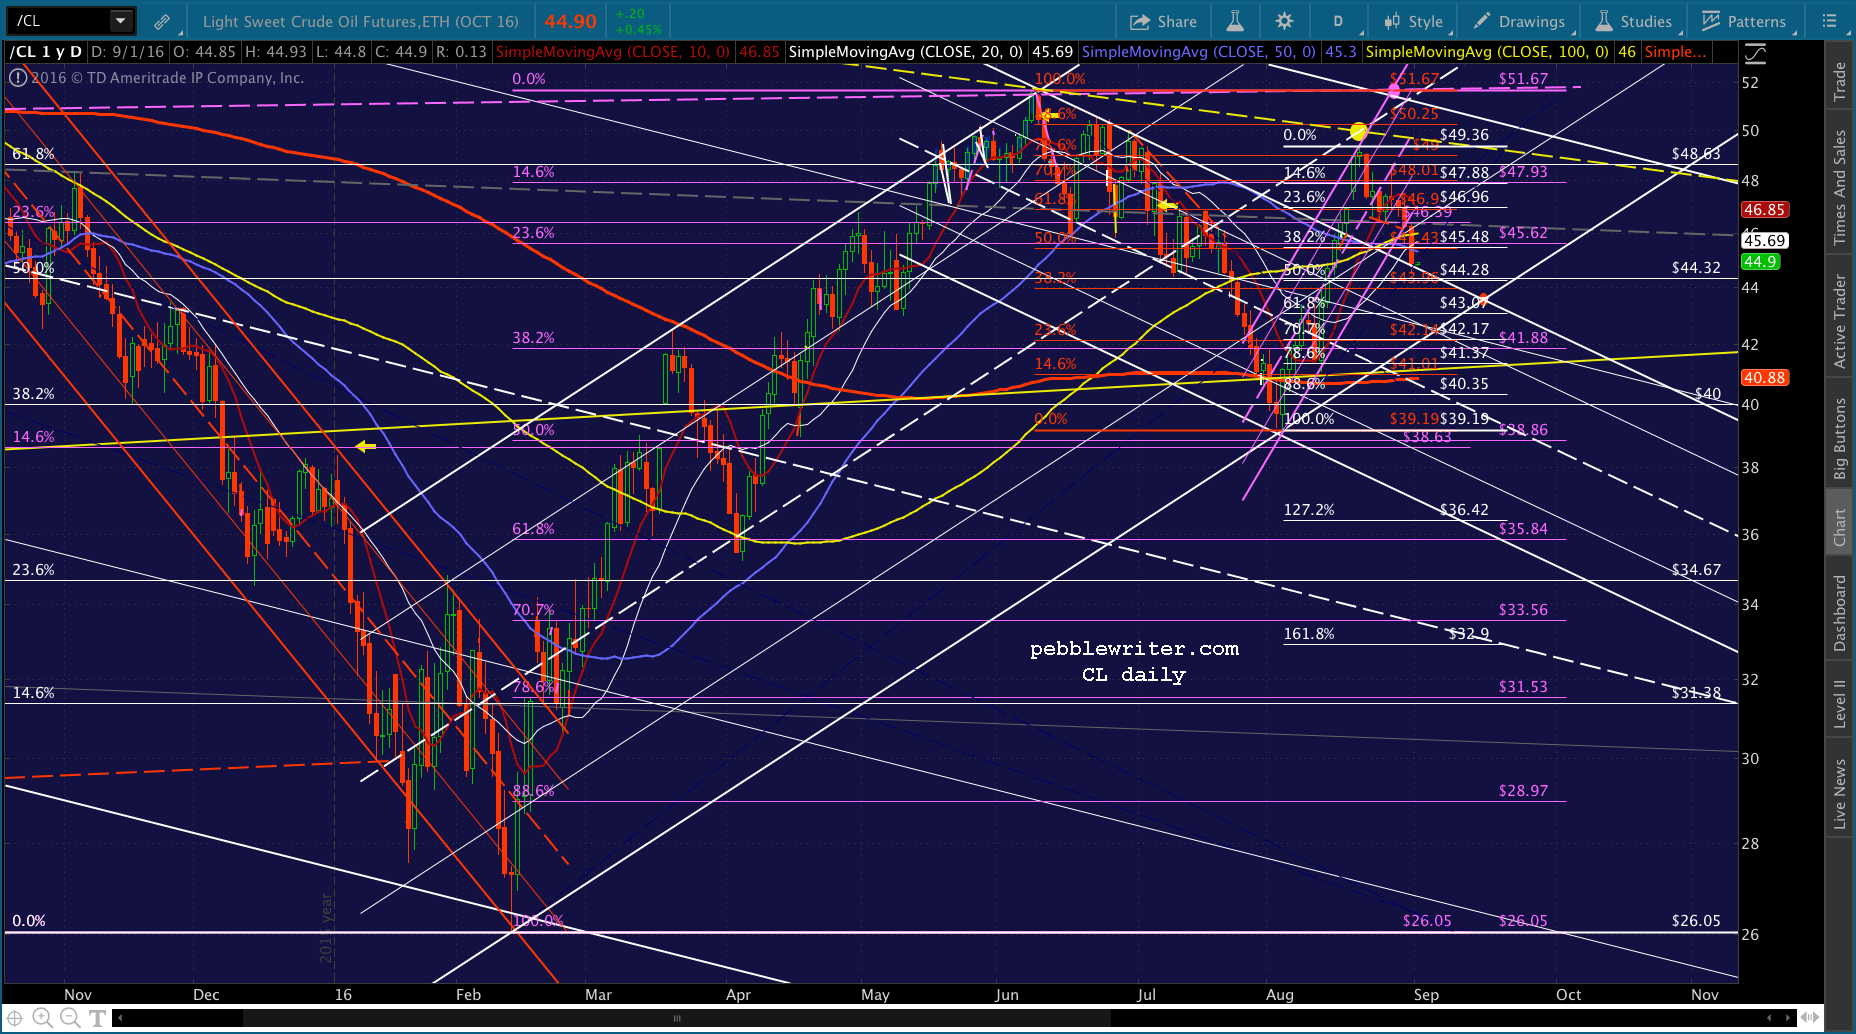
The rising purple channel bottom and SMA100 represent good support. But, the purple channel itself is nowhere near as meaningful as the rising white channel it lies within. Seen here on the daily chart, the purple channel doesn’t even look significant.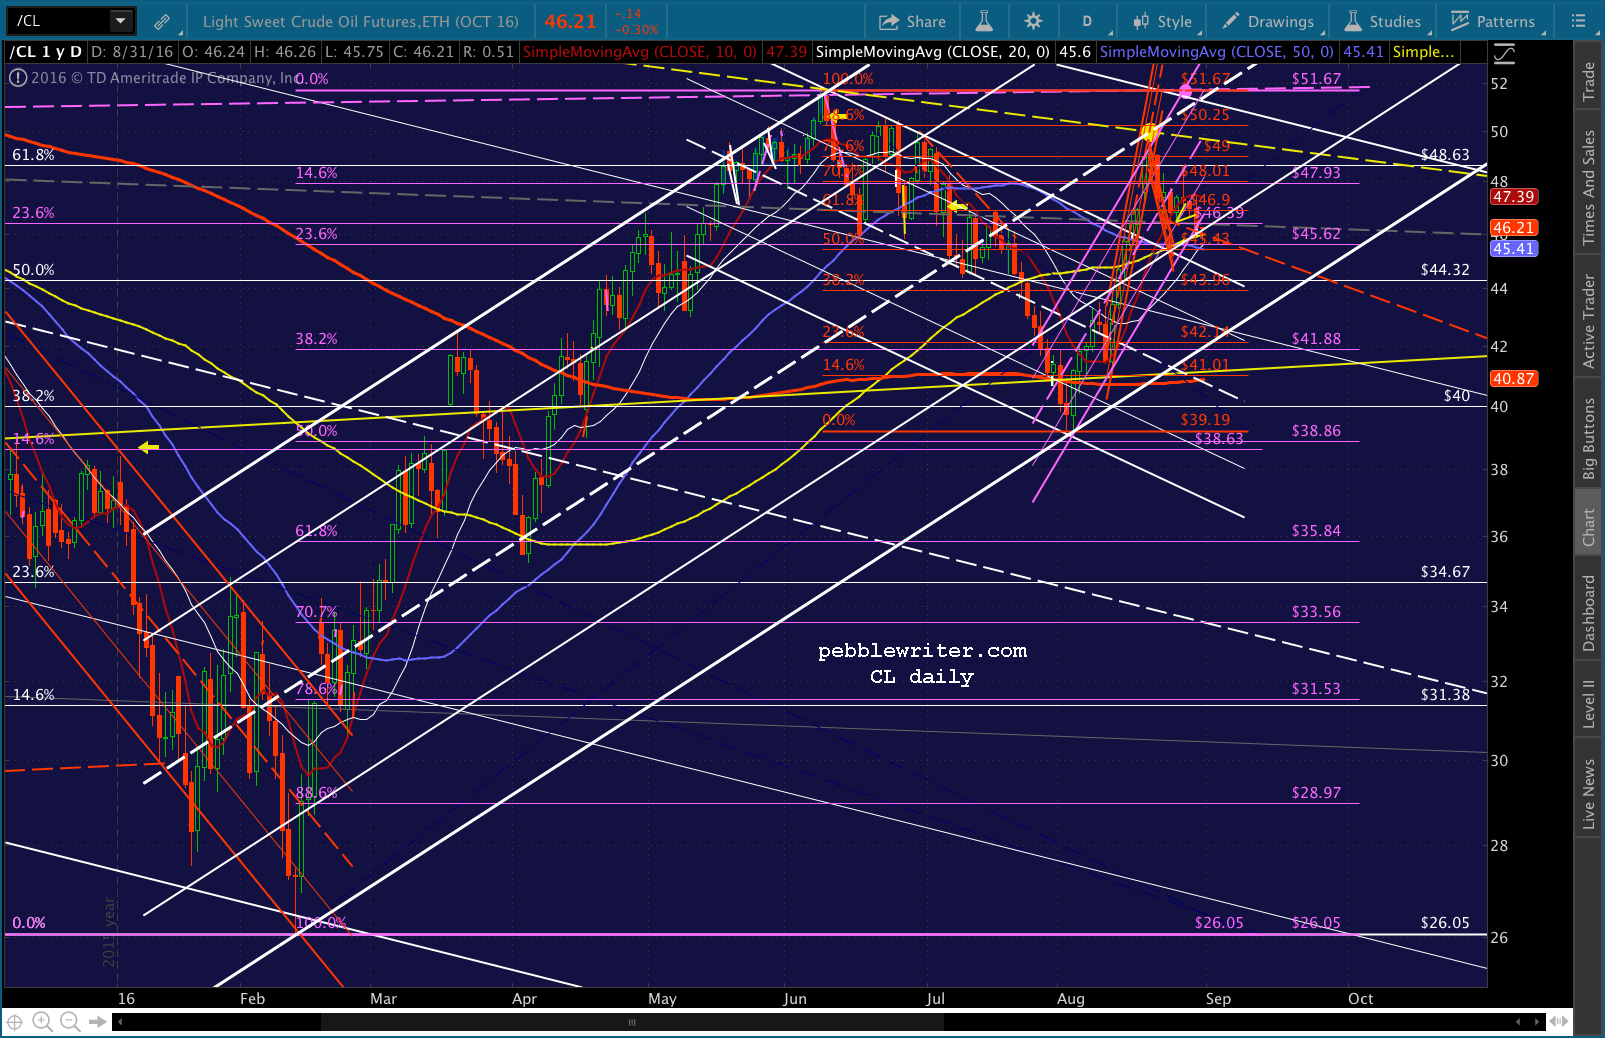
What’s worse, the delay left the falling white channel without a backtest. CL would have to fall all the way to 44.28 – 44.78 (depending on when) dropping through the SMA100 in order to tag it. That would leave it in no man’s land — halfway between the red .382 and .500, somewhat close to the white .500 Fib, and pretty darned far from the rising white channel bottom at 42.
In short, it’s a mess — all because the guys pushing the “prop up the market” button got a little slap happy over the past few days.
To further complicate things, DX and USDJPY just broke out. Is it possible the yen carry trade is being resuscitated and CL will be allowed to decline further?
If so, then we’ll likely see it drop down to 43ish over the next several weeks (the red dot in mid-September) to tag the white channel bottom and, potentially, the white .618 Fib at 43.07.
But, I’m not too keen on this idea. CL’s tiny decline today (before the close) had a much bigger impact on stock prices than USDJPY’s large spike. Traders have been well trained to largely ignore USDJPY and focus on CL. So another 7% decline could do some real damage to stocks — maybe even enough to force a backtest of SPX 2138.
After breaking out today, DX is very likely to run out of room pretty soon.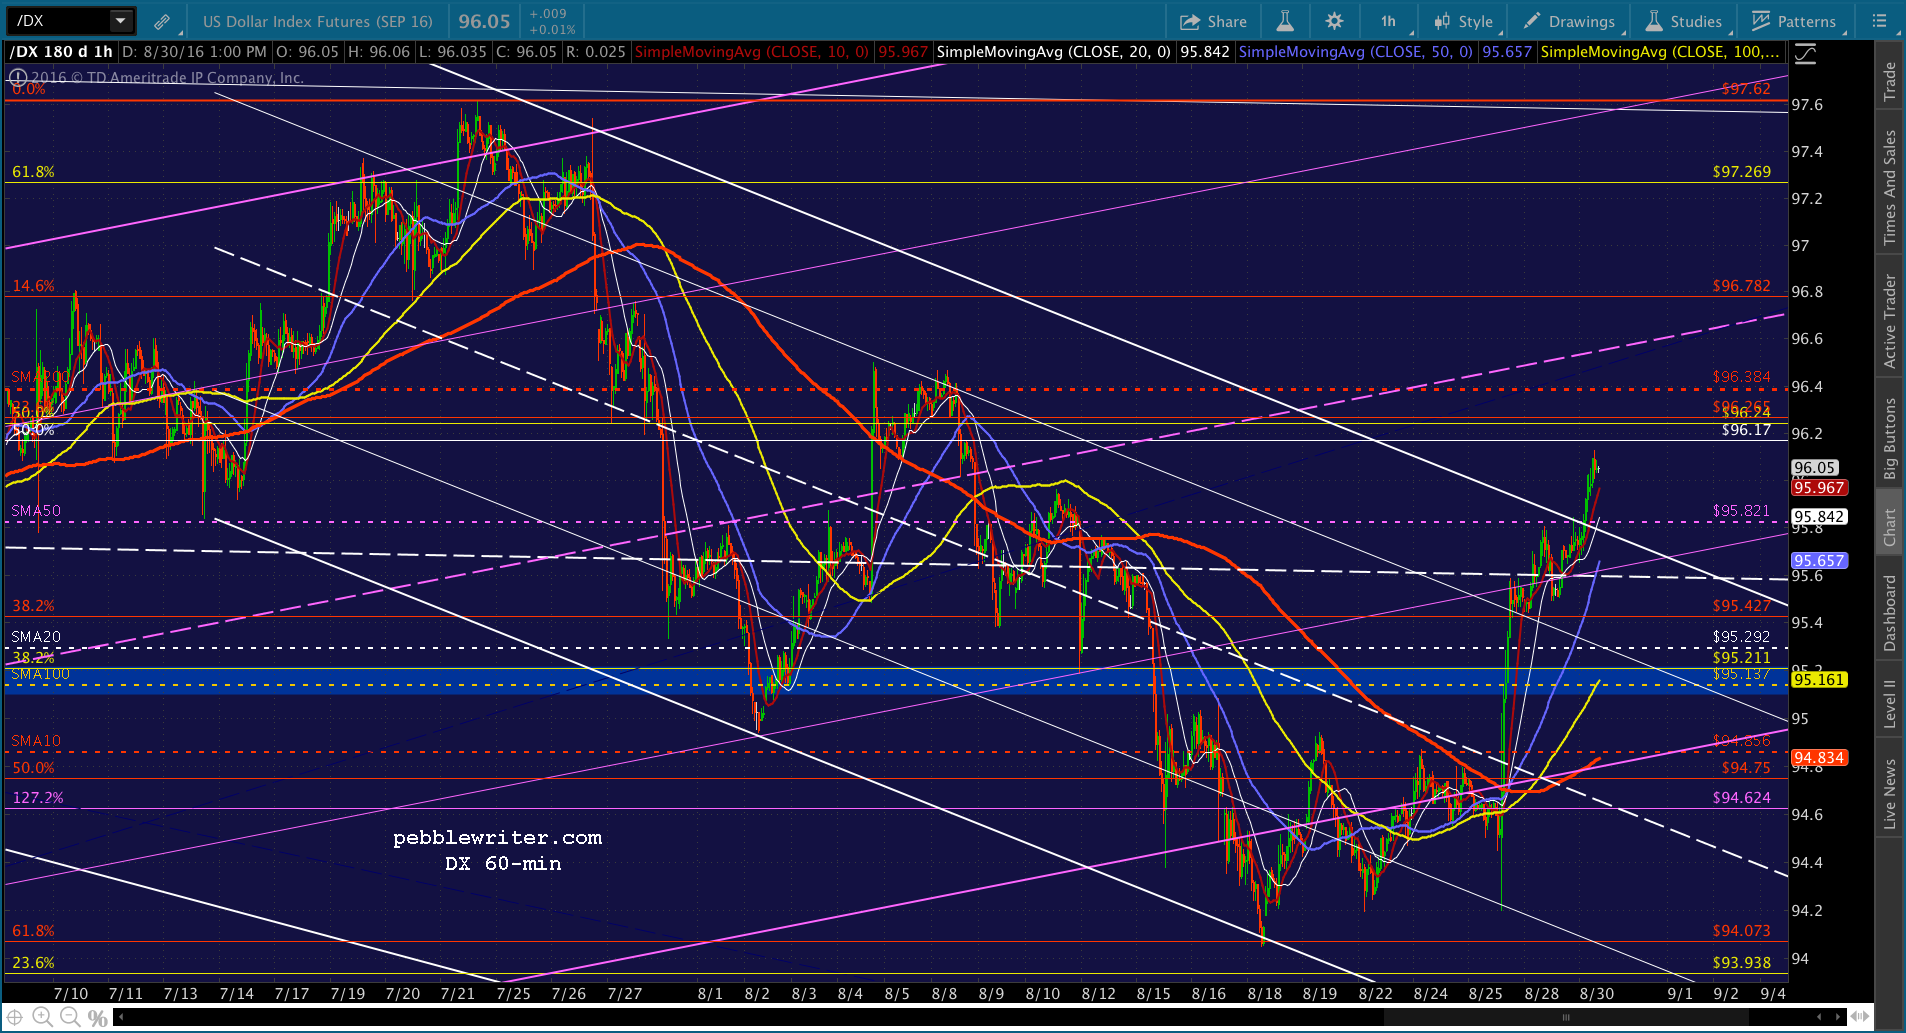 EURUSD has almost reached very strong support at 1.1115. A tag is likely tonight or tomorrow.
This means a retreat for DX, which is just below its own SMA200 at 96.367.
A retreat for DX usually means a retreat for USDJPY — i.e. no help from the yen carry trade. So, a dip for CL, DX and SPX all at the same time seems like a distinct possibility.
Kuroda has been hinting at a large expansion of QQE for some time. This could be the front-running of that move. SPX fell 30 points between Aug 23 and Aug 26, the period following CL’s failed breakout. Another 40 points on a further 7% decline in CL seems appropriate.
This is where our analog comes in. I initially put a low point at 2157 on Sep 6 (the red dot, below.) If the rising purple channel should break down, or just see another test of its bottom in the next week or so, this would correspond with CL backtesting its white channel at 44.40ish.
Sooner, and the tag would be a little higher. Later, and it would be a little lower.
UPDATE: Aug 31, 11:00 PM
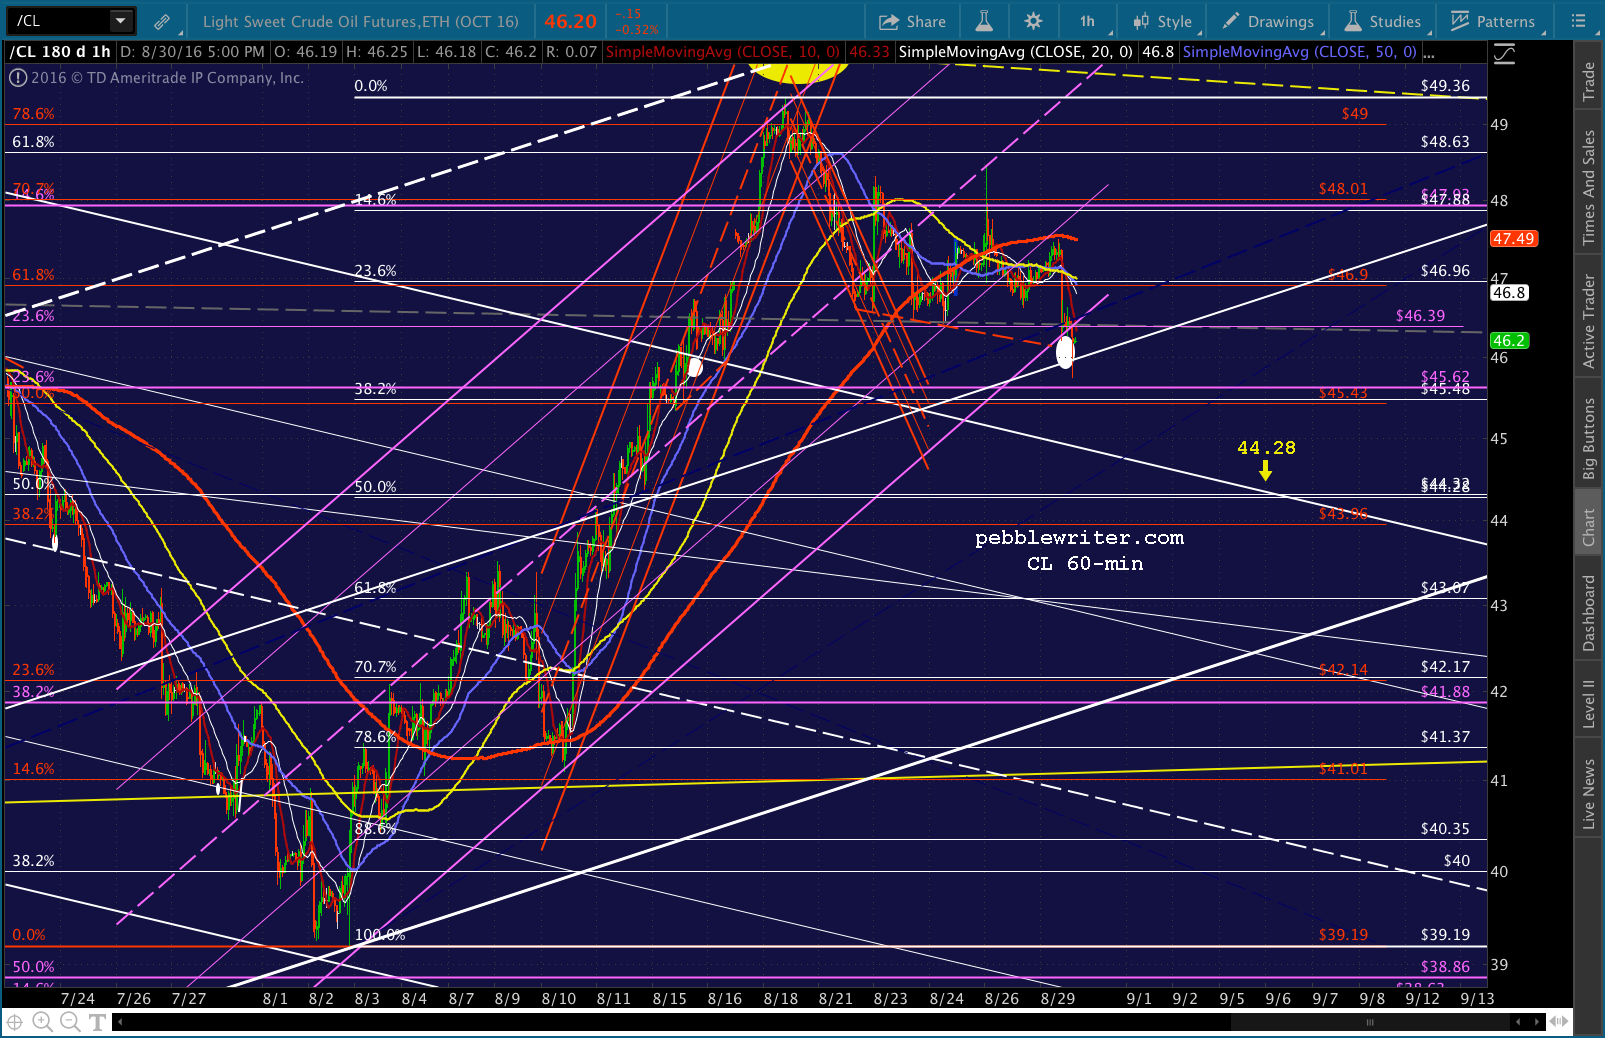
I completely ran out of steam yesterday, so didn’t get a chance to finish this. Now, I’m very glad that I did. CL tagged its falling white channel top today — bottoming at 44.51 after two other attempts at bouncing. I had the channel top at 44.77, so it overshot it very slightly — well within the margin of error in drawing such a chart.
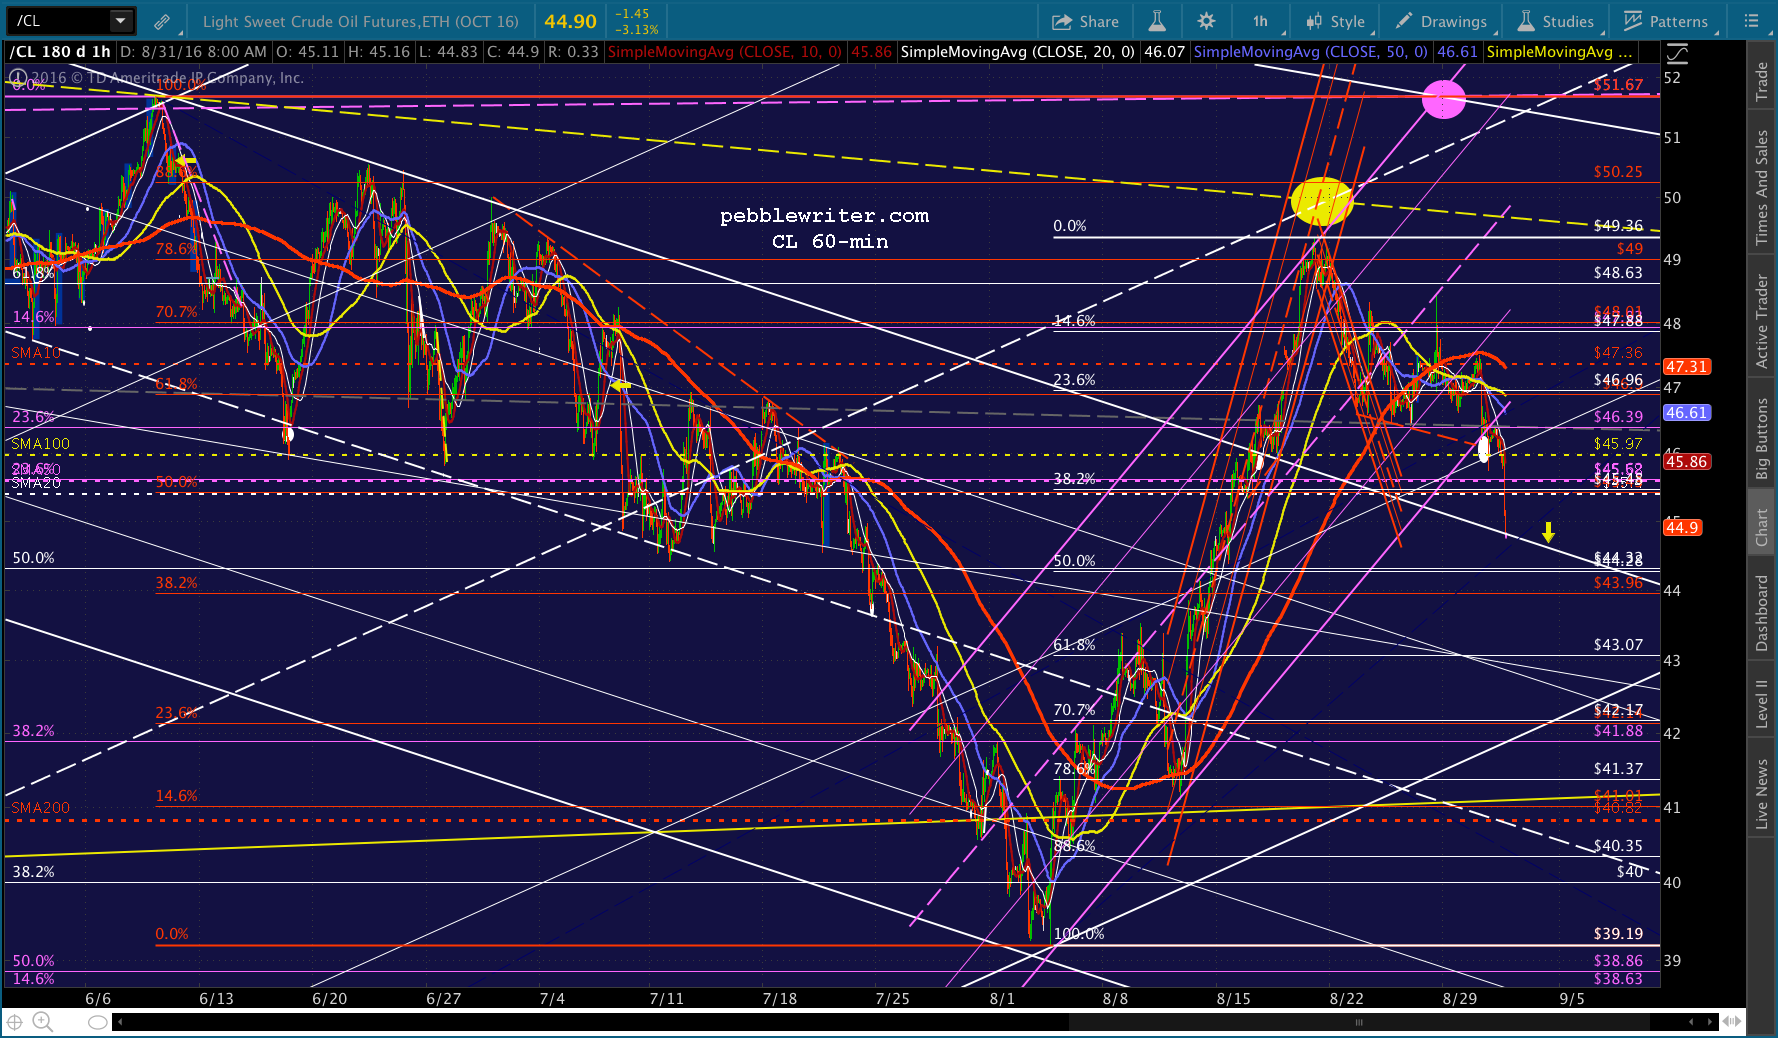
With the backtest out of the way, all we have to worry about is the rebound. The initial reaction upon bottoming was very lackadaisical. It was several hours before it made any headway at all. Even now, it’s bounced only 0.40 points — hardly noticeable on a larger chart.
What is noticeable is that the purple channel broke down completely — never liked it anyway — and that we’re still very far away from the big rising white channel bottom. I put it at about 42.25 if CL were to drop straight there right now.
Again, this was completely avoidable if CL had backtested several days ago, safely within the purple channel. It would have maintained upward momentum very nicely. Now, it’s a big question mark — since backtesting the rising white channel is arguably more important than holding above the falling white channel top.
It has led me to wonder if TPTB aren’t willing to allow SPX 2138 to go ahead and happen sooner rather than later. The next two sessions are key, as we’ll see whether the backtest holds. If it does, the next stop is the yellow neckline up at 49.36 (again.) If not, next stop is somewhere between 42.25 and 43.54.
This doesn’t mean, of course, that CL won’t help stocks. It’s very good at rallying during the day to pump stocks higher, then resetting overnight. It can even do this while declining, as we saw during most of July.
Stay tuned.