

Last chance to nab an Annual Membership at a 62% discount. And, we still have a few discounted Monthly Memberships left. For details and to sign up now CLICK HERE.
* * * * *
Today, it’s all about oil — which reached our next upside price target yesterday. I know, I know. Most investors are focused on how the ECB and German government will bail out Deutsche, or what Evans and Lacker might have to say, or even the NY ISM data. And, I’d be shocked if oil even makes any headlines, today.
Still, it’s the most important chart I’m watching at the moment. As I noted in yesterday’s Update on Oil, whether or not it breaks out or reverses at this point will determine not only where stocks go for the next few months, but whether or not the economy is able to muddle through.

continued for members…
The bigger picture shows all three IH&S Patterns in play. The big kahuna is highlighted in yellow.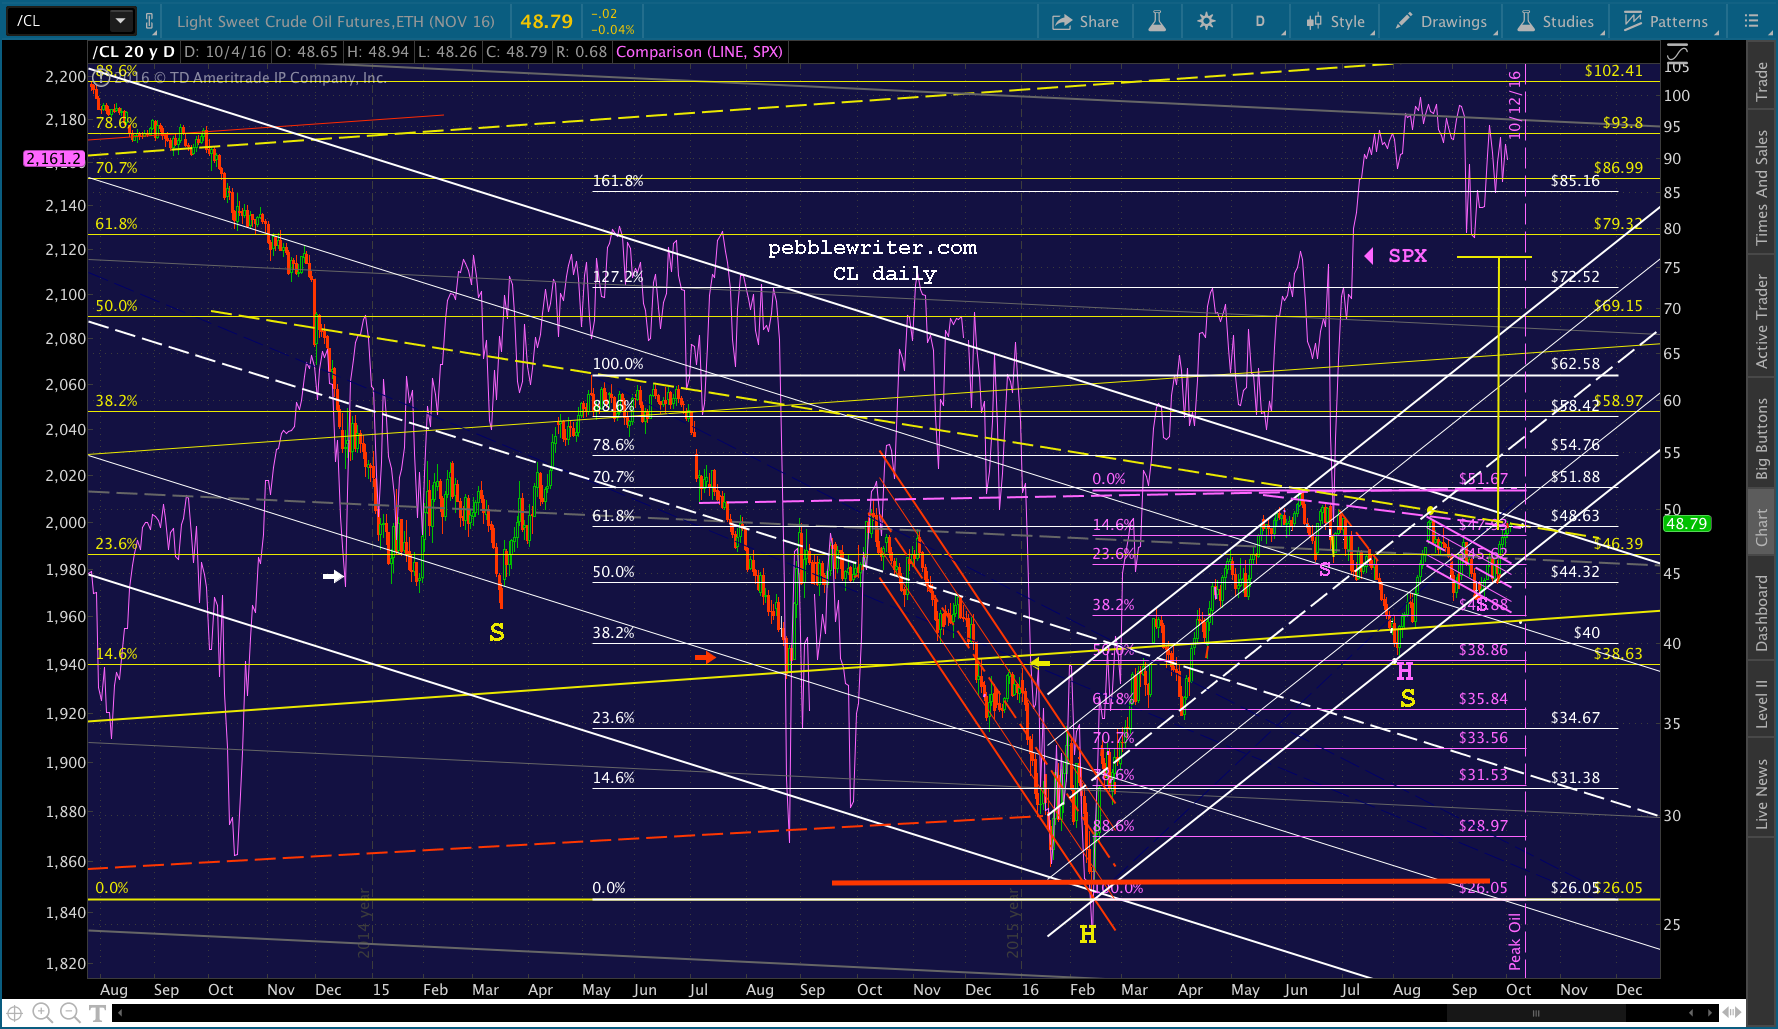
Note that when CL first established the yellow neckline last June (at the white .618, at that) it led up to the Brexit mini-correction. The next time it had the opportunity to push through, on Aug 19, it fell back instead. SPX corrected by 74 points. Now that it’s here again, TPTB have a choice.
(1) let these IH&S Patterns play out and drag stocks along to new highs, inflation be damned.
(2) let the patterns play out until mid-October or early November, long enough to keep stocks on the rise into the election.
(3) slam CL back down from current prices as occurred in mid-August, and let USDJPY take up the reins. It’s been itching to break out ever since Brexit, testing the falling red channel top eleventy billion times.
When it comes to driving stocks higher, TPTB only have a few choices: CL, USDJPY, VIX.
They can always hammer VIX, but at some point those seeking protection bid it back up.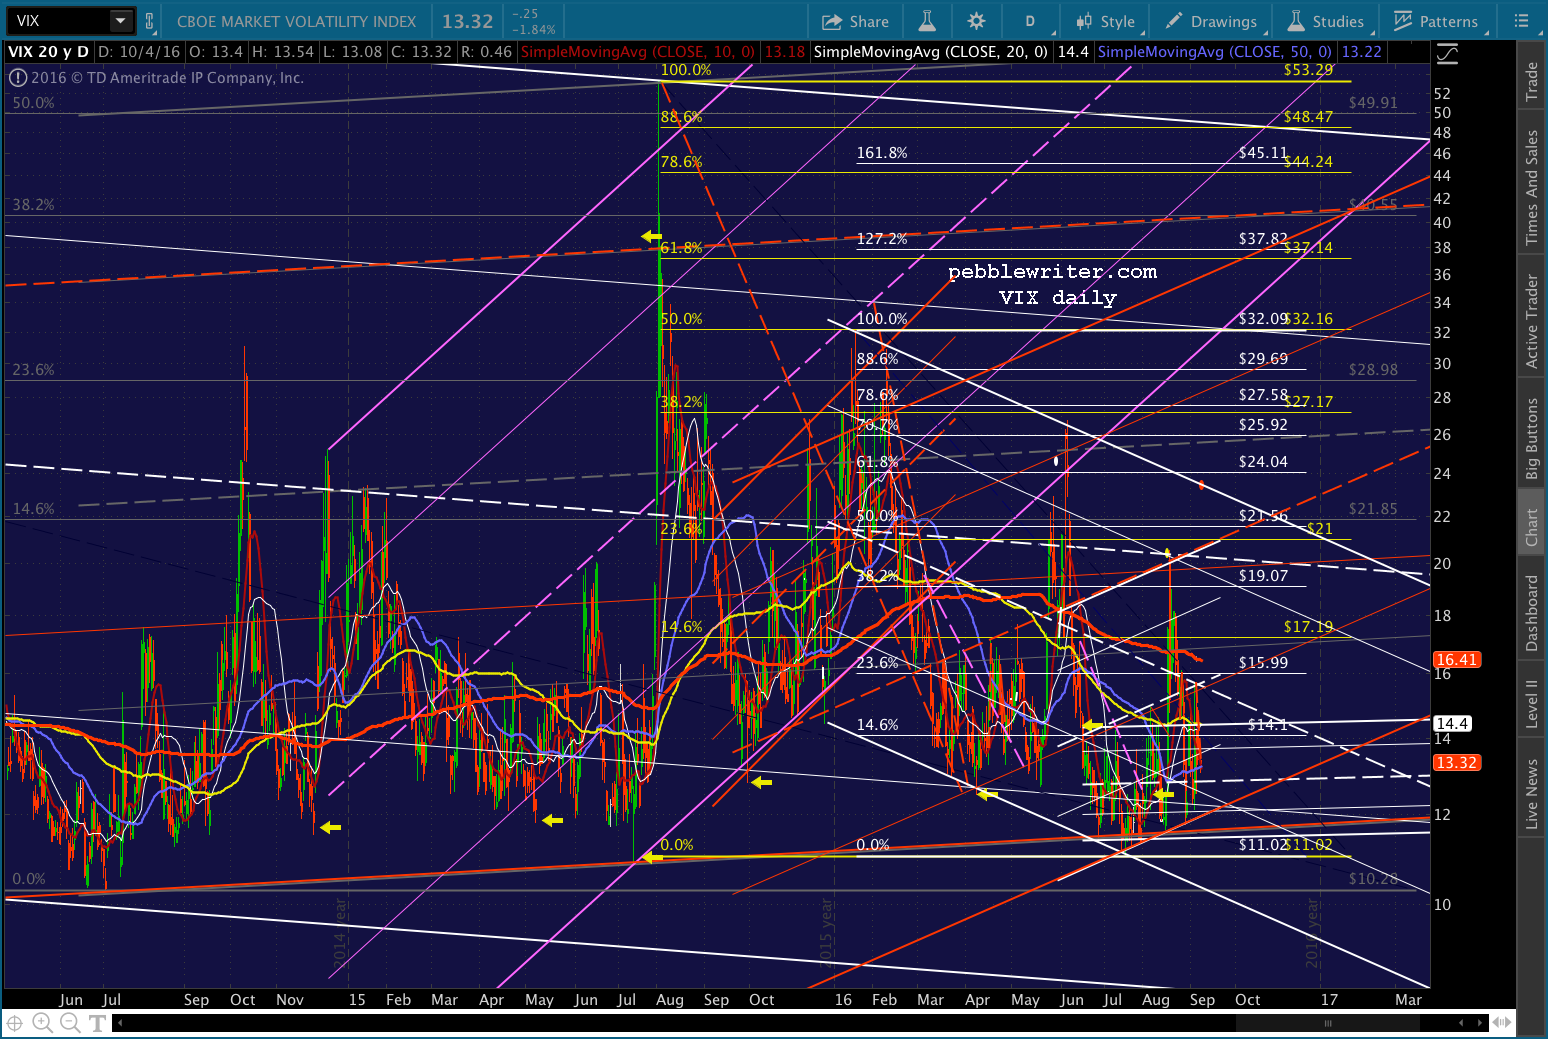
They can push CL on up through the neckline, with the consequences of higher inflation and probably stagflation.
Or they can go back to the yen carry trade, in which case we’d see USDJPY break out — sort of like it is this morning.
Here’s a little clearer look at the big picture: 60-min and daily

I know it doesn’t look like much. But, for now, this little breakout by USDJPY is what’s propping up stocks. It’s already completed a Bat Pattern at the purple .886. It could slip a little higher to 102.697, where it runs into the white .618. At that point, it has some awfully big decisions to make.
CL is currently sitting just above the neckline, unwilling to commit just yet.
In essence, both are priced to perfection at this time. A breakout by either, and stocks will do just fine. A failure to break out, especially by CL, and SPX is headed for that 2148 target we talked about yesterday.


If CL breaks out in a big way, we could be up to 2214 (big, purple dot) in a jiffy. It it reverses, and USDJPY doesn’t pick up the slack, then we’ll be testing the May 2015 highs (yellow dot) again in the next few days.
The great thing about channels is that you’re either in them or not. There’s usually not a lot of indecision. SPX has to either continue following the red channel (within the rising white channel from Feb) higher, breaking out of the falling white channel. Or, it will continue following the falling white channel.
The 60-min chart below shows a clear consolidating triangle, with apex around Oct 14. So, there’s a pretty good chance SPX will muddle along, bouncing between the upper and lower bounds, currently 2171 on the upside and 2148 on the downside, until CL or USDJPY makes a clear decision.
Personally, I’m looking for CL to reverse for now, but push higher intraday and/or threaten to break out every time stocks get in trouble. It can stay above the white channel bottom without breaking above the neckline all the way until Nov 1 or so. That’s a lot of potential for chop for both it and for SPX.

UPDATE: 11:10 AM
So far, so good.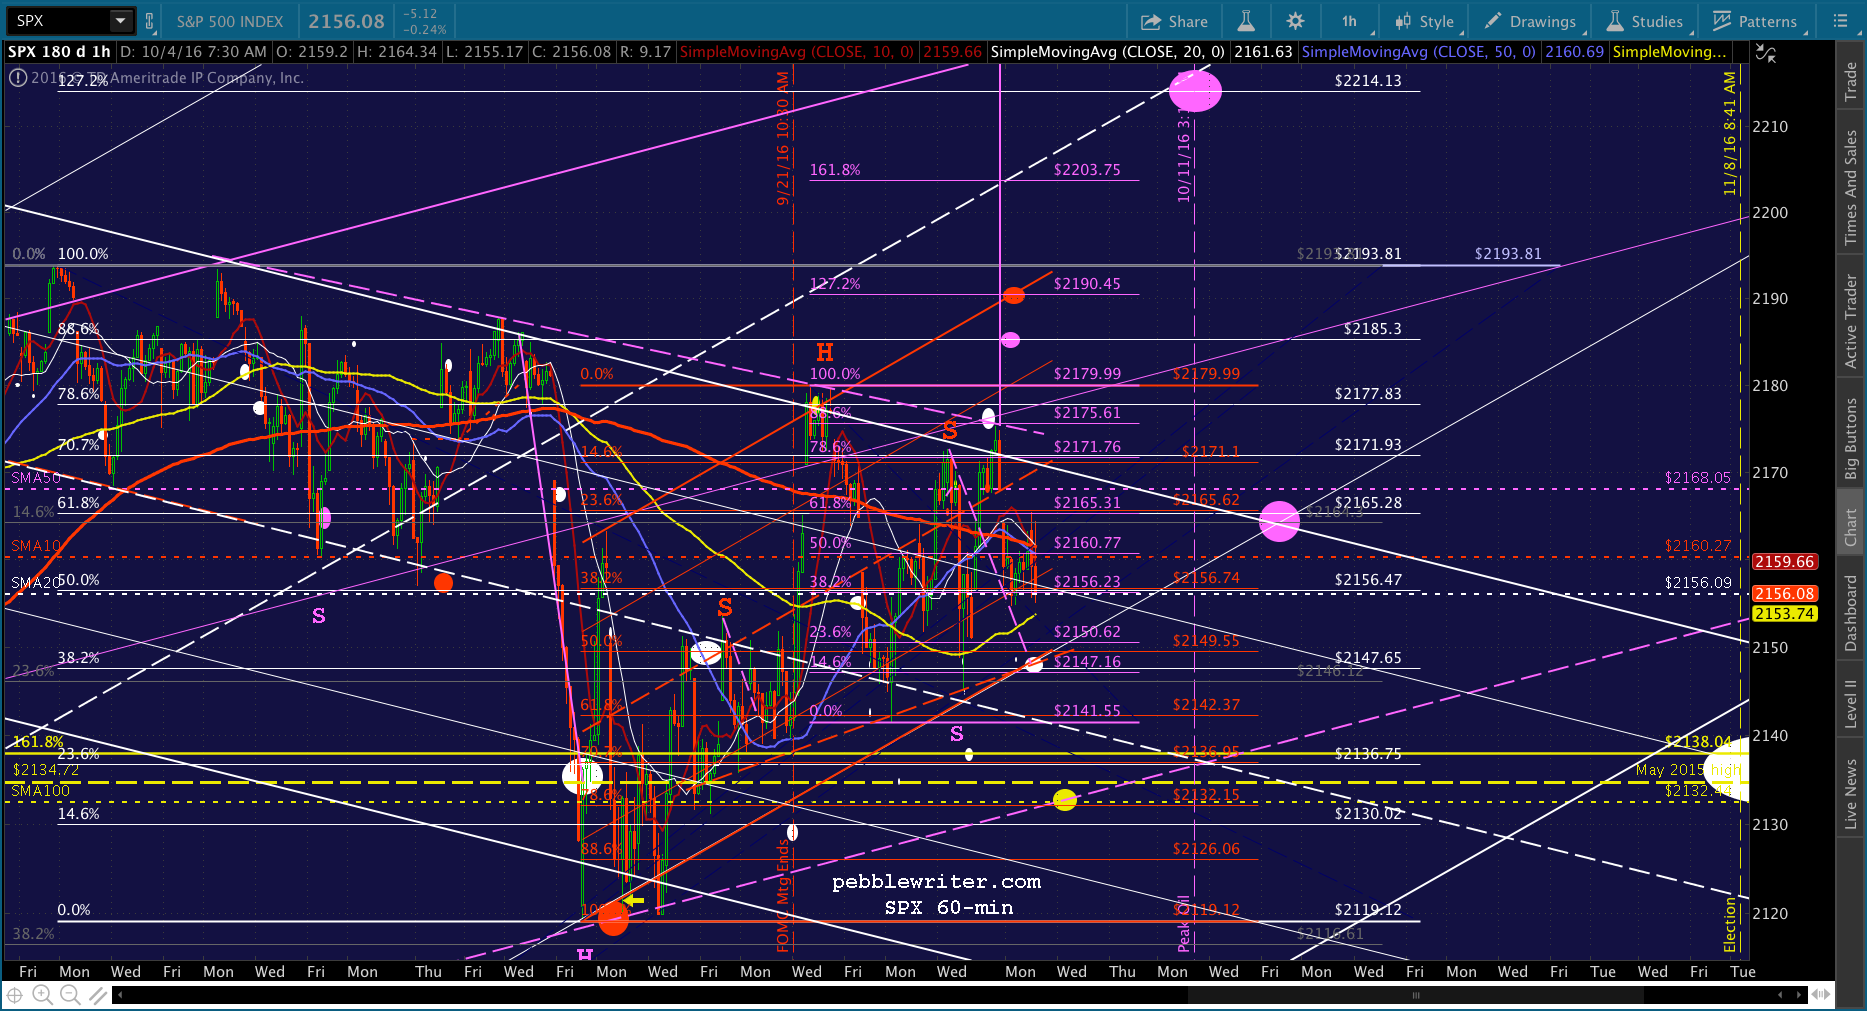

I’d look to go long at 2148.63 or so with relatively tight stops. If it breaks down below that, then we’re probably heading for 2132. But, I doubt it would happen today.
Almost forgot…bonus chart on DB: 
This will be my last post for the day. Good luck, everyone. I’ll check back in this evening.
* * *
As I wrote yesterday, I’ll be out of the office for the rest of the week and, most likely, some of next week. I’ll post updates each morning and as often as possible during the day.
Comments
8 responses to “The Most Important Chart”
PW, SPX broke 2148.63 but it recovered. And CL just broke out after hours as you described.
Nailed that 2148 target, Pebble!
Gold is crashing $1277 on the futures any bottom in sight?? Thanks
Seems to have found channel and SMA200 support here. Should be on the rebound. If not, things couold get ugly.
holy cow, havent seen movement like this in a long time what is happening
welll everything working for them today oil, usdjpy vix and db despite ism bad numbers
well usdjpy had a nice move overnight stocks held gold down rate hike odds up dollar up market up so what does it take for the market to go down
If CL reverses, it’ll take a lot more than a move like this from USDJPY to prop stocks up. Traders don’t trust Kuroda. And, right now, the sentiment against him within Japan is mounting. He’s becoming more and more cornered, which incidentally means the chances of him doing something “crazy” are rising.