

In our last update [see: Aug 30, 2016 Update on Oil] I noted that CL had bounced prematurely, leaving the channel it had broken out of without a backtest. It was at 46.20 at the time.
…the delay left the falling white channel without a backtest… To further complicate things, DX and USDJPY just broke out. Is it possible the yen carry trade is being resuscitated and CL will be allowed to decline further?
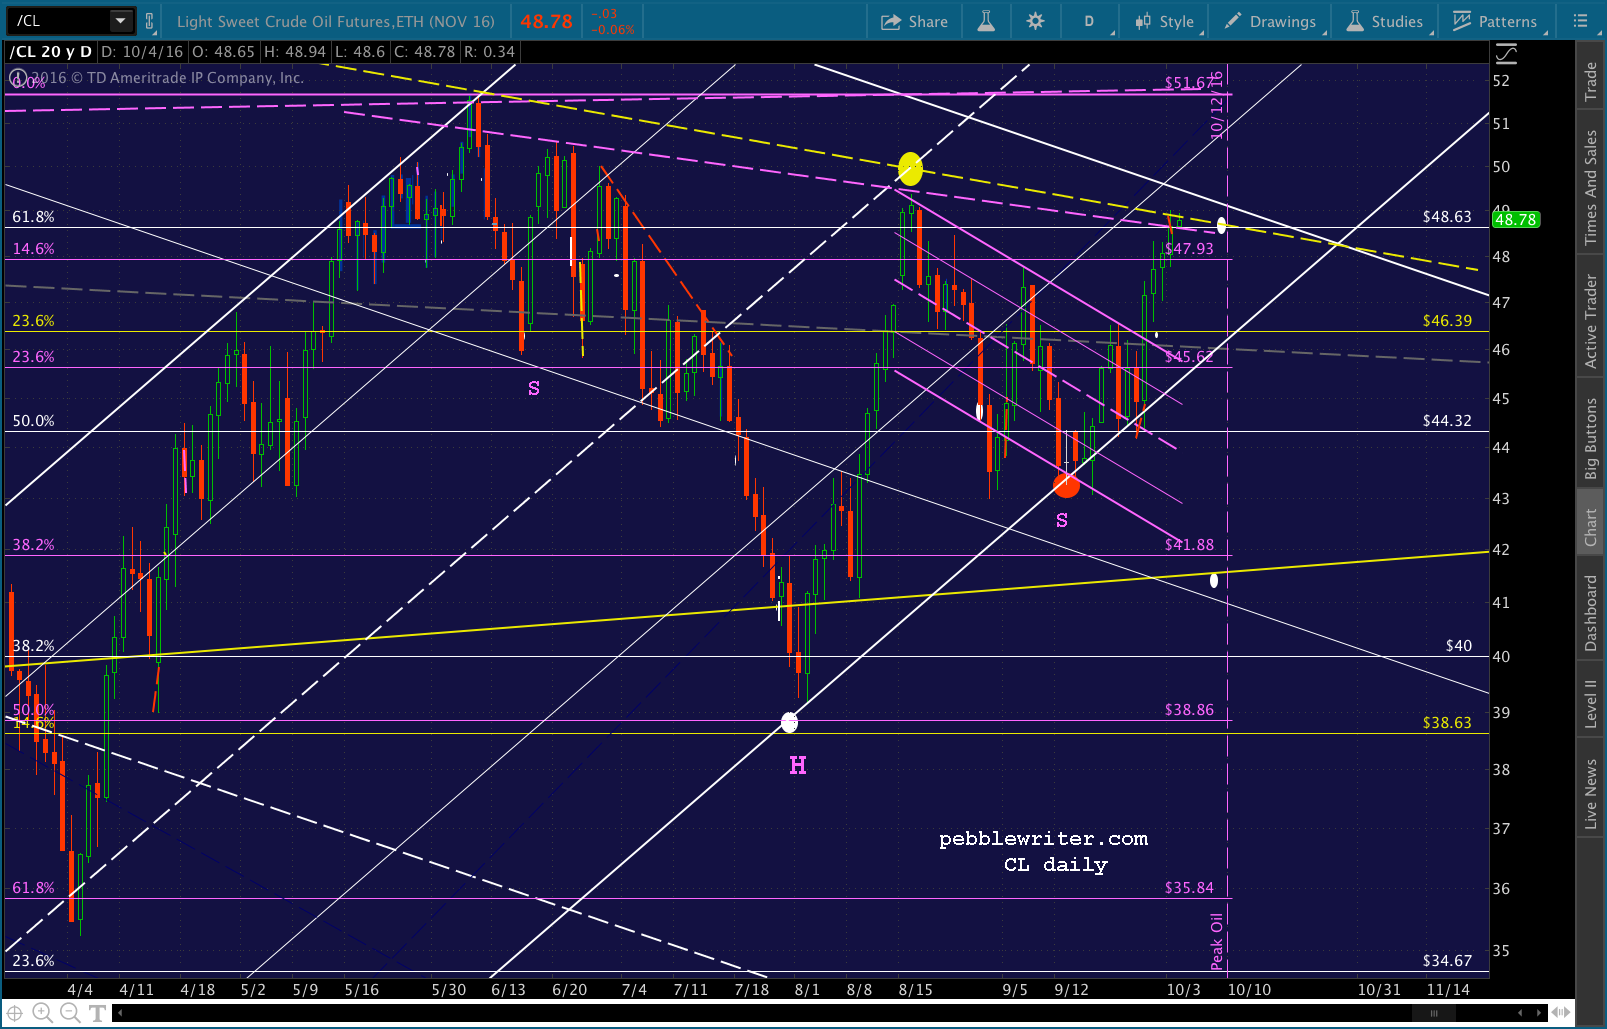
If so, then we’ll likely see it drop down to 43ish over the next several weeks (the red dot in mid-September) to tag the white channel bottom and, potentially, the white .618 Fib at 43.07.

As it turned out, the yen carry trade was resuscitated. USDJPY rallied over 4% between Aug 26 and Sep 2. This left CL free to decline without seriously dinging stocks.
CL did more than backtest the white channel by mid-September. It dropped through the channel top, tagging 43.07 (actually 43.00) only two days later. As expected, it got a tremendous bounce at that point — gaining 11% in the next week.
Not surprisingly, not one client complained that the forecast came together so quickly! But, the rapid rebound left me with a charting quandary. By coming when it did, the bounce left CL without a solid tag of the rising channel from Feb 11.
Fortunately, there was a solution: another tag on Sep 20 — this time at 43.06. By coming back for another swipe at it, the rising channel bottom was tagged, too. With that nicety out of the way, the next rebound was even more impressive: 13.8% as of earlier today, when it tagged our 48.64 upside target from last week [see: Don’t Worry, Be Happy.]

For those who’ve played along in CL, congratulations. You’re up about 35% (unleveraged) in the past five weeks alone. This, on top of the 120%+ that came since our Feb 11 bottom call [see: USDJPY Finally Relents.]
For those who haven’t, I encourage you to give it some thought. Charting CL has been easier than charting equities — especially since I came to understand that CL was being used as a tool with which to drive equity algos.
With that said, let’s look at the path forward. Today’s high marked an incredibly important inflection point. Where it goes from here will likely be the most important determinant of equity prices for the remainder of the year.
continued for members…
First, some of you might have noticed the little Inverted Head & Shoulders Pattern completed today. It’s shown below in purple, and targets 59.3, which seems like a perfectly nice target. Comes pretty close to the white .886 at 58.42. But, this pattern isn’t terribly important.
The really important pattern is the huge IH&S we charted a few months ago. This one, shown below in yellow, also completed today and targets 76.21 — about where the yellow .618 Fib resides.
But…and this is a very big but…there’s a problem with this scenario. As we discussed in our last big picture post, a rise to 59 isn’t a big deal, especially if it happens in the next couple of weeks. Because, a year ago, prices were at this same level. That is, there would be no inflation effect from the rise from 26 in February.

If it were to continue rising after, say, 52-53 on October 10, then we’d start to get noticeable year-over-year inflation. It would be very inconvenient for, say, central banks which are trying to sell us on the need for more inflation.
A couple more wrinkles: (1) another IH&S with a flat neckline around 51.67 — the June 9 highs; and, (2) the top of the huge falling white channel from June 2014. I don’t particularly like this channel, but it’s the best we’ve got — so, it’ll likely matter if we break out in the next few days.
As I see it, TPTB have three choices:
(1) let these IH&S Patterns play out and drag stocks along to new highs, inflation be damned.
(2) let the patterns play out until mid-October or early November, long enough to keep stocks on the rise into the election.
(3) slam CL back down from current prices as occurred in mid-August, and let USDJPY take up the reins. It’s been itching to break out ever since Brexit, testing the falling red channel top eleventy billion times.
If CL breaks out, watch for USDJPY to be the short of the century. Likewise, if USDJPY breaks out in a big way, CL can start dropping like a rock — or, at least as fast as they can without it hurting stocks.
Stay tuned.