Category: Charts I’m Watching

  • More Where That Came From

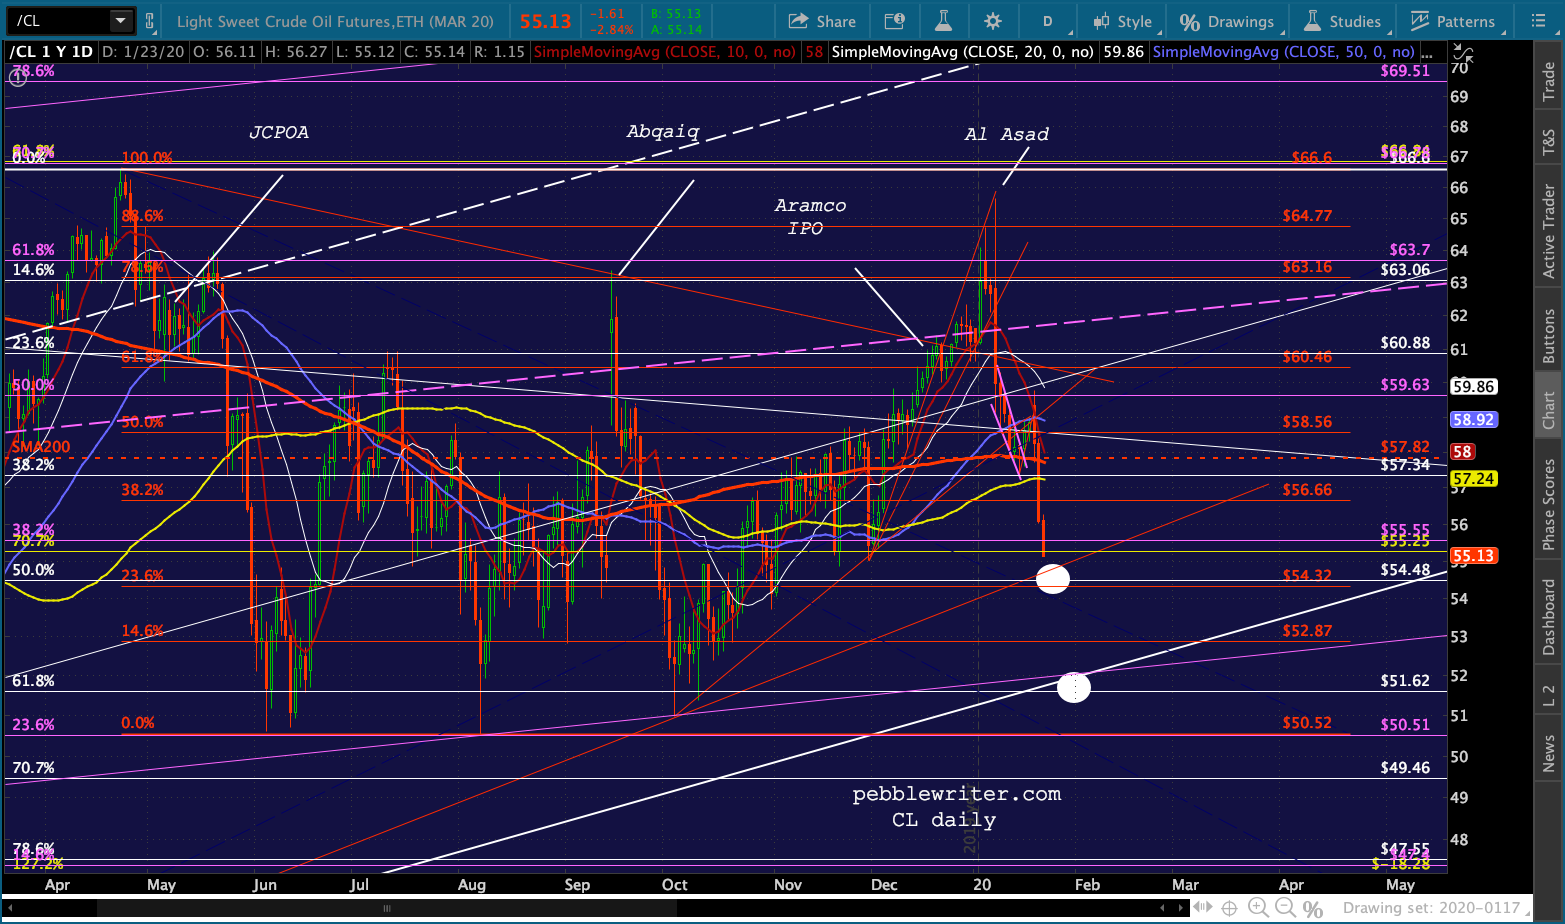
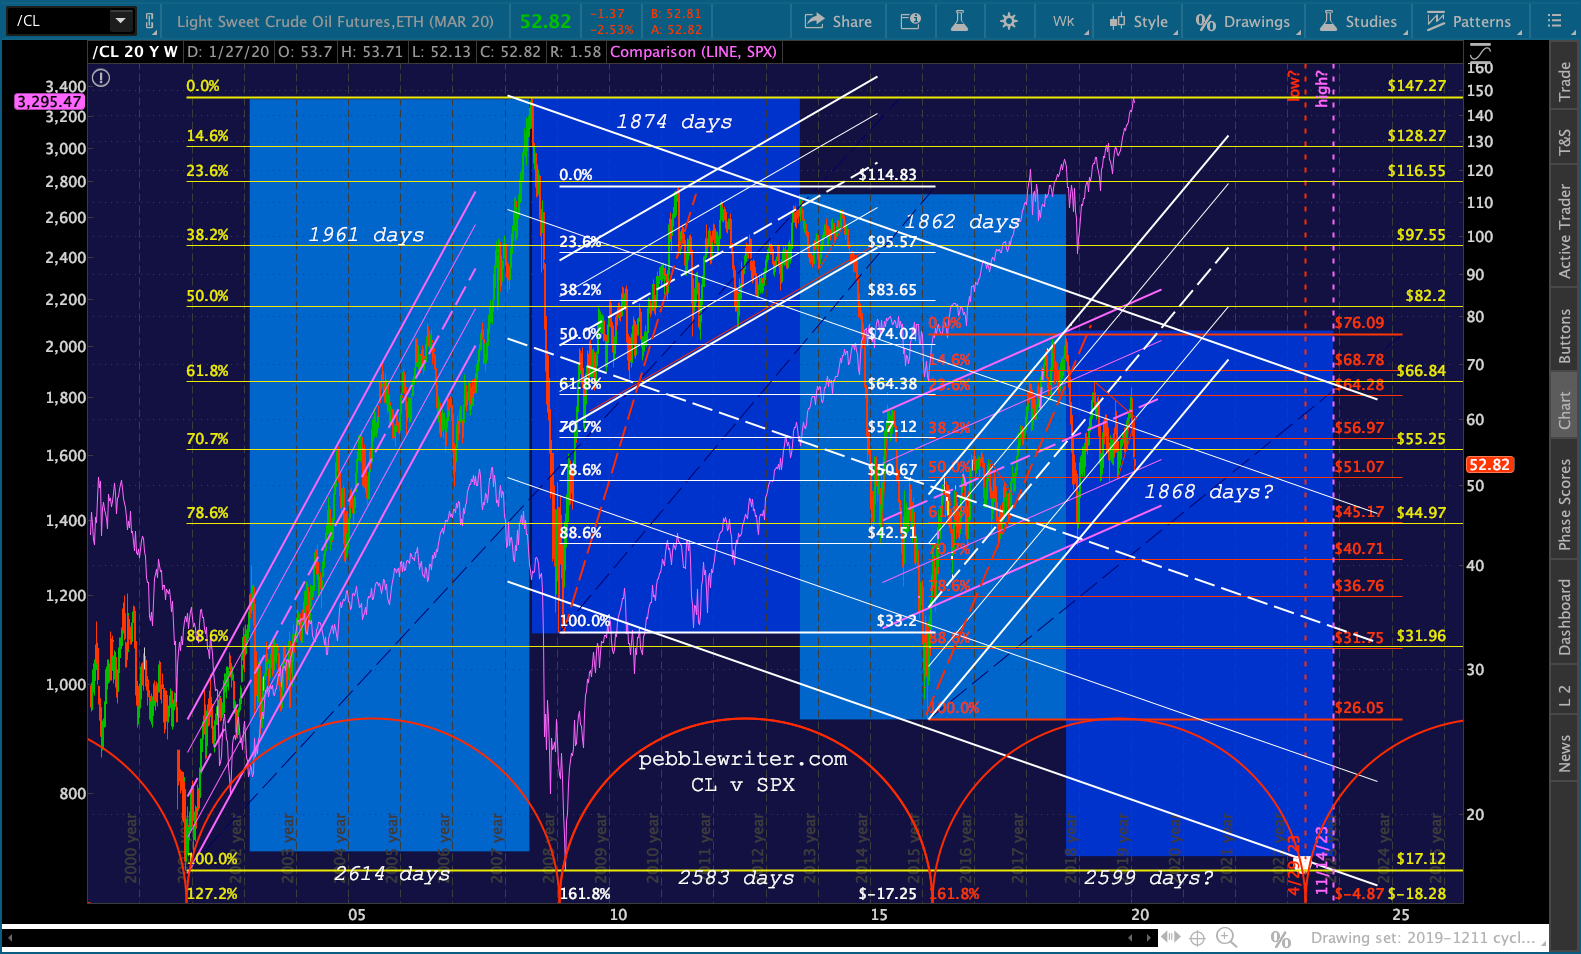
    We’ve been bearish on oil for quite a while, shorting it at 75.57 on October 3, 2018 after Jamal Khashoggi was dismembered and at each of the 3 subsequent peaks since then: just before the JCPOA breakup, the Abqaiq attack and the Aramco IPO — which should have been a peak, but resulted in a headfake “breakout” climaxing in the Al Asad attack.

    Last night, CL dipped to within 0.41 and RB within 0.187 of our next downside targets. As members know, these are critical support levels. A breakdown would be devastating to oil and gas and present stocks with very strong headwinds.Futures, now at 3260, are headed straight for our next downside target at 3200.Yes, the coronavirus is potentially a very big deal. But, this decline in oil and gas was baked into the markets over a year ago and is a strong endorsement for our inflation model.
    continued for members(more…)

  • Charts I’m Watching: Jan 24, 2020

    SPX hit our initial downside target yesterday: a backtest of the 1.618 Fib extension at 3306.51. USDJPY and CL also tagged their initial downside targets and bounced. Combined with VIX being hammered as it neared its SMA100, this was enough to produce a gain on the day which accelerated into the after-hours.

    Ironically, SPX missed tagging its SMA10, and even came up short of where the SMA10 would be after the close.  ES, however, tagged its newly minted SMA10 and has bounced back to within 0.50 of its all-time highs as VIX threatens another index-boosting breakdown.

    One might think it’s off to the races again, but oil and gas are signaling continued losses and the yield curve has taken another step in a bearish direction. Stay frosty.

    continued for members(more…)

  • Update on Oil & Gas: Jan 23, 2020

    ES is well on its way to our initial downside target, aided largely by the reversal we have been expecting in oil and gas. EIA inventory data is due out at 11:00 ET this morning, which should confirm what the charts have indicated for months: the YoY price change was inconsistent with the inflation and interest rate outcome that both the administration and central bankers desperately need.

    In goal-seeking markets, understanding this dynamic is more important than playing guessing games with inventory data. Unfortunately for equities, the free ride they’ve enjoyed on the back of rising oil prices is set for at least a pause.

    continued for members(more…)

  • Be Careful What You Wish For

    About five weeks ago, when ES broke out of the channel it had inhabited since May 1, we noted that there were some very distinct upside targets which suddenly came into play.  From Just Two Things on Dec 16:In Fibonacci patterns, upside targets are something to which stocks can aspire.  But, they are also potential turning points.  So, what does it mean that ES just reached that important Fibonacci target at 3336.49?

    continued for members(more…)

  • Tests All Around

    Futures are off about 10 points this morning in a rare holiday weekend drop……due primarily to a big drop in oil, which failed to top its plunging SMA10 and, instead, tested its SMA200 for the fifth time in the past six sessions.  More importantly, it broke a trend line dating back to Oct 3.Unless it bounces back intraday, stocks will be facing serious headwinds which include USDJPY’s failure to complete the breakout it threatened last week.

    continued for members(more…)

  • A Meaningful Breakout?

    The Dow isn’t a great index to follow or to chart, except for the fact that it’s a great “tell” when it comes to the narrative being promoted.

    Yesterday, when faced with the option of reversing at the trend line (below, in red) which has touched off four previous downturns, it broke out instead — “telling” us that there is nothing but upside ahead.Note that this breakout follows November’s push above the neckline (dashed white line) — also on the fifth try.

    Neither of these would be possible, of course, without the President’s Working Group (Plunge Protection Team) which met on December 23, 2018 and, unfettered by public scrutiny or minutes, unleashed hell on VIX.

    Since then, VIX has been hammered at every obvious potential breakout point and many which fell short of obvious resistance.And, USDJPY continues to be very cooperative, rallying whenever needed. Will it matter that it has reached 5-year overhead resistance?As we always do when looking at breakouts, we’ll look at whether this one will hold.

    continued for members(more…)

  • Something’s Gotta Give

    The futures are all set to deposit SPX at our next upside target (3306.51) on the opening bell, meaning a potential pop and drop.  Caution is warranted, as a failure to push past resistance could presage a 7% drop.

    The algos are watching VIX’s plunges and CL’s bounce with interest, as something’s gotta give.

    continued for members(more…)

  • Charts I’m Watching: Jan 15, 2020

    Lots of interesting goings on in the market this morning.  A few random thoughts… Aramco is no doubt feeling lucky on the heels of its $4 billion additional raise, its final IPO tally totaling $29.4 billion given that OPEC just lowered estimates for crude demand in 2020. Funny how the timing worked out…  Meanwhile, BoA reported a 6% rise in EPS even though net income slumped 4% and net interest margin dropped to new all-time lows. The fact that it repurchased 9% of its outstanding shares probably had nothing to do with it.

    On the economic front Core PPI missed expectations, dropping to just 1.1% YoY – the lowest since August 2016 and the same level as kicked off the 2015-2016 correction.Futures, which had gradually recovered from its overnight lows, it back to a slight loss as we approach the opening bell.

    continued for members(more…)

  • CPI: Jan 14, 2020

    December 2019 headline CPI came in at 2.29% this morning, with a seasonally-adjusted drop from Nov 2019 coming in at -0.1%. This was based on a gas price YoY delta of +7.9%, well below the EIA’s own calculation of +9.10%.  Had 9.10% been used, headline CPI would have printed at over 2.5% and MoM would have printed a positive 0.1%-0.2%.

    The charts below show how much of an outlier December was.

    Seasonally adjusted, there’s nothing to worry about. Without the adjustments, however, we see that rising oil and gas prices are once again papering over the deflation that the current BLS goal-seeking reporting methodology would otherwise report. Had we seen another 10% YoY drop instead of a 9.1% rise in gas prices, headline CPI would have come in at a lethargic 1.6%.

    Without the BLS’s methodology, of course, inflation remains very much a problem. The chart below, courtesy of ShadowStats.com, shows what CPI would be if the methodology hadn’t been changed numerous times over the years.

    continued for members(more…)

  • Bonds: More Turmoil Ahead

    The YoY change in gas prices is highly correlated with CPI which, in turn, is highly correlated with interest rates. If December’s headline CPI (due out at 8:30 AM tomorrow) continues to track the YoY increase in gas prices, it could easily top 2.3-2.4%.

    What would the impact be on bond yields? And, how would stocks respond? The last time CPI topped 2.5% was in October 2018, marking the beginning of the 20% correction.

    continued for members…First, a quick look at futures this morning. ES is up 7.5 points, primarily on the new highs in USDJPY. Note that ES has already backtested its broken purple channel top…

    …but SPX has not yet done so.USDJPY is approaching important overhead resistance.A breakout would be quite significant. Remember, the BoJ had no problem letting the USDJPY break out in 2014 when oil/gas broke down. Inflation is much lower now.And, as we’ve discussed, a breakout in USDJPY might be necessary given the likely continued decline in oil/gas.

    More after the break. (more…)