Category: Charts I’m Watching

  • The Most Important Chart

    One of the more interesting price cycles I’ve worked on over the years is that of oil. Oil and gas have proven to be lucrative trading vehicles, and their price movements have been extremely helpful in forecasting interest rates, currencies and inflation.

    The most fascinating cycle I’ve discovered is the periodic peaks and crashes in WTI.  The chart below shows that important highs (highlighted) have occurred like clockwork.

    2003 – 2008:    1961 days
    2008 – 2013:    1874 days
    2013 – 2018:    1862 days

    The last three important lows have been just as consistent and illustrate the on-again, off-again correlation between oil prices and equities. [The strong, positive correlation was marred by a significant divergence between June 2014 – Mar 2015.]

    The chart begs some very important questions: will the cycle continue and, if so, will equities follow suit?

    2001 – 2009:    2614 days
    2009 – 2016:    2583 days
    2016 –  ???

    In my opinion, this is the most important chart to watch over the next year or two.

    continued for members(more…)

  • Merry Christmas

    Wishing everyone a very, Merry Christmas and a New Year of peace and prosperity.

  • Do You Hear What I Hear?

    The fourth of December’s five gasoline price readings hit EIA’s website yesterday. The average stands at 2.47, 9.1% above 2018’s December reading.  Unless another large component of CPI takes a nosedive this month, CPI could top 2.3 or even 2.5%.  This is a level not seen since Oct 2018 (the shaded area below) when the 10Y averaged 3.15%.  It’s currently at 1.95%, so something is clearly out of sync.The Fed has been saying they’re going to allow inflation to run a little hot.  And, it has, with Core CPI running 2.3-2.4% since August. The 10Y has responded, rallying from 1.43% in September to its current 1.95%.

    All year long, YoY declines in oil and gas prices have kept headline CPI below 2%.  It finally crept above 2% in November.  December will represent a very substantial departure, with a YoY increase adding to rather than throttling back Core CPI.  Is the bond market ready?  Are investors listening?

    continued for members(more…)

  • Anyone Home?

    Traders have disappeared from sight this morning.  Volume is about as low as it could be, despite a big miss (which didn’t even make the front page of CNBC.com) in Durable Goods new orders: -2.0% vs +1.2% expected.  YoY, the drop was 5.7%, the worst since Jul 2016.

    Futures plunged all of 4 points which, of course, sent VIX to the rescue with a compensating plunge.

    continued for members(more…)

  • Charts I’m Watching: Dec 20, 2019

    One of the market’s favorite tricks is to close right below resistance and blow through it the following morning on the “strength” of the overnight ramp in the futures.  SPX came within 0.67 of our next upside target yesterday, suggesting a potential downturn, but will blow right through it on the open.  This morning’s ramp job is brought to you by VIX which, despite not making lower lows, has timed its daily collapse perfectly.

    The only downside of such maneuvers is that they frequently result in a “pop and drop” – where stocks backfill the newly created gap. It’s a source of irritation to those who bought the open.

    continued for members(more…)

  • Houston, We Have a Problem

    No, I’m not talking about Philly Fed Index, which at 0.3 versus 8.0 expected and 10.4 prior, is really stinking up the joint.

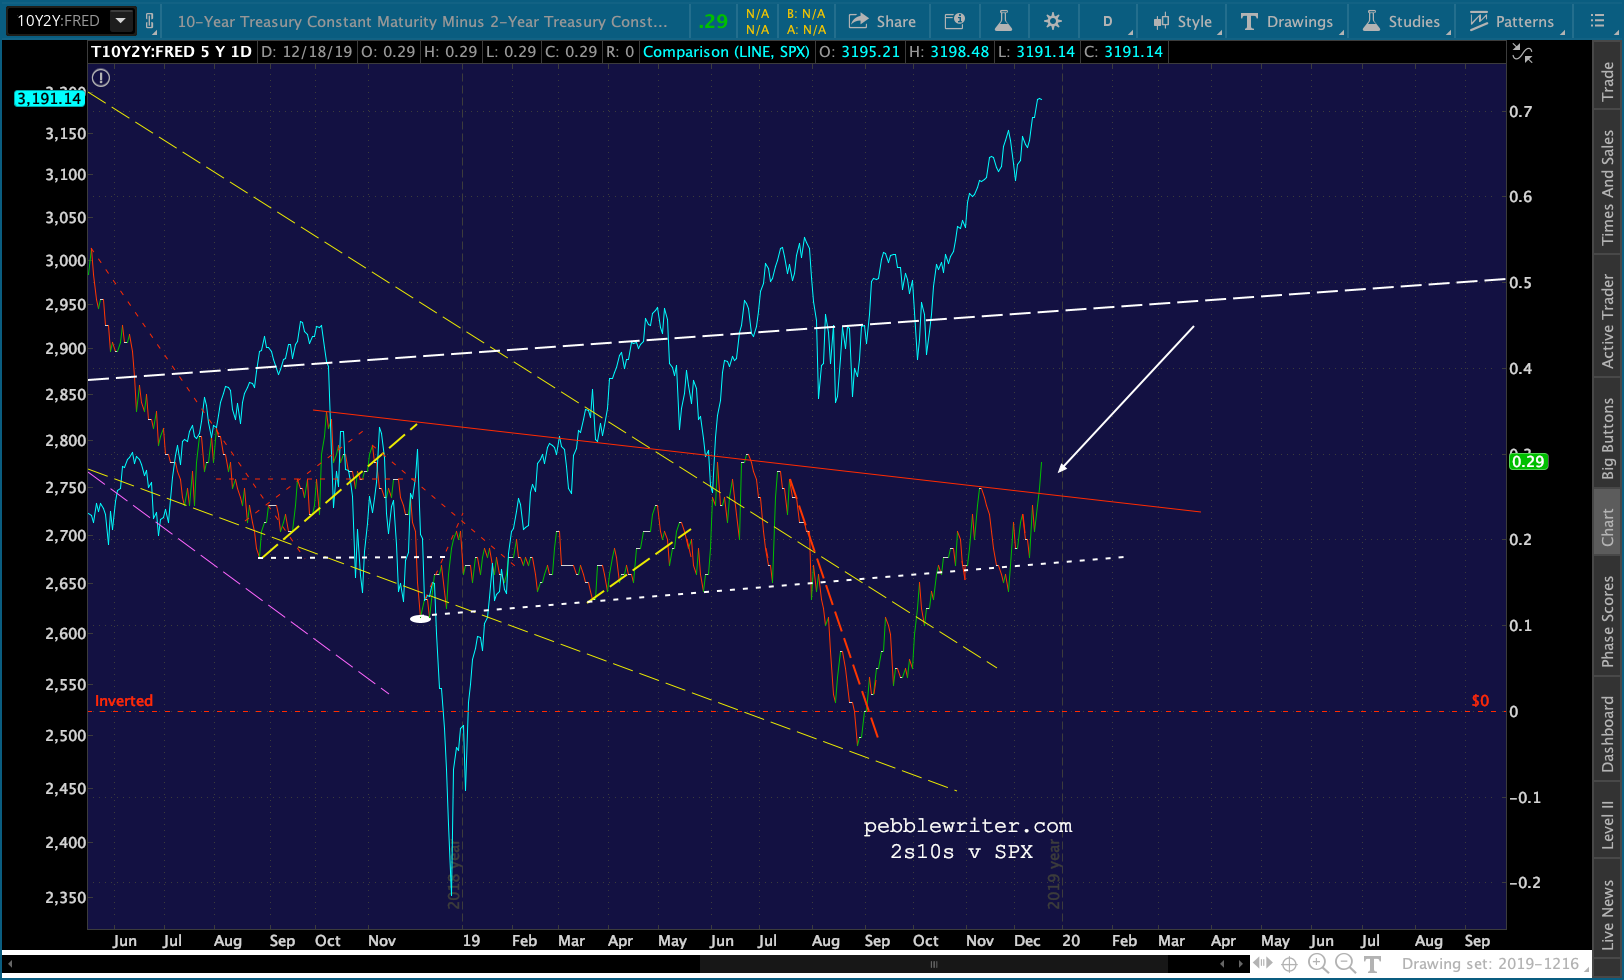
    instead, I’m talking about the 2s10s breakout which, as we’ve discussed countless times in the past, spells serious trouble for equity markets. This is exactly the scenario we discussed earlier this week and is a direct result of the brewing inflation problem which is also not being discussed in polite company.continued for members(more…)

  • The Snoozefest Continues

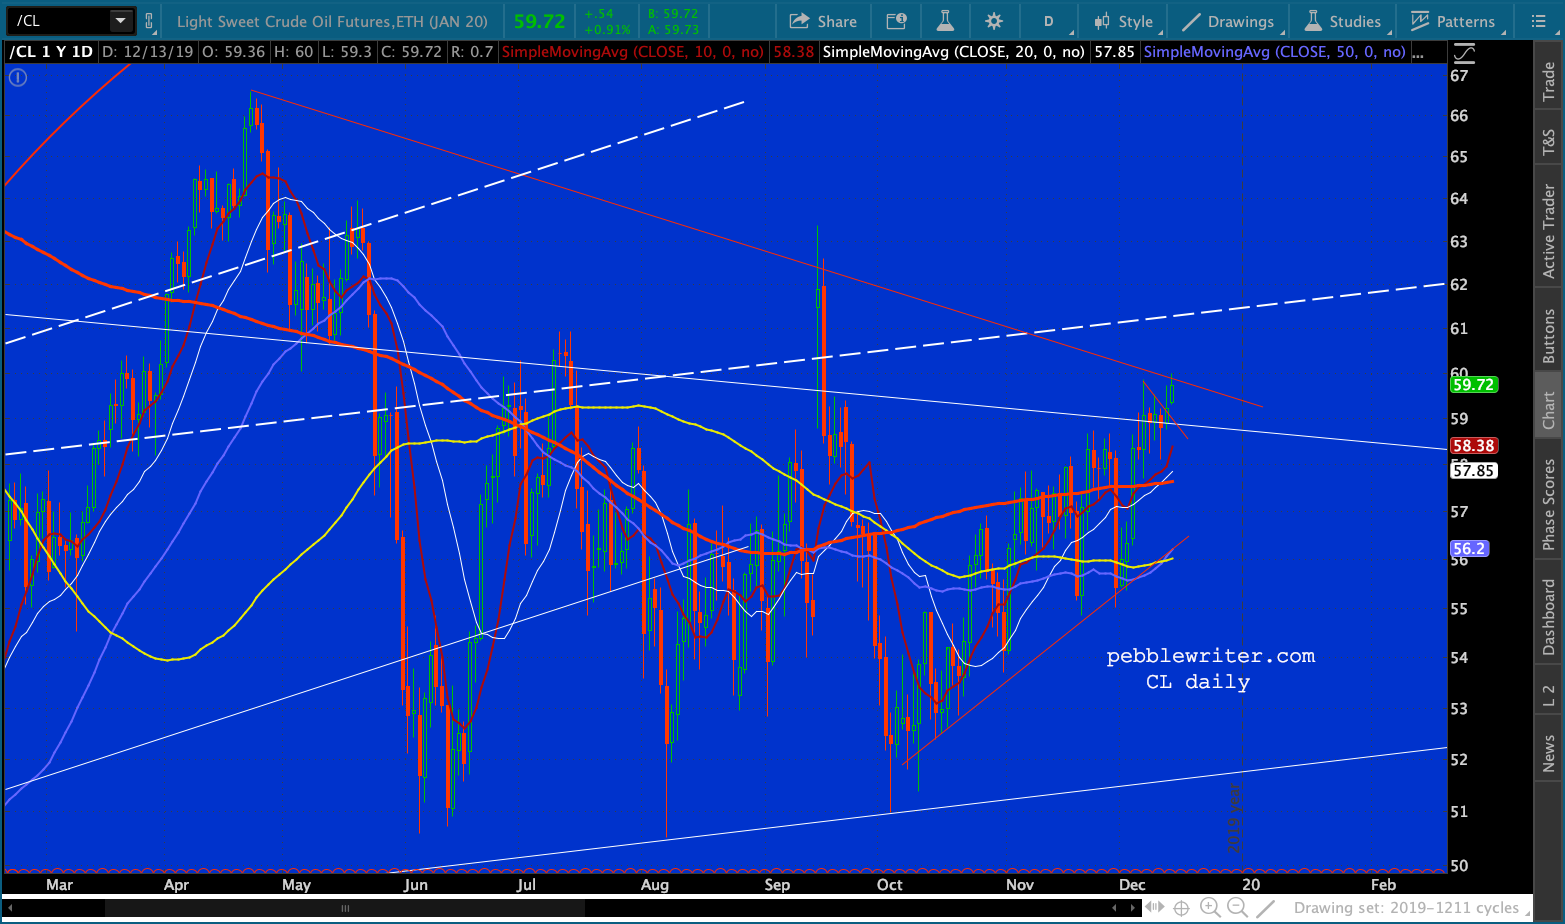
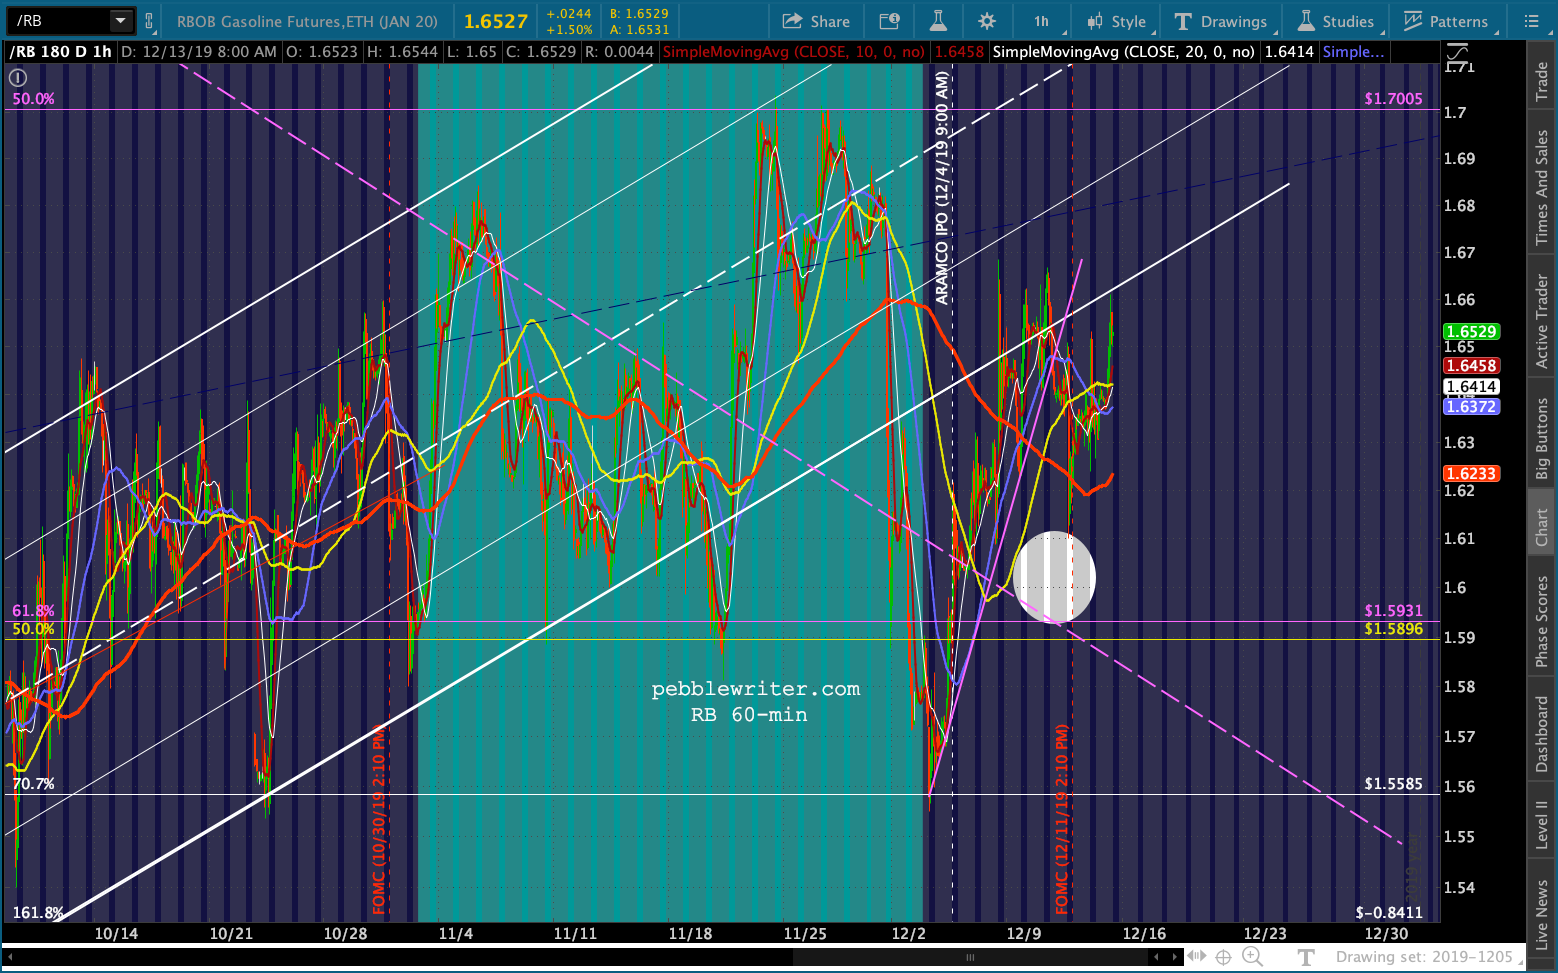
    All the bullish factors which have kept stocks aloft the past two sessions are still going at it.  Hence, the futures’ snoozefest even as Trump is about to be impeached.The only potential fly in the ointment remains oil and gas, which have reached an important decision point.

    continued for members(more…)

  • The Bullish Case

    I spend a lot of time and energy trying to spot potential downturns.  I think the average buy-and-hold investor needs to know when downside risk is elevated and when events occur that could trigger a substantial drop.  Even when things are apparently going well, I always post support levels just in case.  While there’s a cost to missing the best rallies, there’s also a cost to getting caught in the biggest plunges.

    Traders, of course, see big downside plunges as potential opportunities. Whether they short the market or merely step aside, turning points are vitally important to their success.  This leads us to the current setup.

    Stocks broke out of a falling channel two months ago when Trump held a big press conference in the Oval Office to announce the Phase One deal (it wasn’t) with China [see: Melting Up.]  Since then, the market has been, well, melting up — paying little attention to overhead resistance and making higher highs seemingly every other day.

    The rising red channel above ran into the top of the (less aggressively) rising purple channel  on Nov 19.  It wasn’t until Dec 12 that it finally punched through – a breakout which leads to 3300 by year-end.  In the process, it reached our ES 3175 target well ahead of schedule.

    The downside risks certainly haven’t gone away. From all appearances, though, they have been back-burnered for the remainder of 2019 – 10 more sessions.  We’ll review our upside targets and see if we can spot any potential bumps in the road.

    continued for members(more…)

  • Just Two Things

    The first is that VIX has again been hammered below a trend line dating back to Nov 2017.  The algos are all over this and futures have soared 17 points. Total capitulation, at least for the time being.The second is that gas prices remain stubbornly high – signaling a coming spike in inflation unless prices tank in the next two weeks.  The YoY delta has soared over the last two months, with December’s delta at about +10%. Hardly anyone is talking about this — at least publicly. I suspect the Fed is talking about it quite a bit behind closed doors.continued for members(more…)

  • Let’s Not…and Say We Did

    Remember the Oval Office celebration for the Phase One “deal” on Oct 11? [see: Good…Easy to Win.]  Apparently being impeached turns up the heat a bit, because Trump now insists we’re really, really close to the deal that was ostensibly reached two months (and 240 SPX points) ago.  Unfortunately, it takes two to tango. From this morning’s WSJ:

    BEIJING—China indicated that a near-term trade agreement with the U.S. has yet to be completed despite President Trump’s signoff, highlighting the unpredictability of a negotiation process that has rattled global markets and businesses.

    Trump on Thursday approved a so-called phase-one trade pact that will scale back existing tariffs on Chinese imports and eliminate new levies scheduled to take effect on Sunday, in exchange for a written pledge from Beijing to buy tens of billions of dollars worth of U.S. farm products, among other concessions.

    While Mr. Trump was “upbeat and enthusiastic about this breakthrough,” in the words of Michael Pillsbury, an adviser to the president during the trade talks, the mood in Beijing has been decidedly more sober.

    Algos, ardent believers in the President’s truthfulness, have sent futures 40 points higher on the “news” – aided by a Fed which is throwing $500 billion in not-QE at the markets.
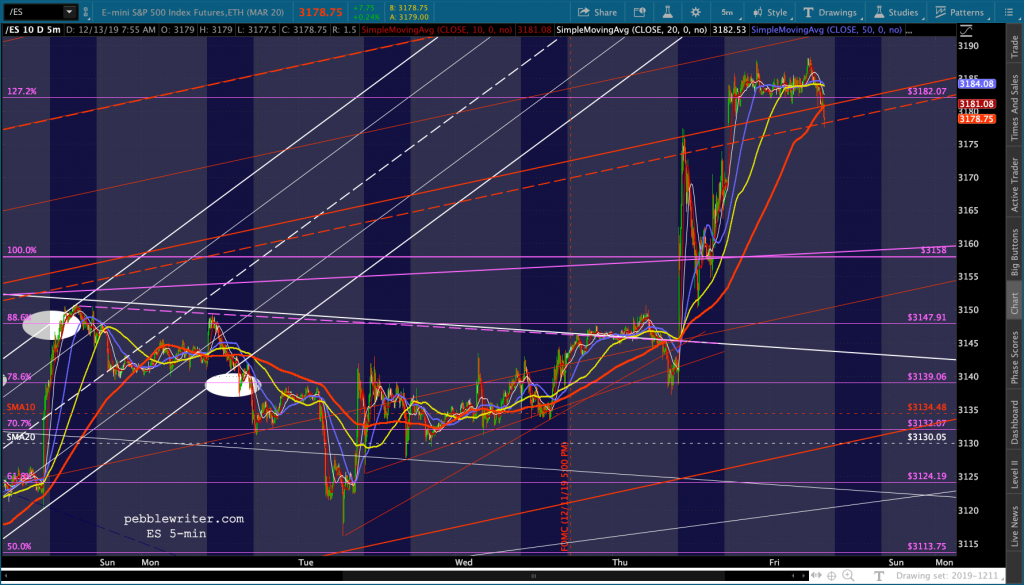
    There are still a few of us carbon-based chartists who, having seen this game played eleventy billion times before, are a bit more skeptical.

    continued for members

    The pop has primarily been aided by VIX taking a dive……and USDJPY and CL pushing higher.

    For its part, RB is higher but still backtesting the broken white channel. This leaves SPX “broken out” again – an uncomfortable place to be for bears — even though the last breakout failed, initially shedding 84 points.

    As we’ve discussed, everything remains in place to “save” the market as often as necessary — as long as there isn’t a full-on panic. The line in the sand remains ES’ SMA10 now at 3134 (it turned up again after starting to roll over yesterday.)

    This remains a dangerous market to short – especially with the weekend upon us.  I see that China just issued a statement that they will hold a press conference “sometime on Friday.”

    I’ll be on the road until about 1pm this afternoon, will catch up on things at that time.  GLTA.