ES is well on its way to our initial downside target, aided largely by the reversal we have been expecting in oil and gas. EIA inventory data is due out at 11:00 ET this morning, which should confirm what the charts have indicated for months: the YoY price change was inconsistent with the inflation and interest rate outcome that both the administration and central bankers desperately need.
 In goal-seeking markets, understanding this dynamic is more important than playing guessing games with inventory data. Unfortunately for equities, the free ride they’ve enjoyed on the back of rising oil prices is set for at least a pause.
continued for members…
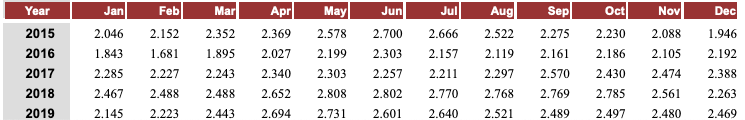
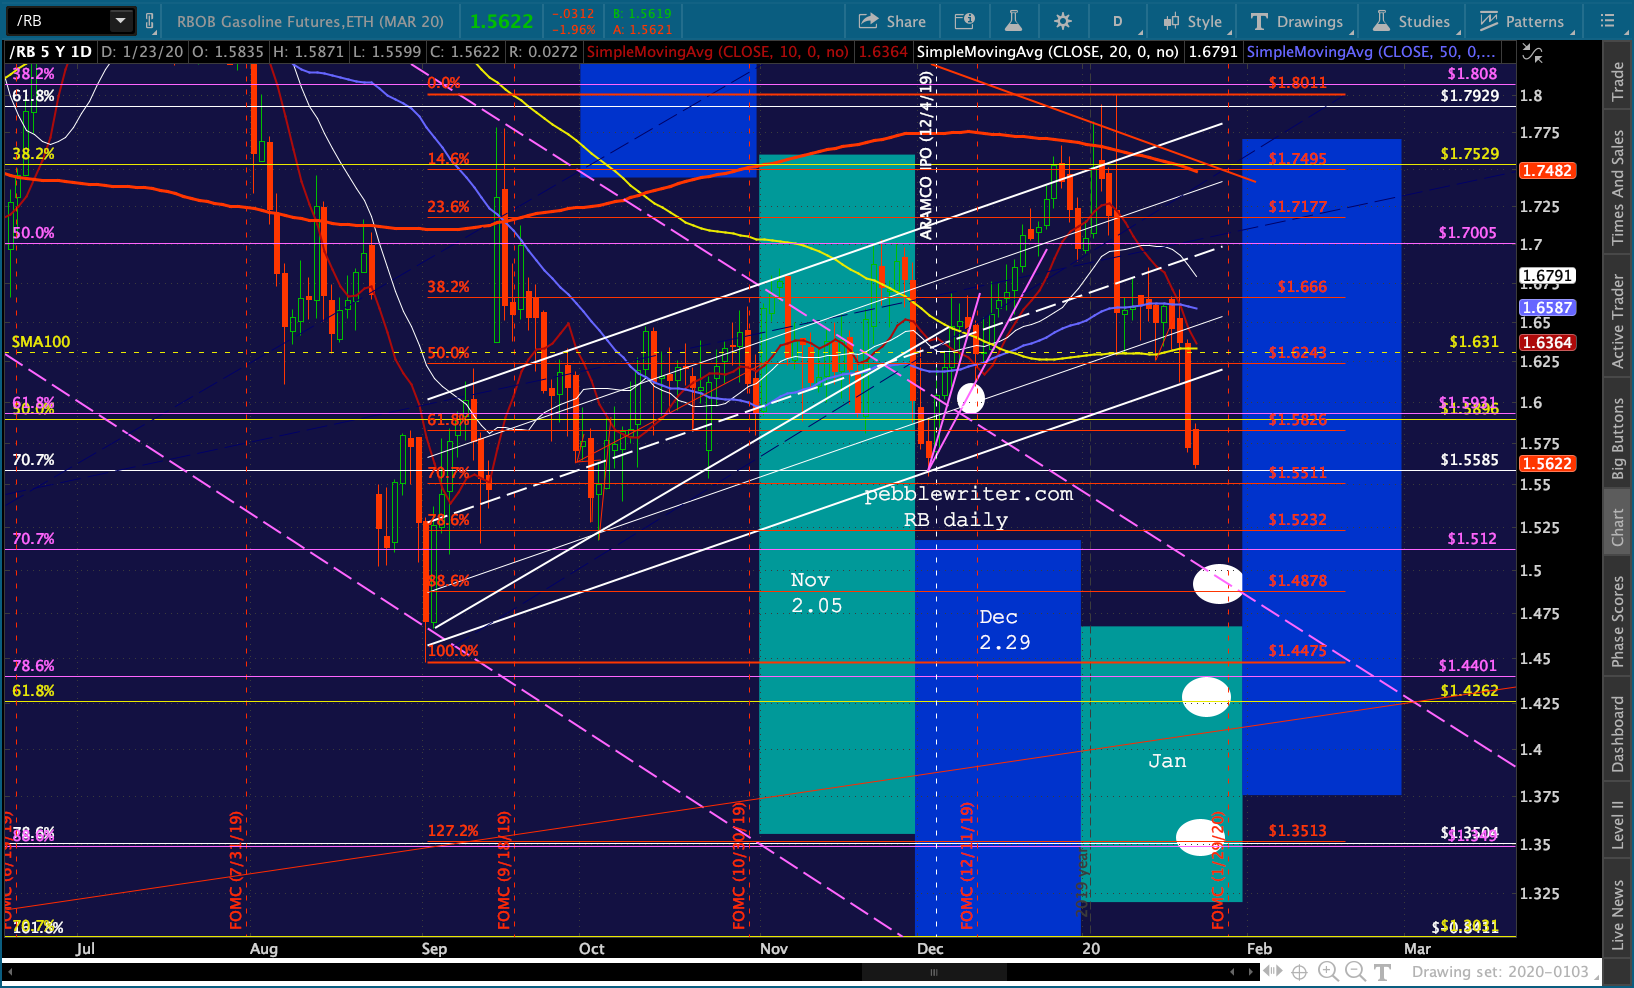 As we discussed yesterday, AAA is currently reporting a 12.8% YoY gain in gasoline prices, GasBuddy a 13.4% gain. According to the EIA, the three week average for January is 2.474. This would be a 15.4% increase over Jan 2019’s 2.145.
There is one more data point to be collected on Jan 27, so the bigger the drop between now and then, the better the odds of holding CPI to 2.3% or less. Recall that BLS reported a 7.9% gain for December – well below EIA’s 9.1%.
The risk in the short oil/gas trade is that the YoY comps are about to get much easier. The Feb 2019 range in RBOB was quite large, but the YoY increase drops to 11.29% at current prices. In March, the YoY comp would drop to a 1.27% increase at current prices.
 So, if RB and gas prices simply stay put, the CPI problem would diminish some in February and go away by March. At that point, of course, the markets would have to recognize that it is elevated oil and gas prices which have provided the greatest boost to inflation which would otherwise (at least according to the way it’s calculated) be alarmingly low.
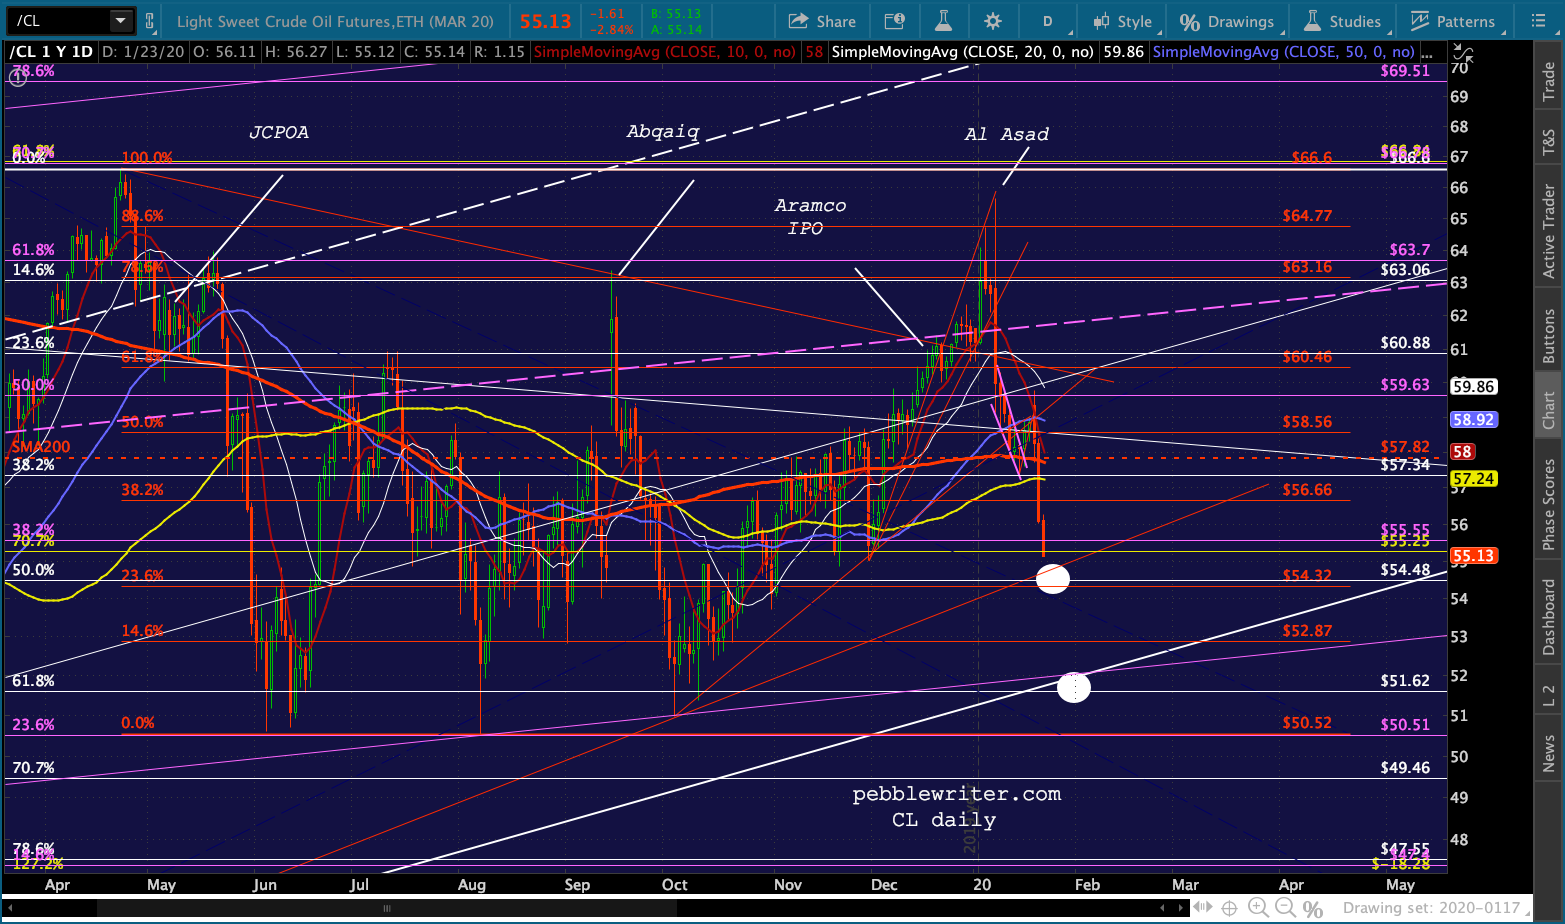
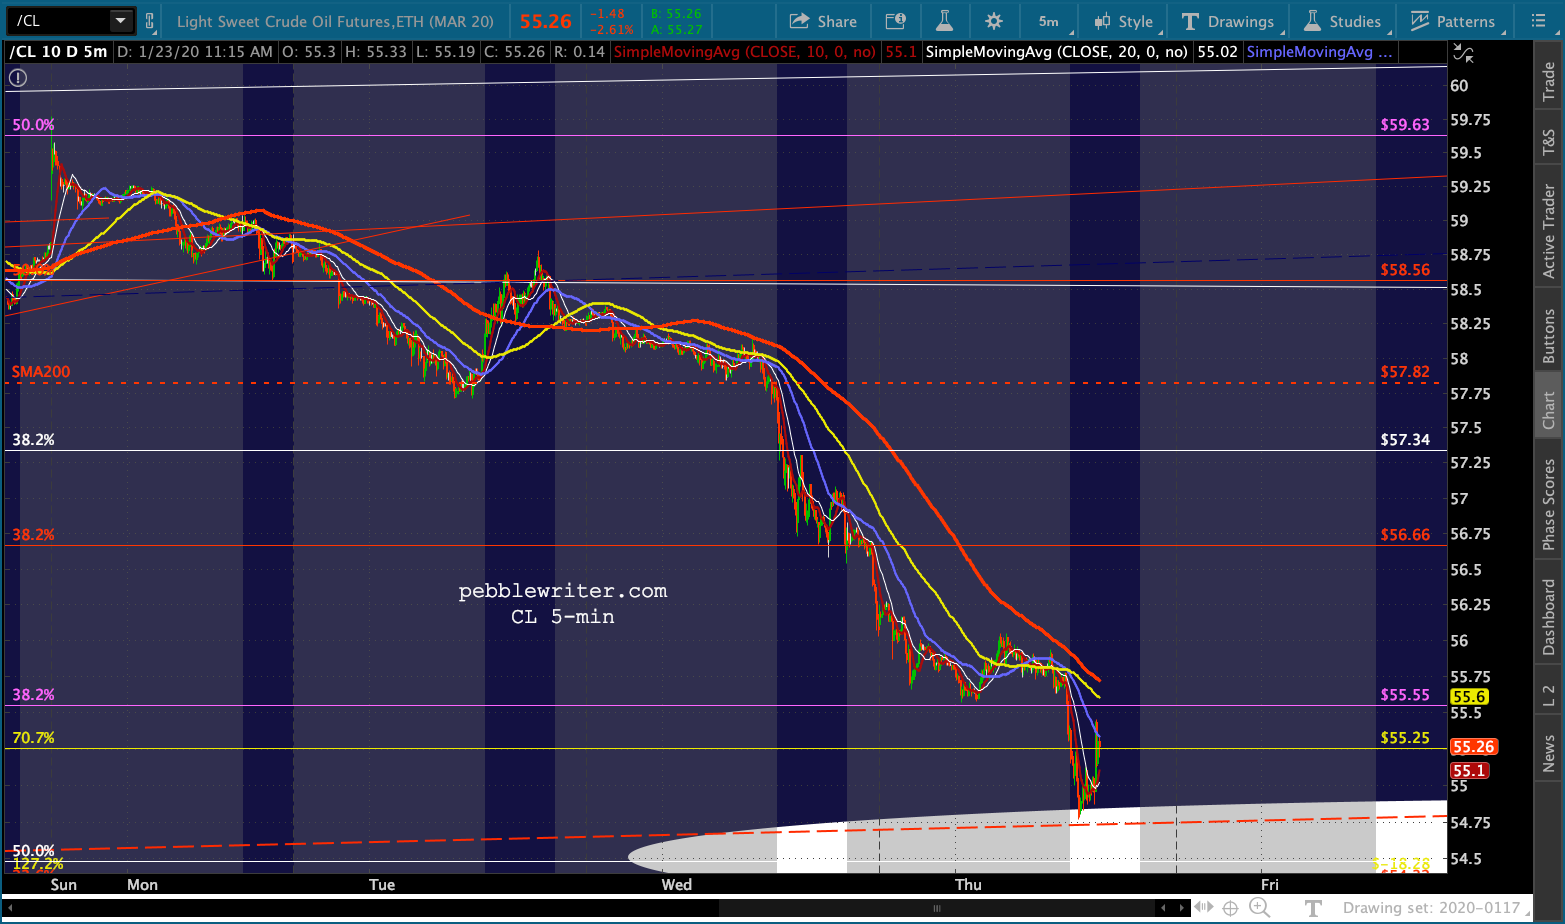
At 54.77ish, CL runs into a trend line from the Dec 2018 lows.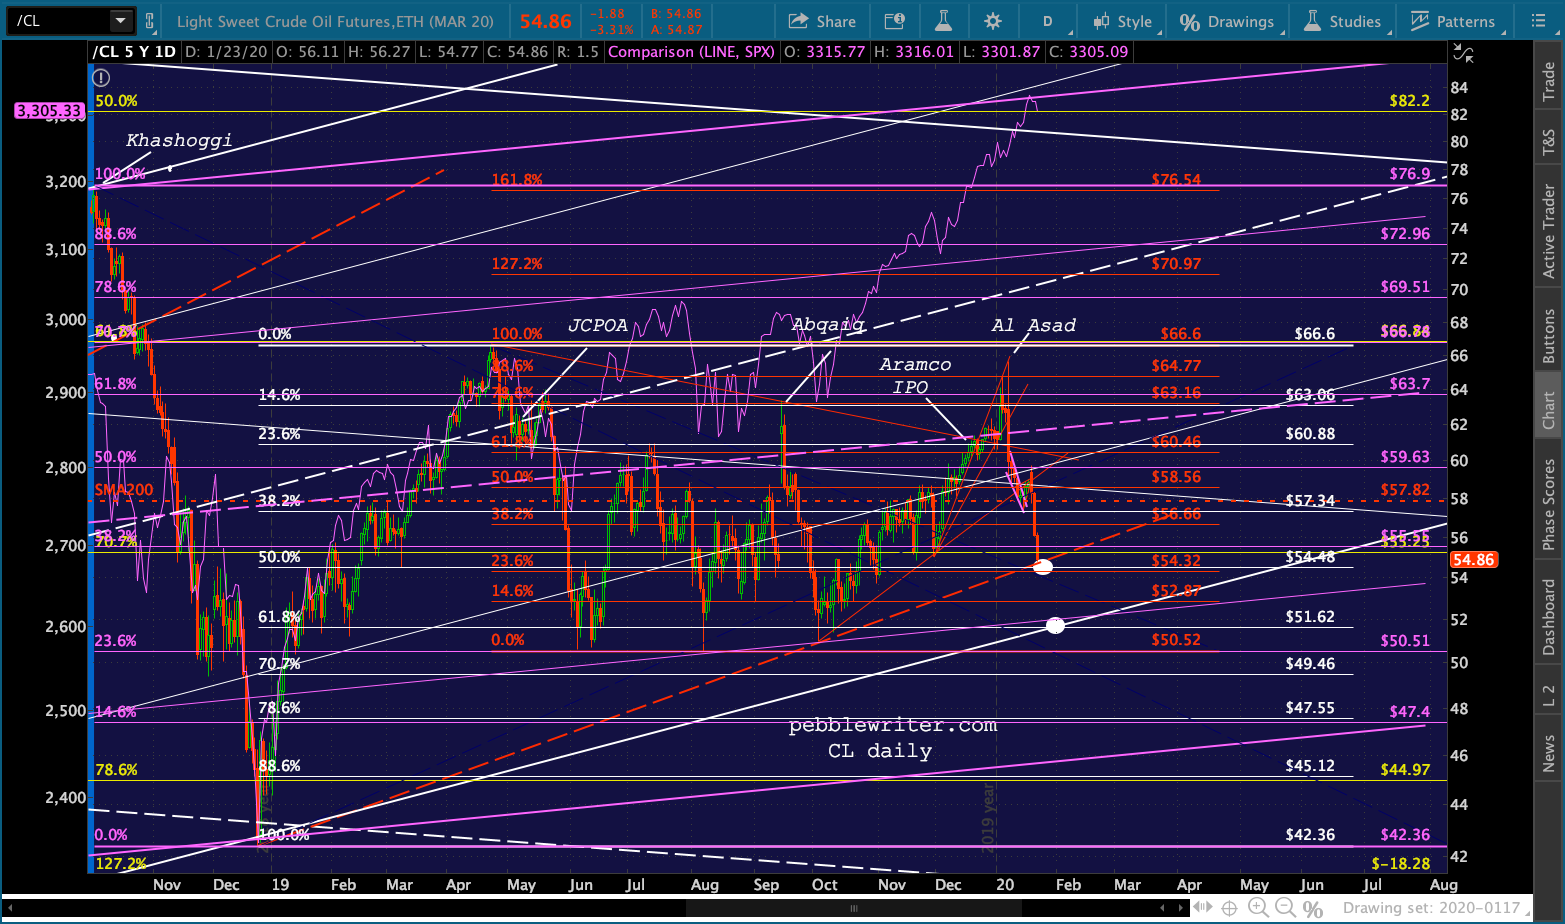 But, the bigger prize for bears would be a test of the white channel bottom around 51.62. Noe this is also the white .618 retracement of the gains from Dec 2018 and would tag the same channel line as the Aug and Oct 2019 lows.
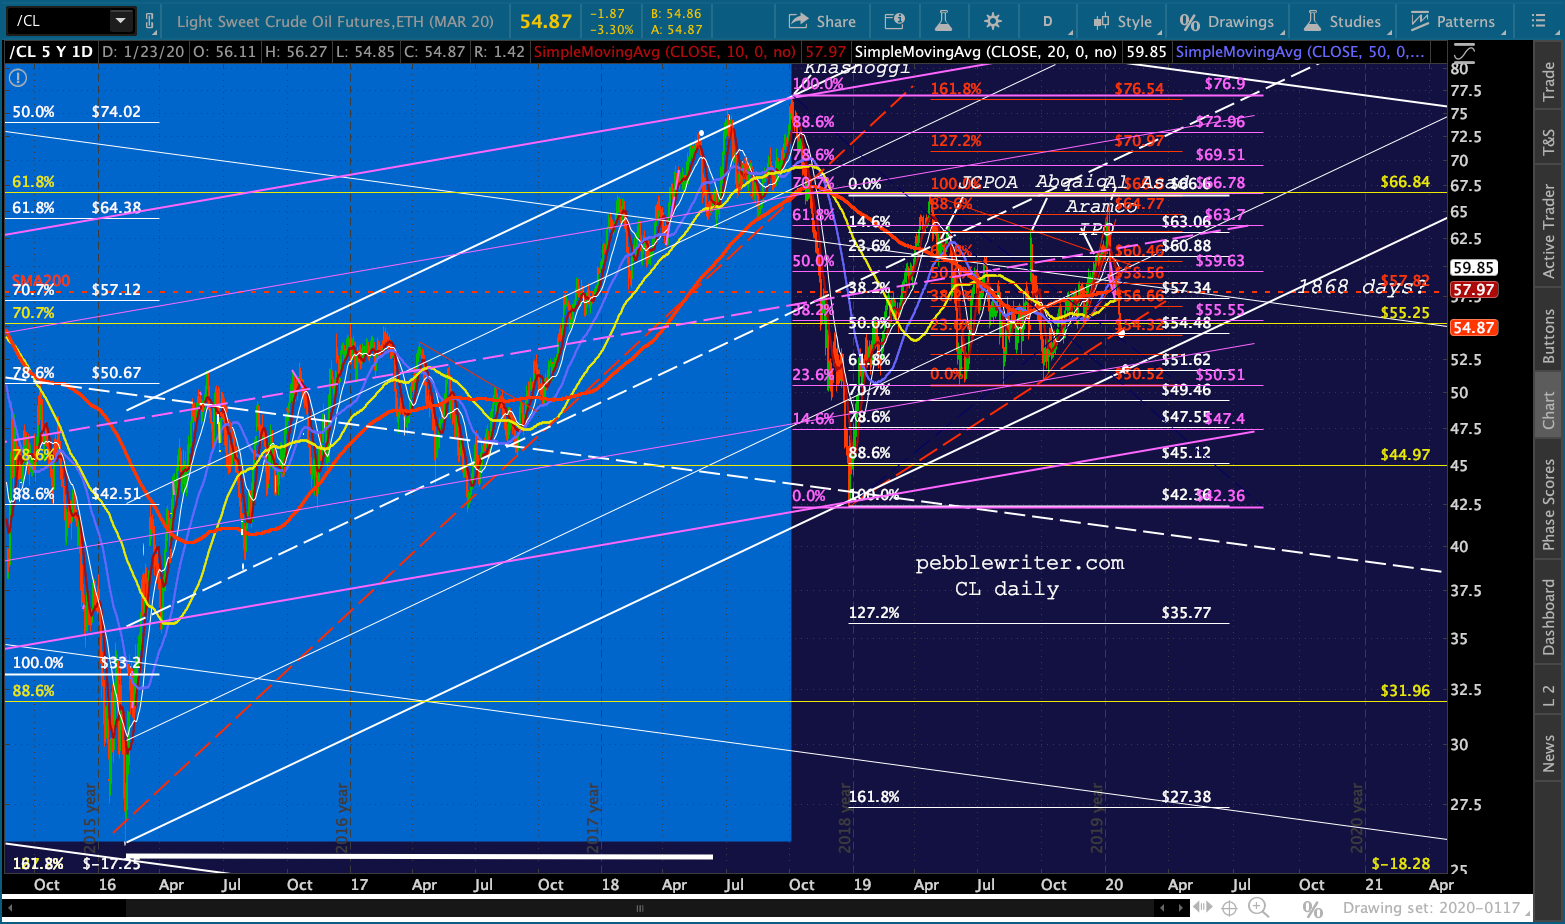
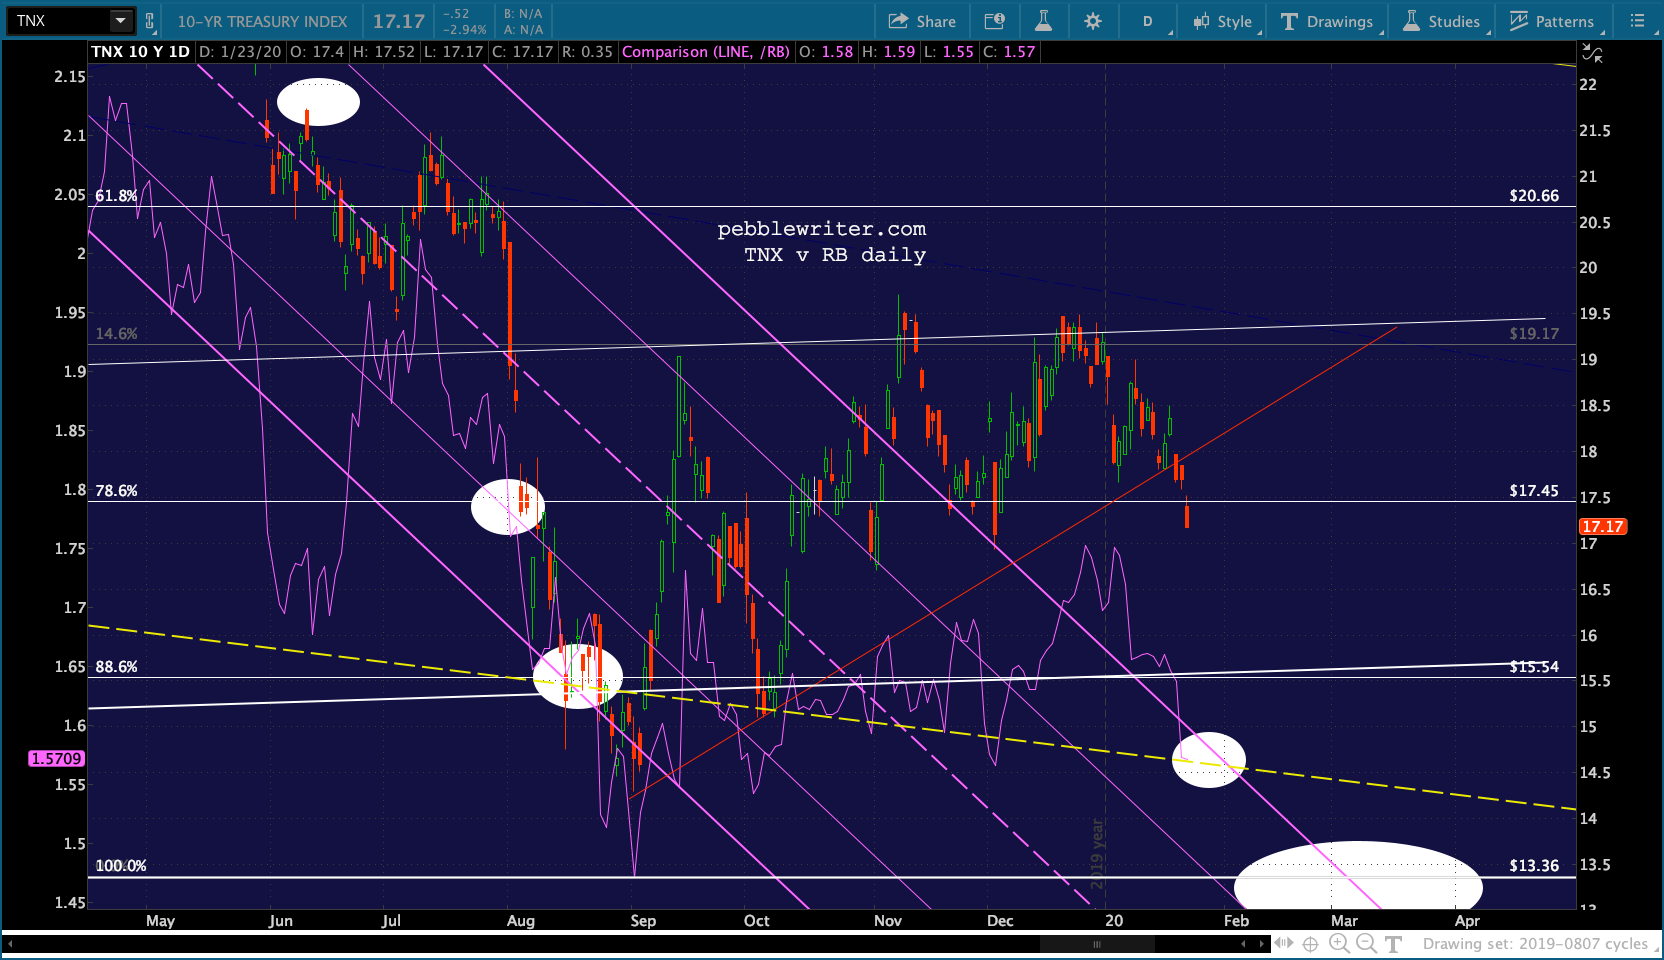
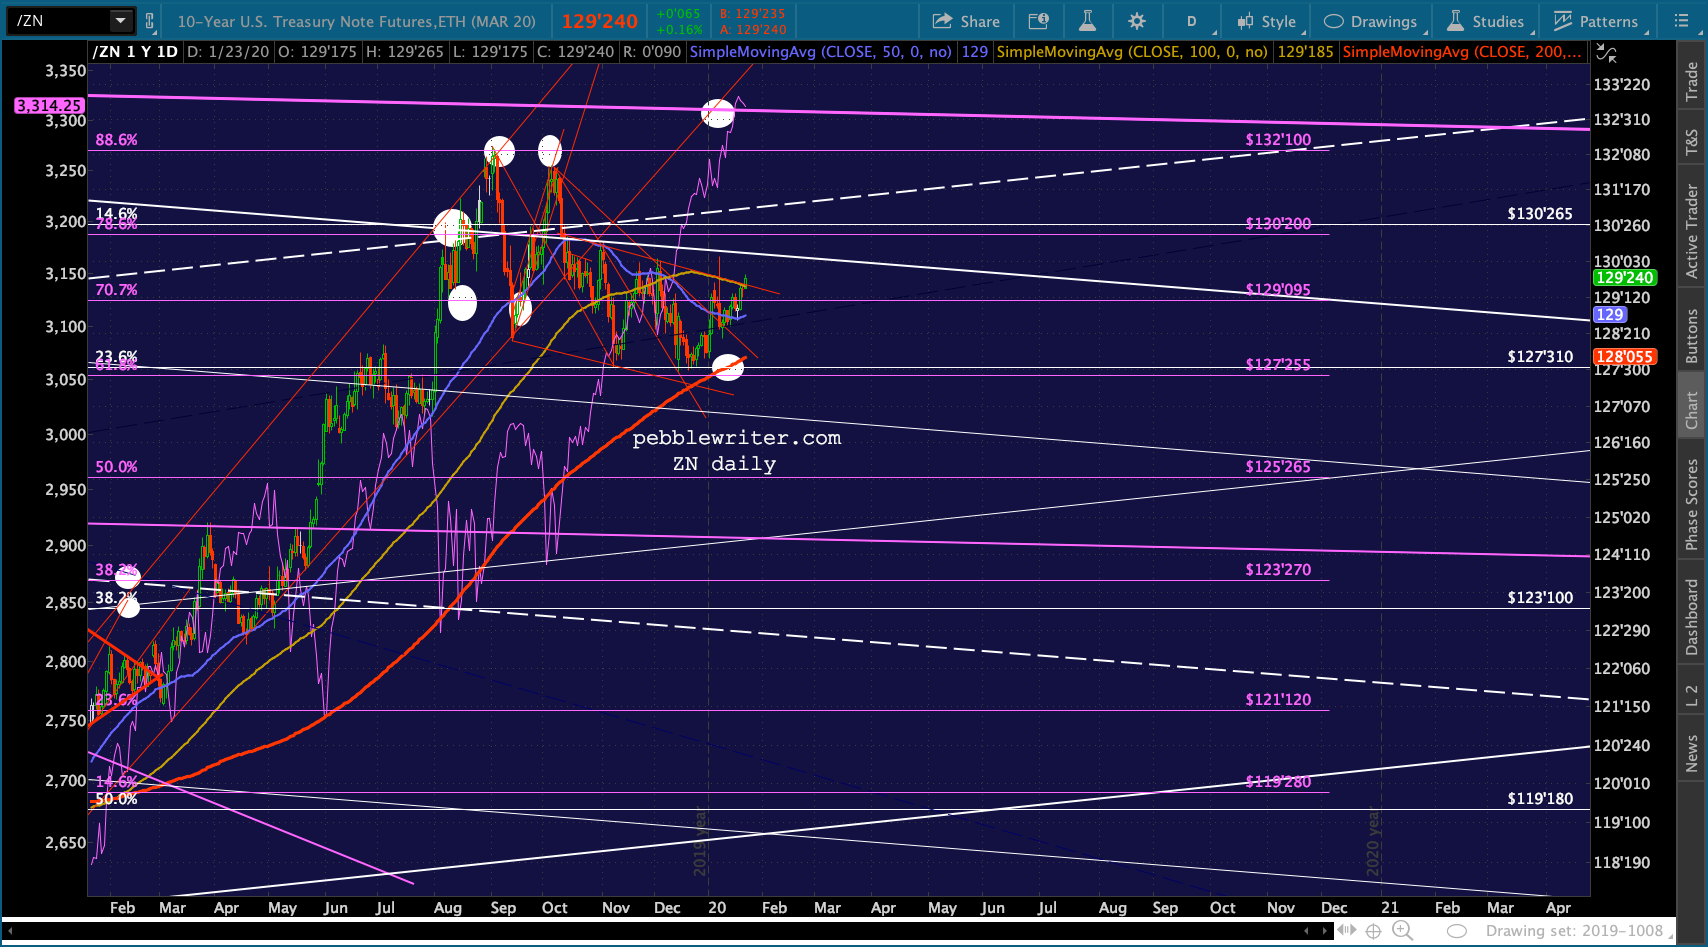
TNX is finally reading the tea leaves and has broken trend. As CPI is moderated by falling oil/gas, there is less reason for rates to remain elevated. Note that ZN is also breaking out.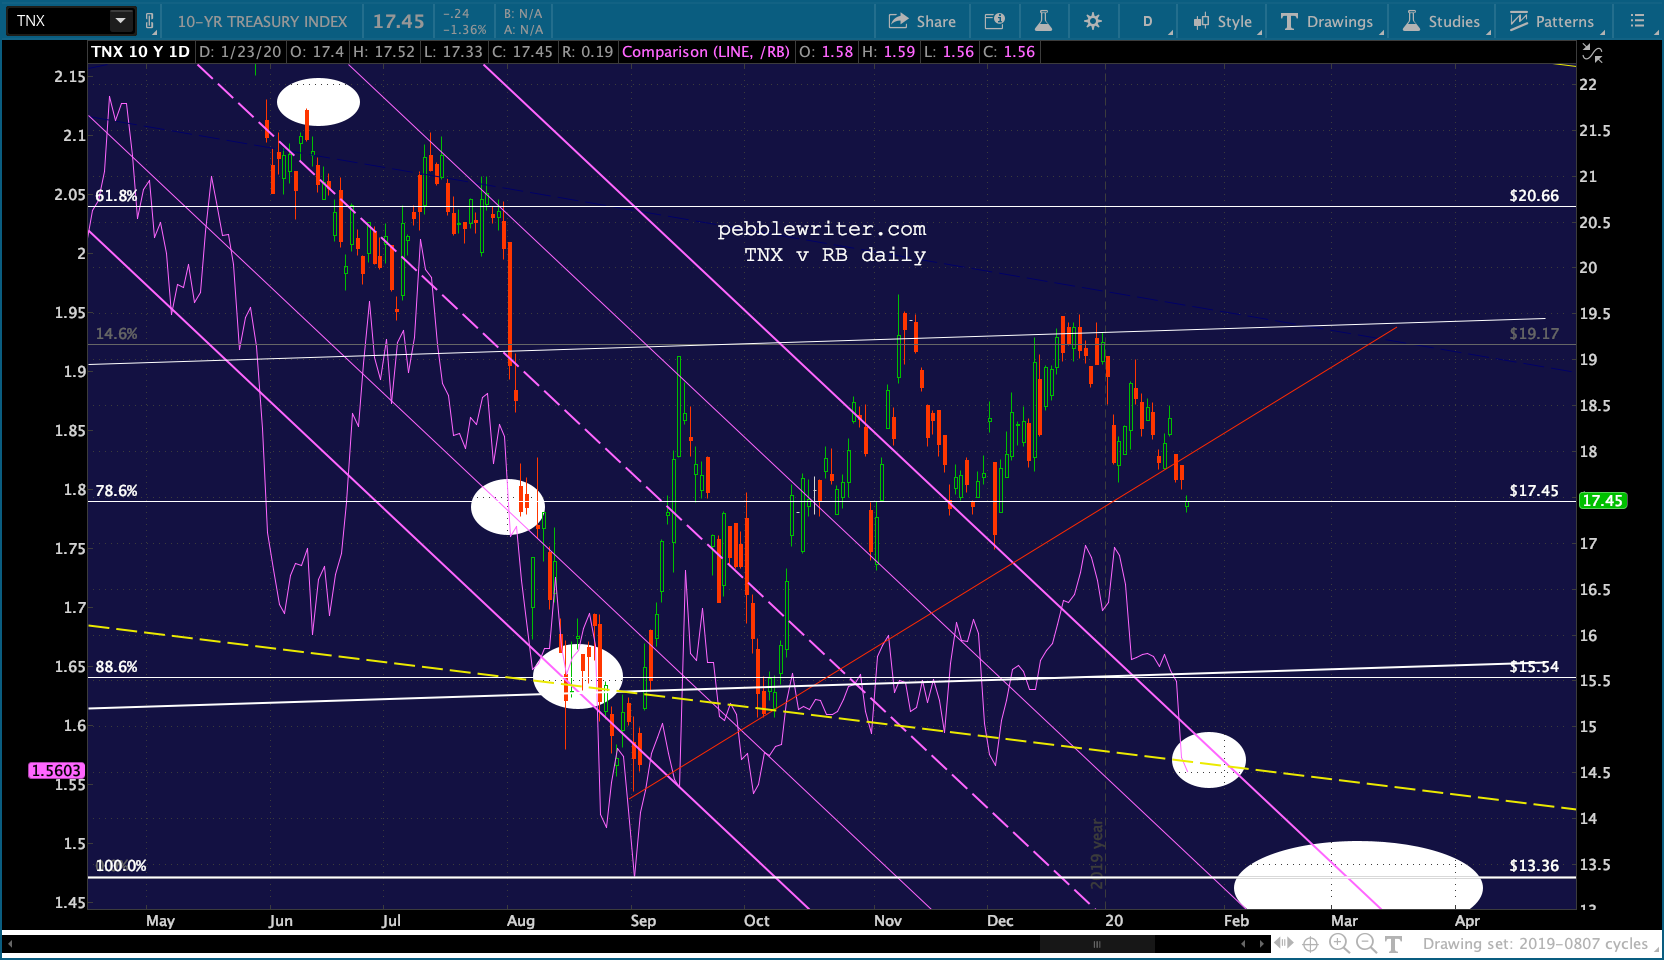
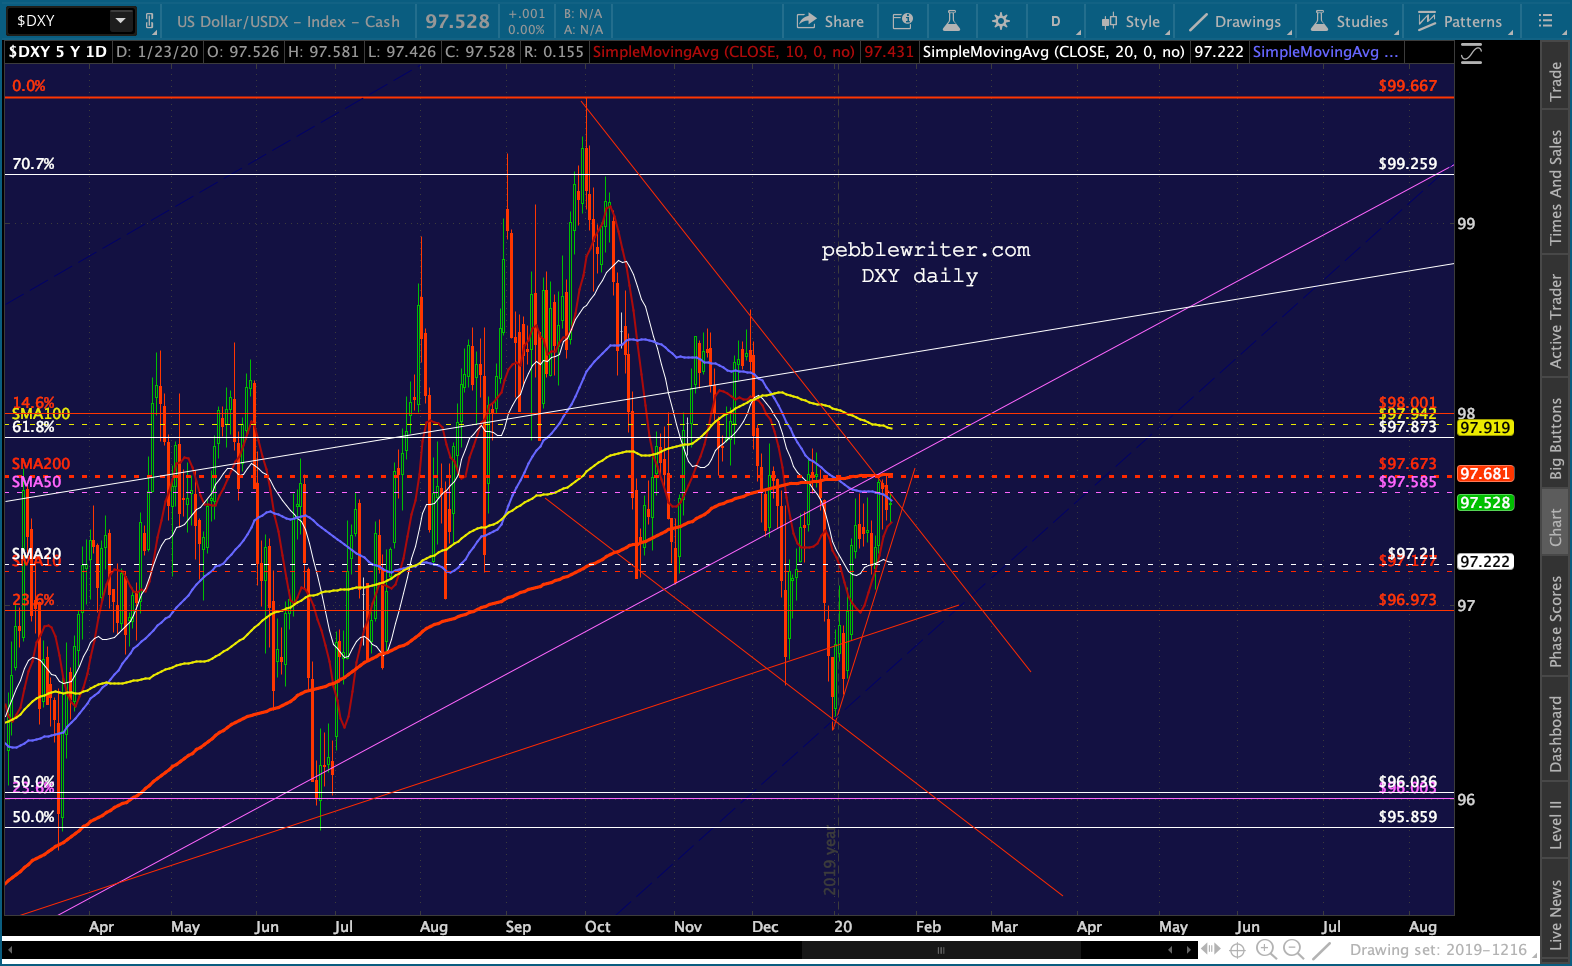
 The dollar would be selling off if not for its continued buoyancy against the euro.
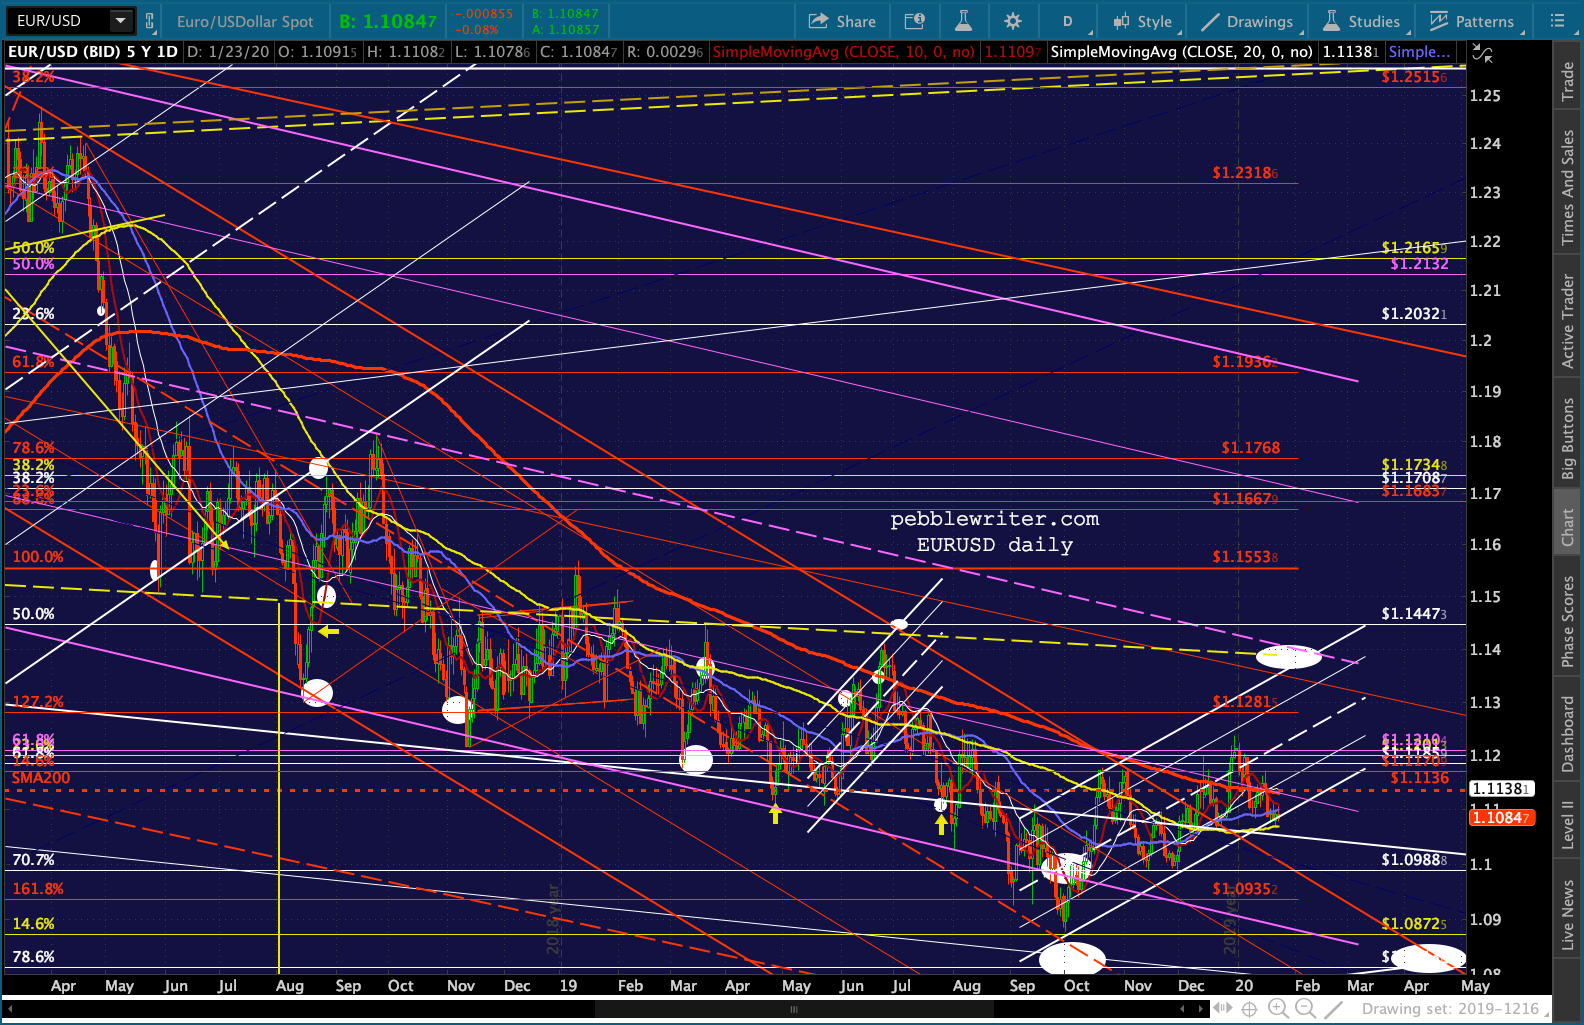 If USDJPY continues to settle lower, though, this could change in a heartbeat – further accelerating equities losses.
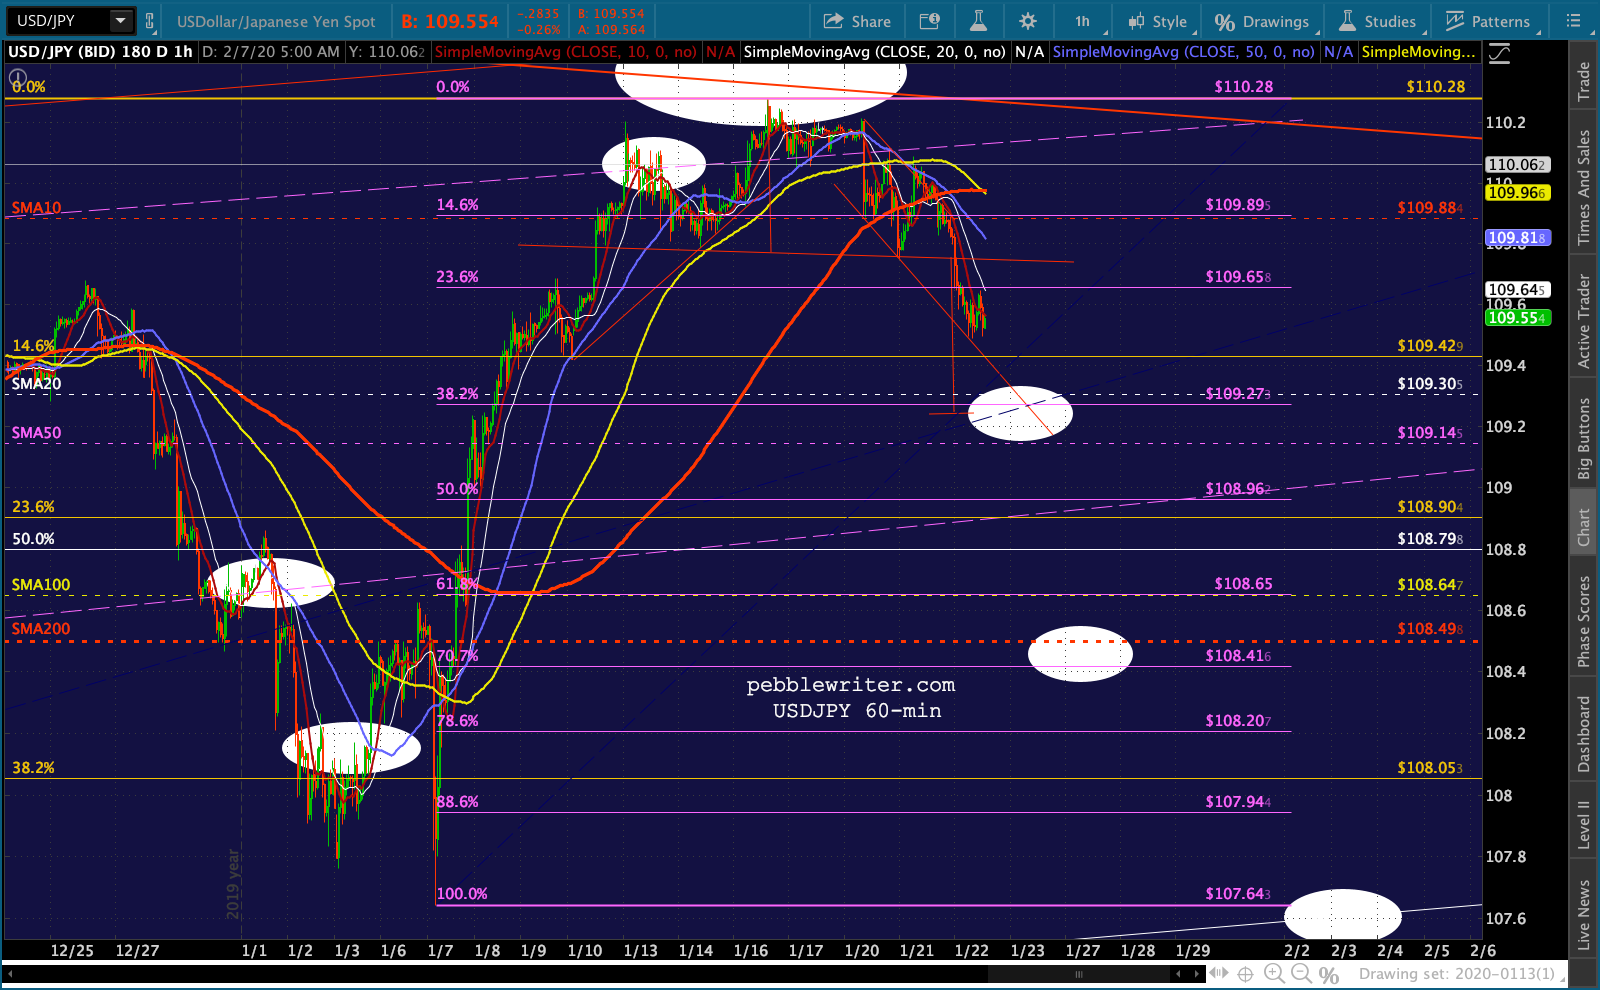
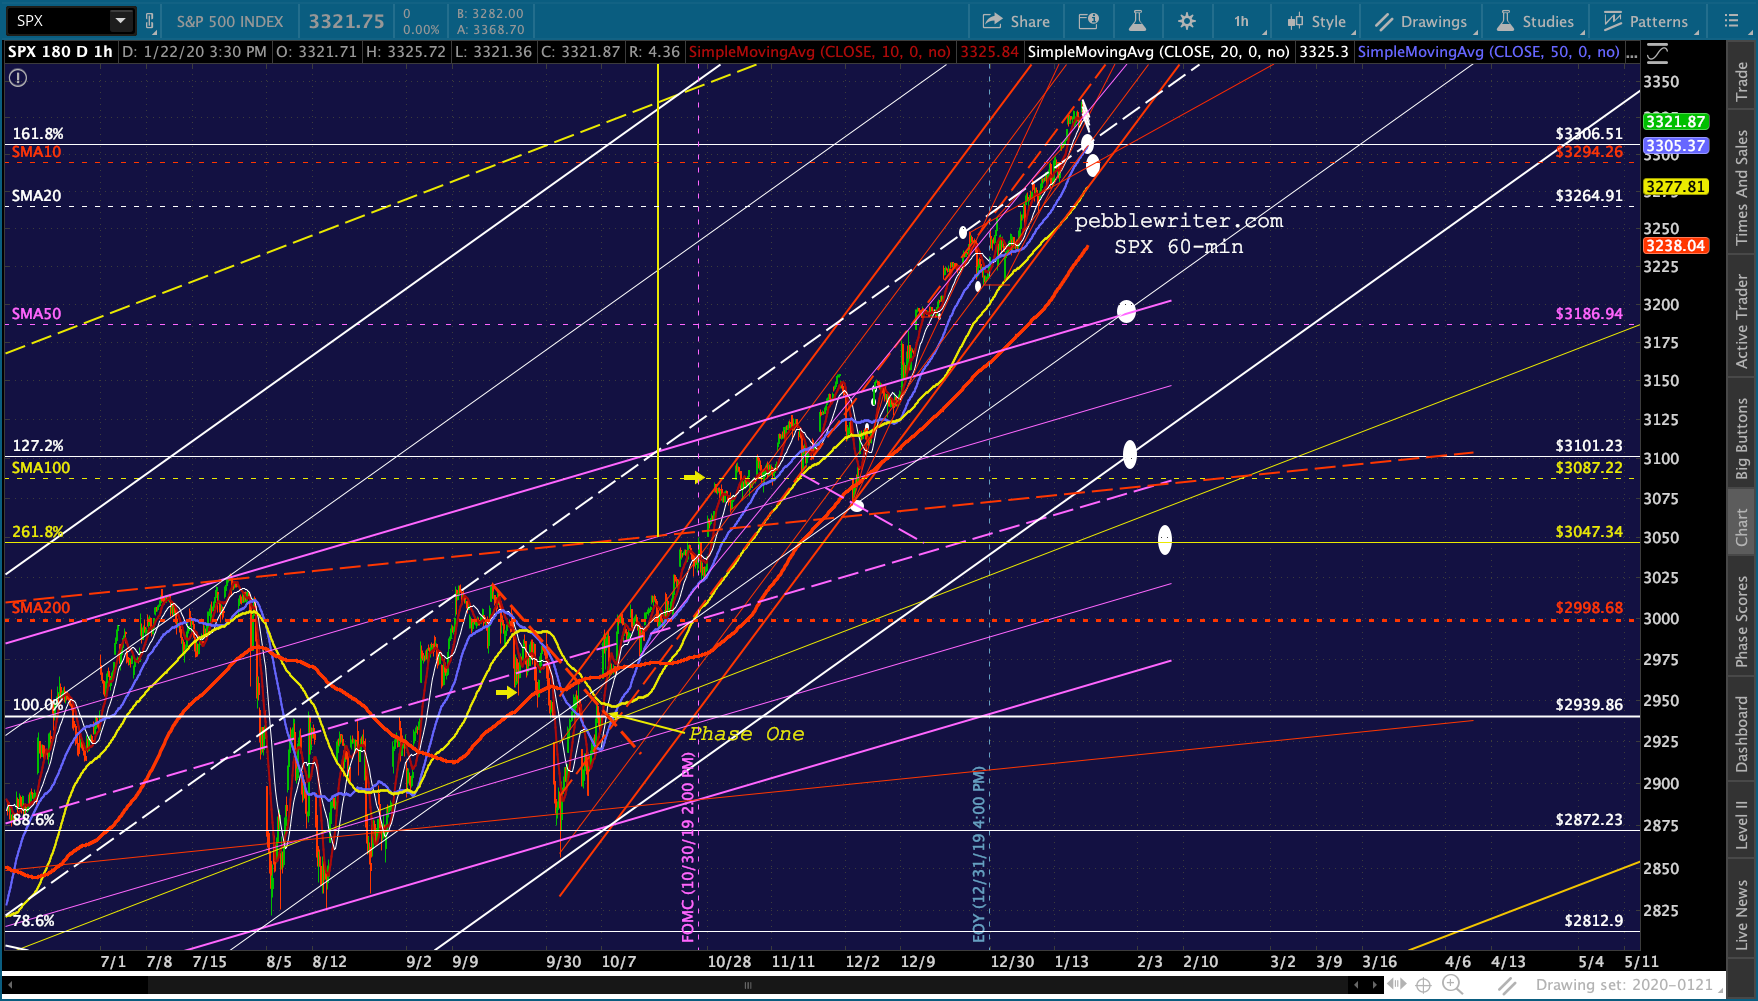
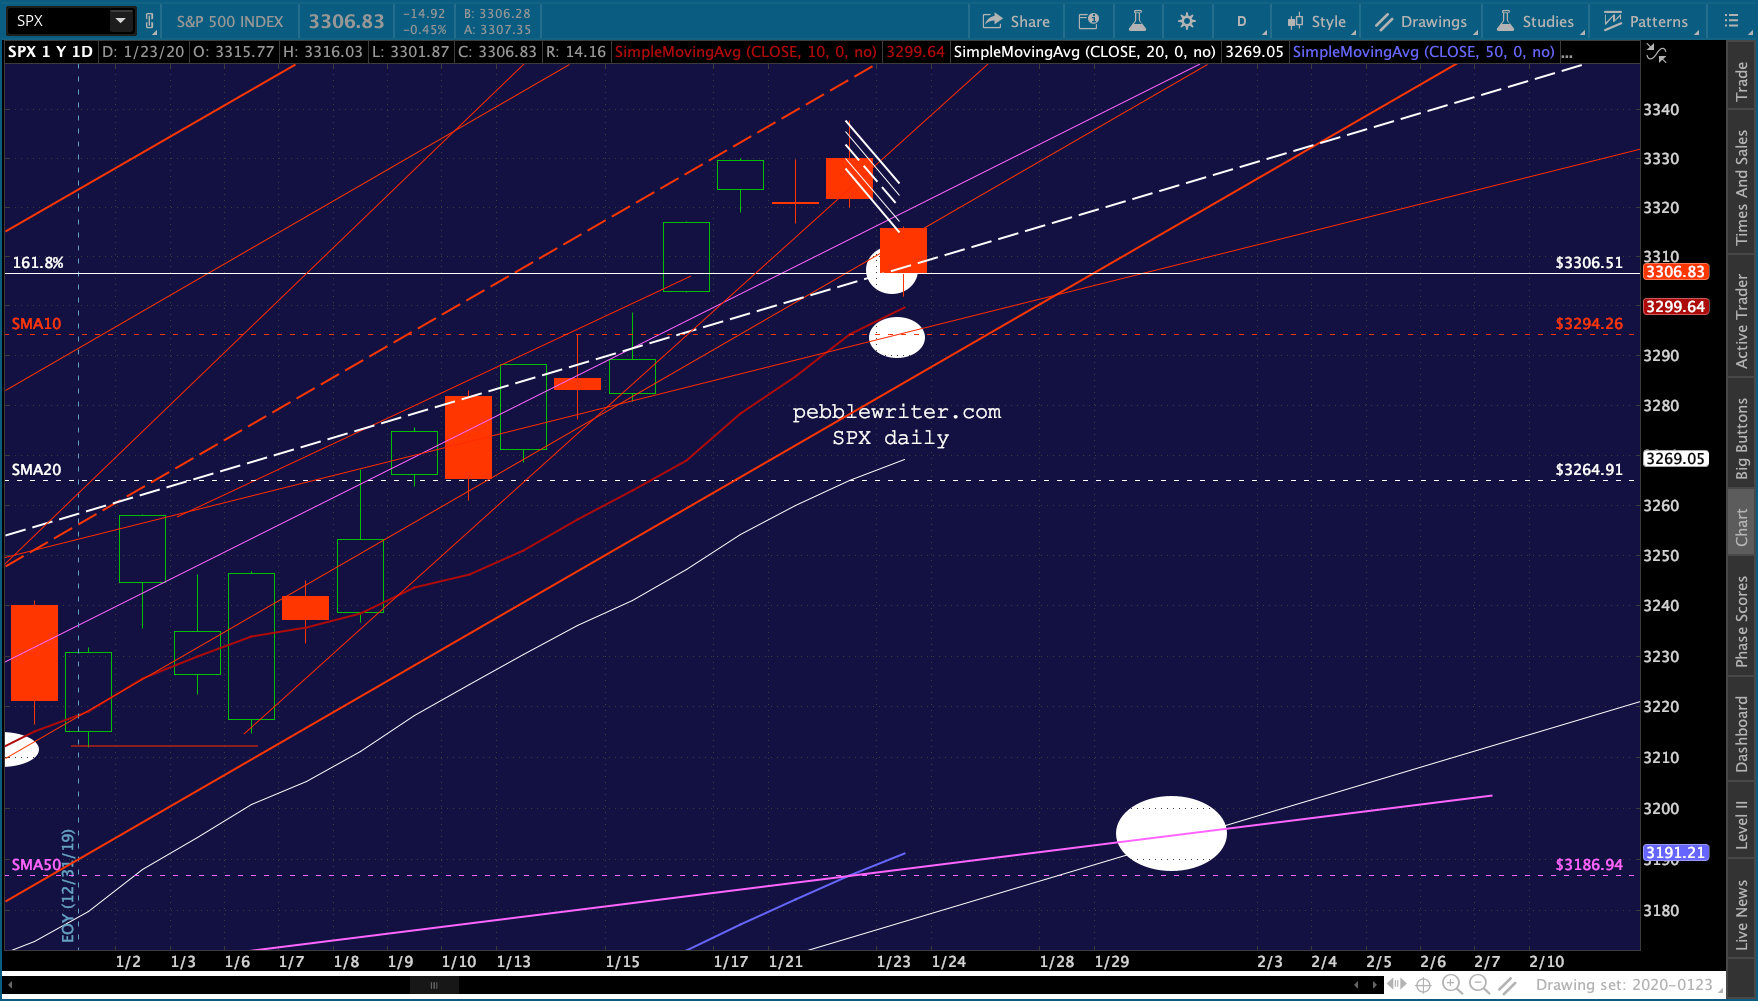
 As things stand, ES is showing a modest loss with the SPX 1.618 backtest still the initial target.
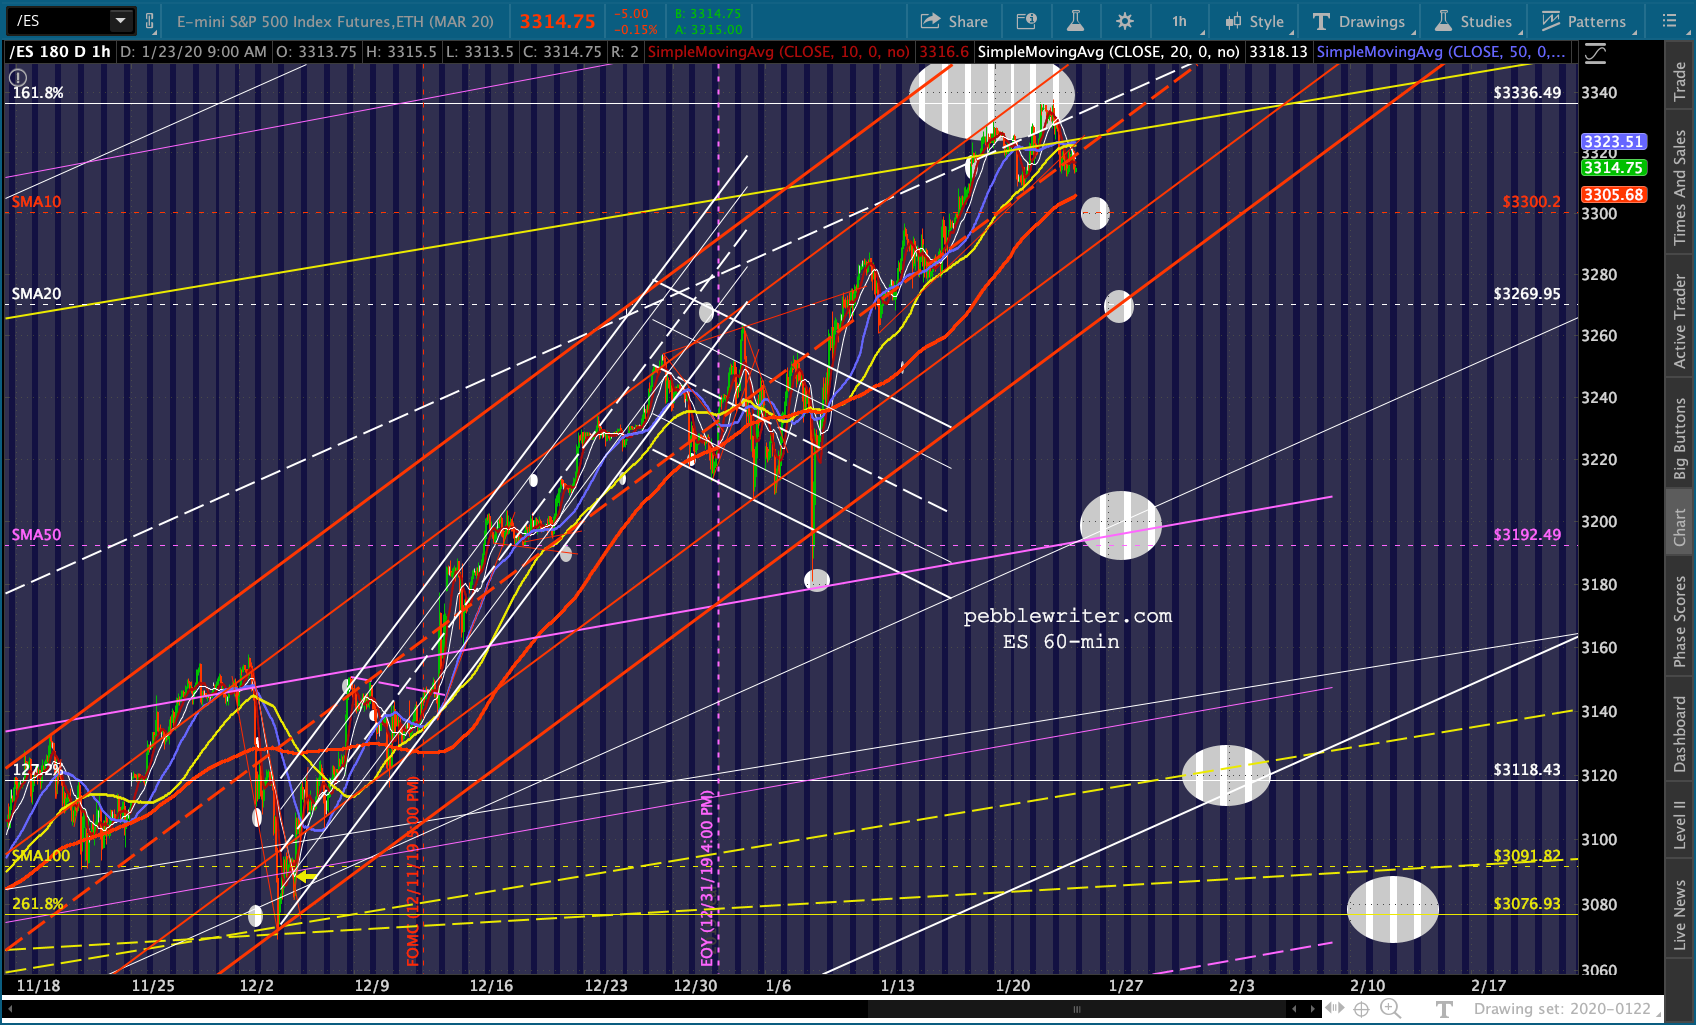
 VIX is adding to yesterday’s bounce and should test its SMA100 at 14.19 or SMA200 at 14.93, depending on whether SPX 3306.51 holds.
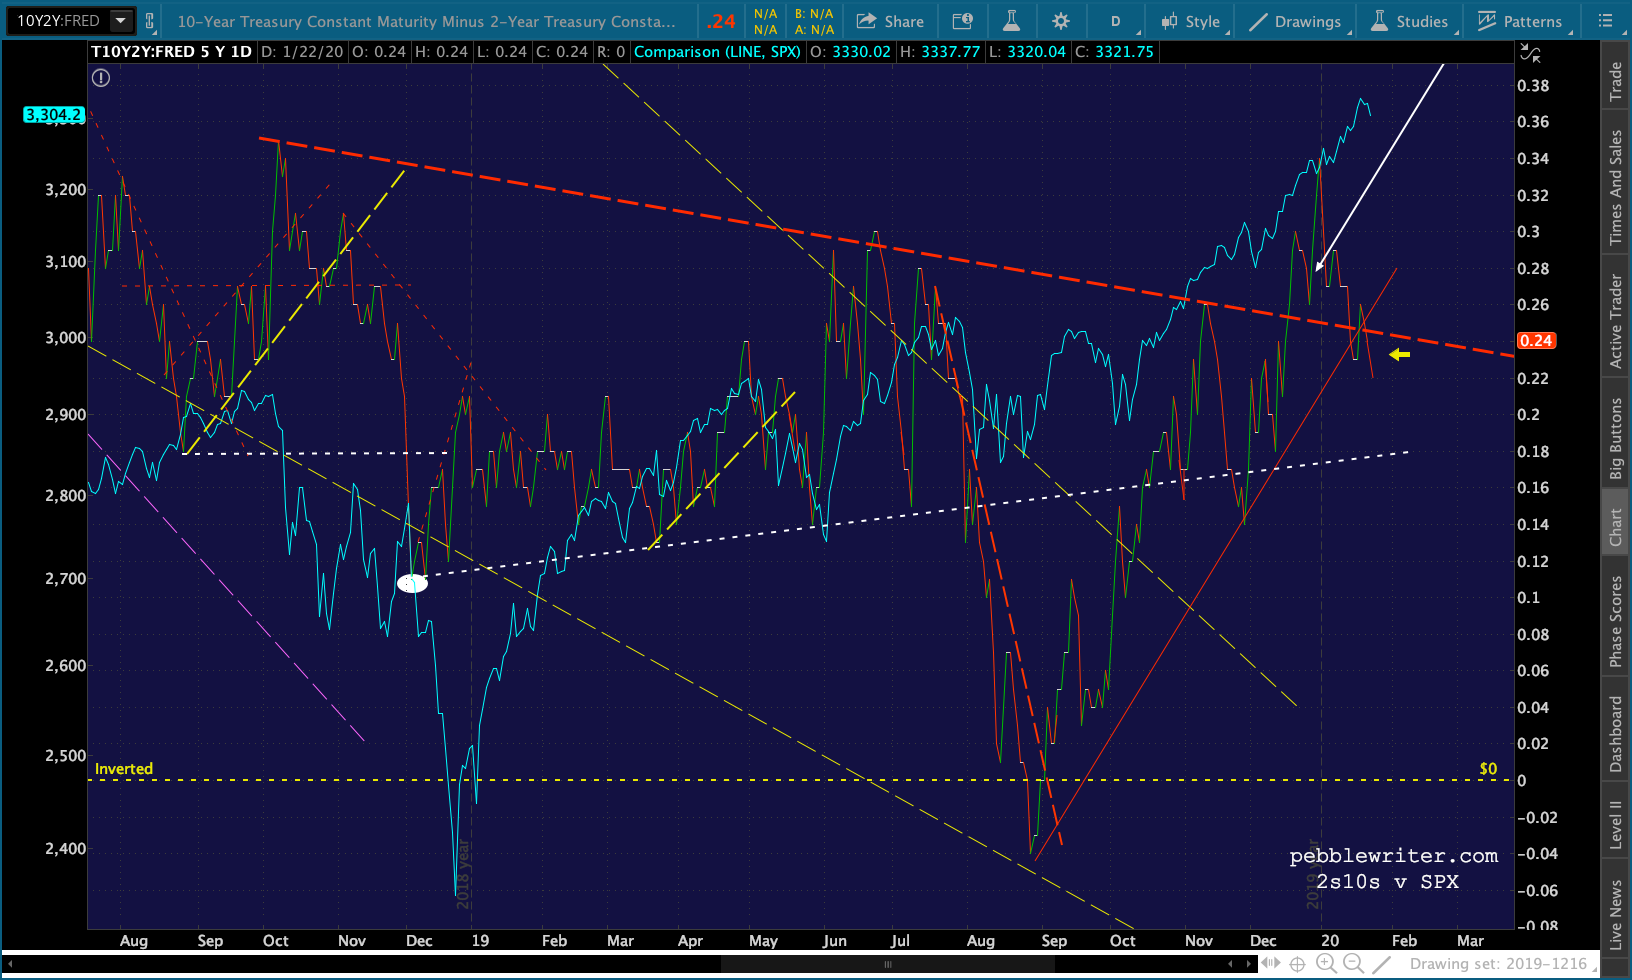
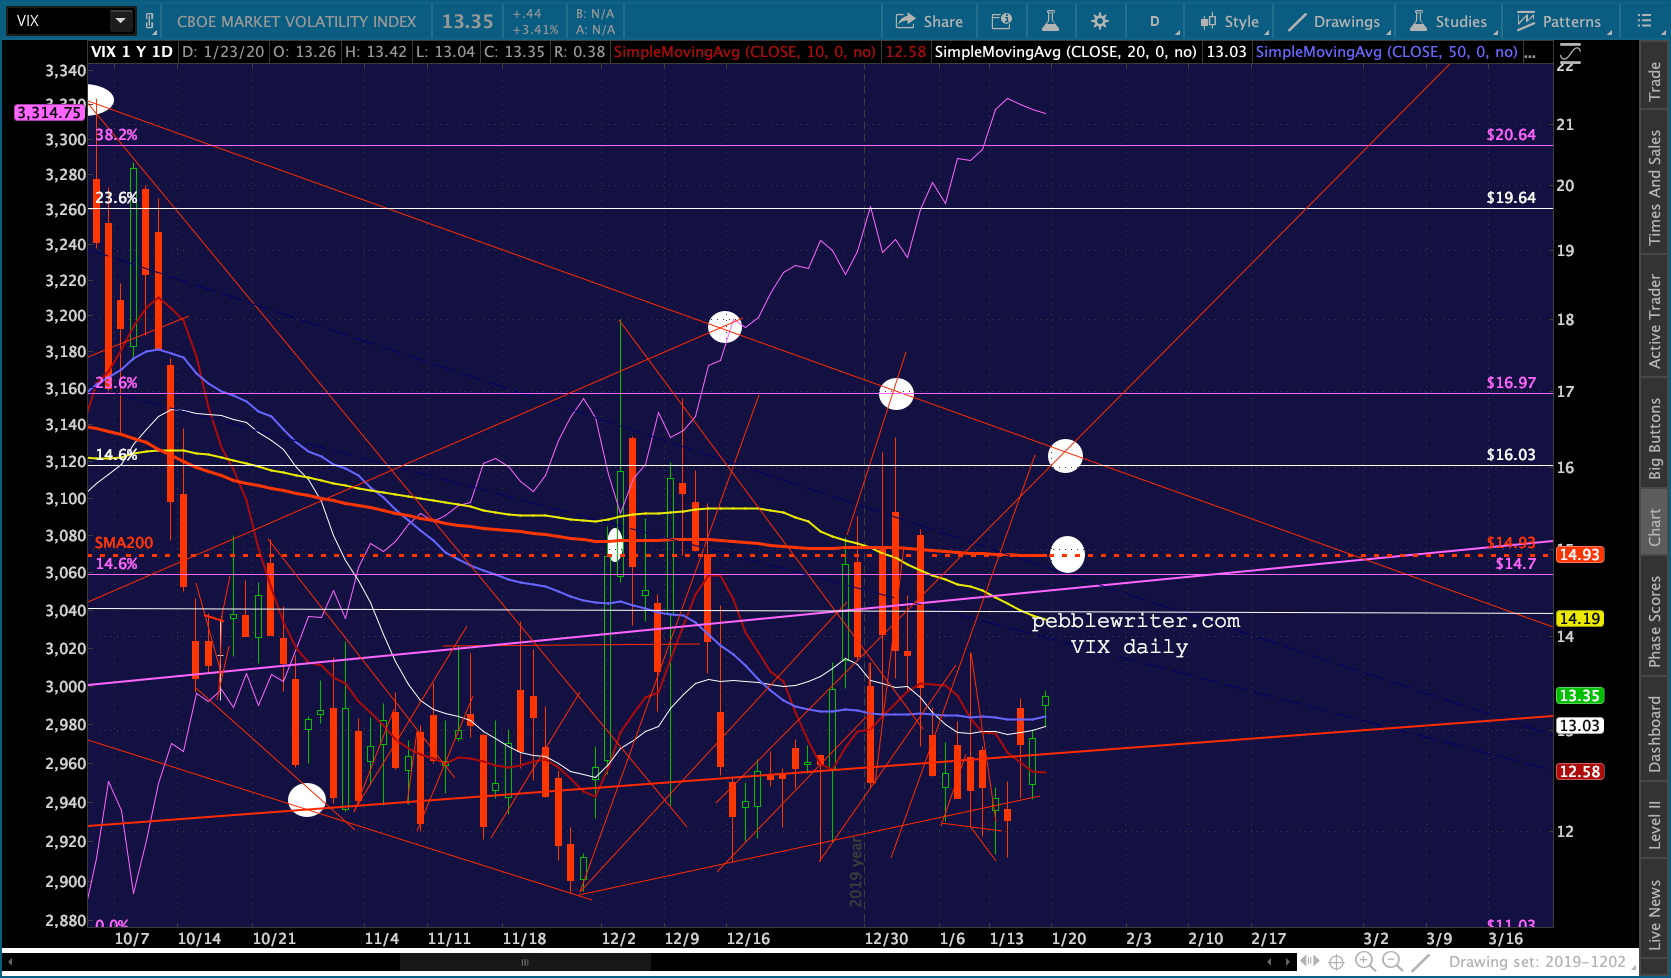 The 2s10s continues to threaten a breakdown — a significant development should it play out, even though a breakout has bigger consequences.
 UPDATE: 9:35 AM
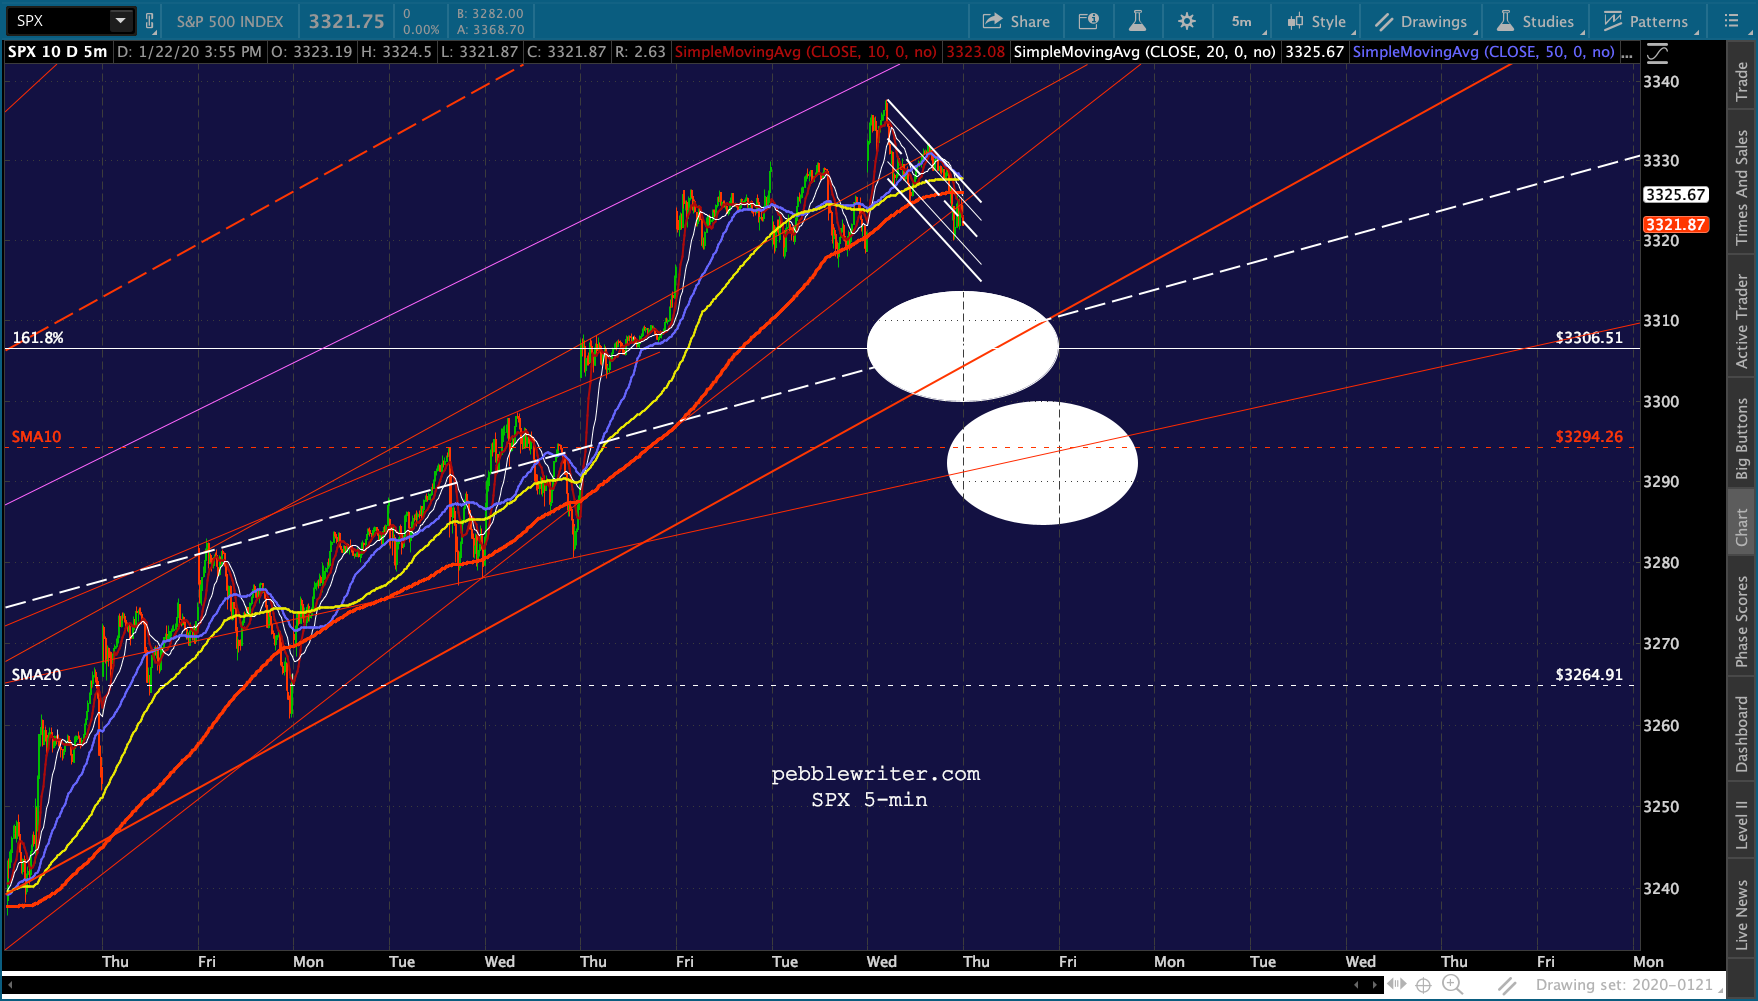
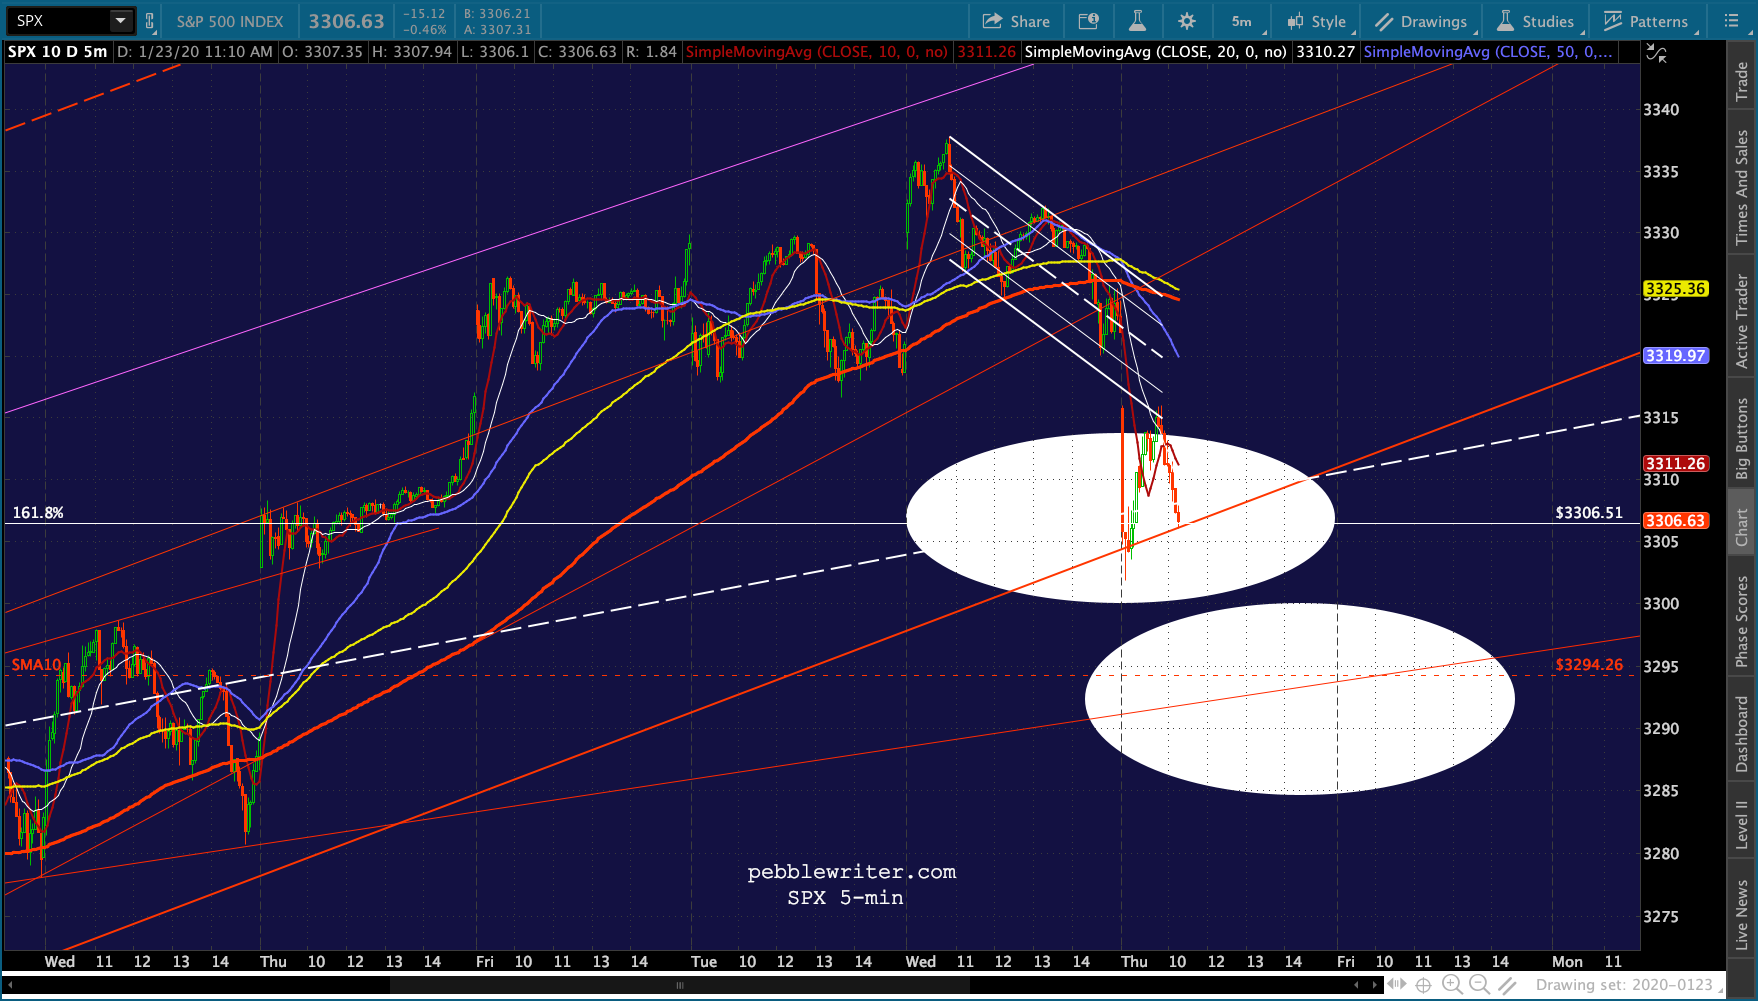
That didn’t take long. If 3000 is broken, the next target is the SMA10 at 3294.26. 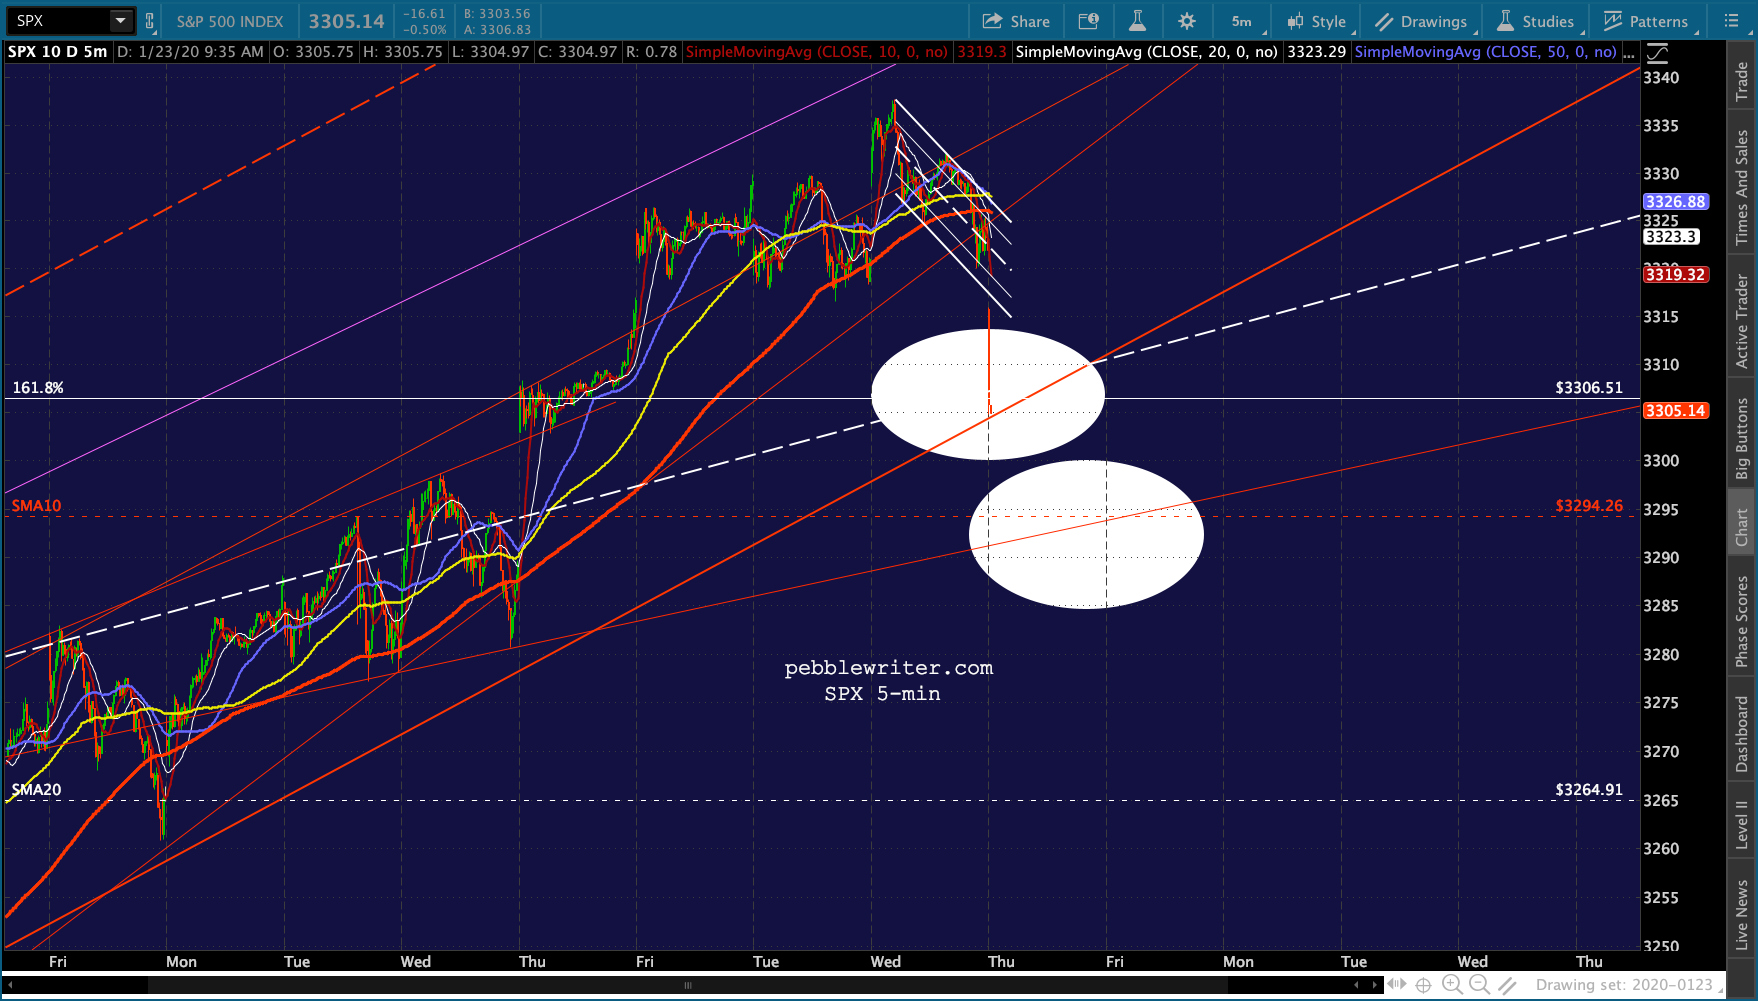 Note that ES’ SMA10 is at 3300.20…
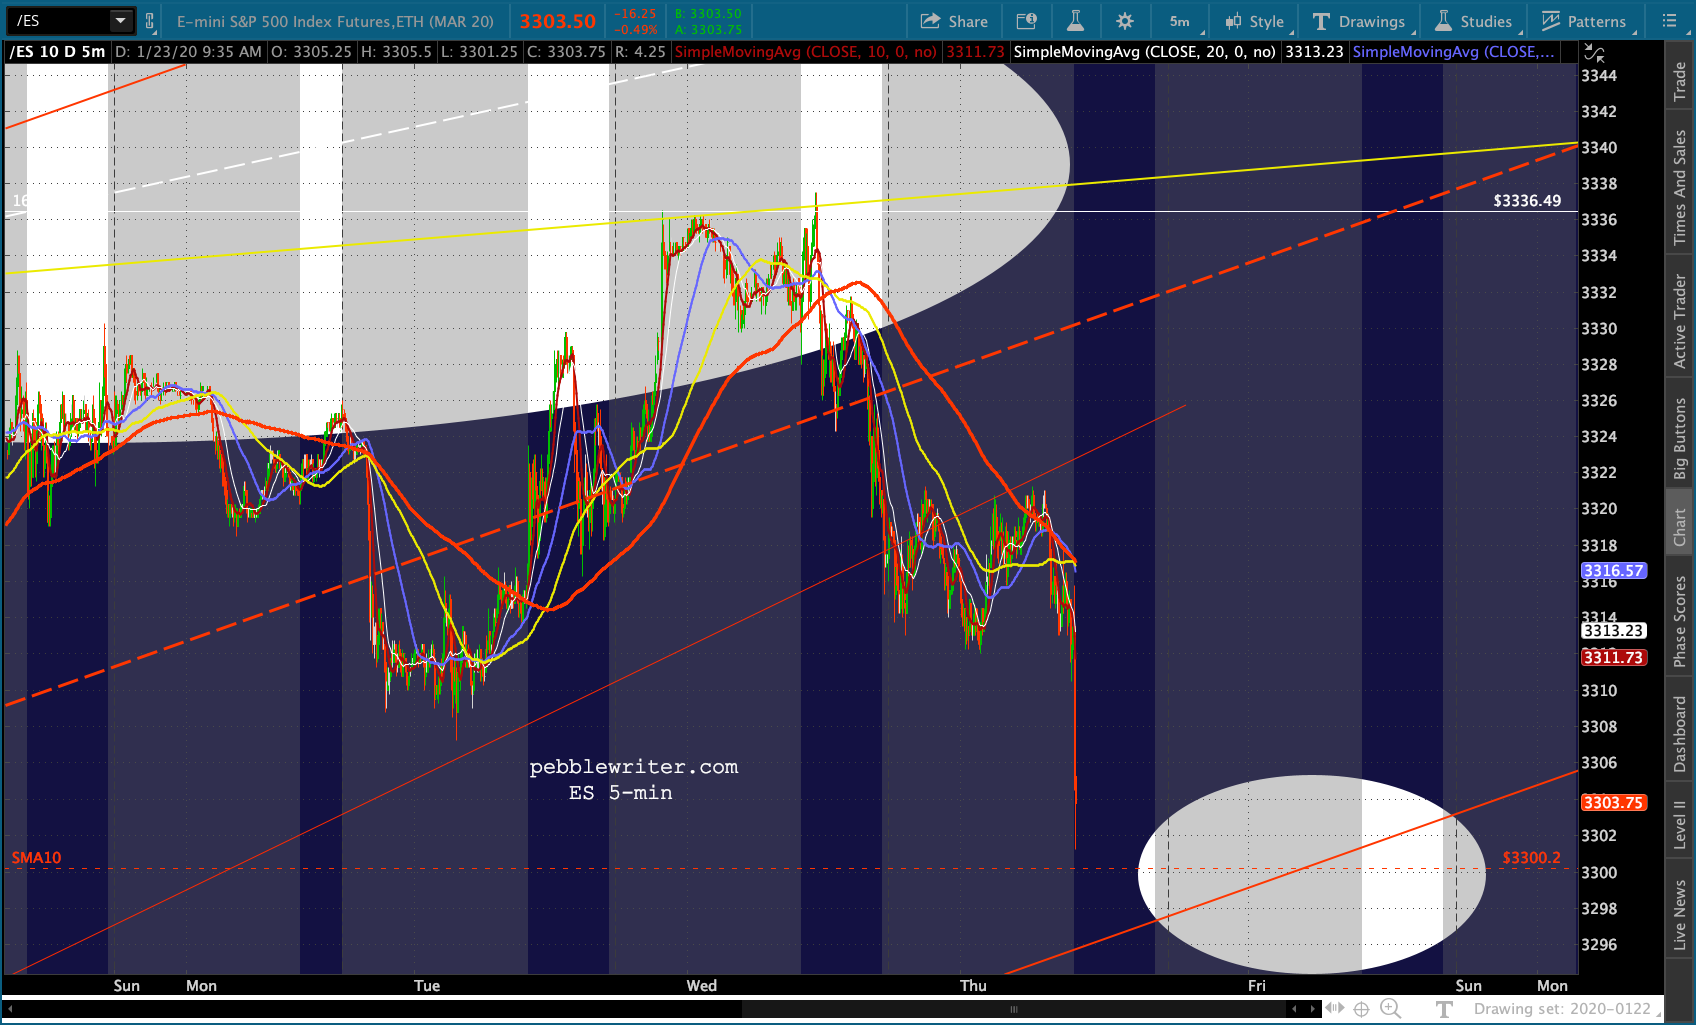 ..and, VIX is approaching its SMA100.
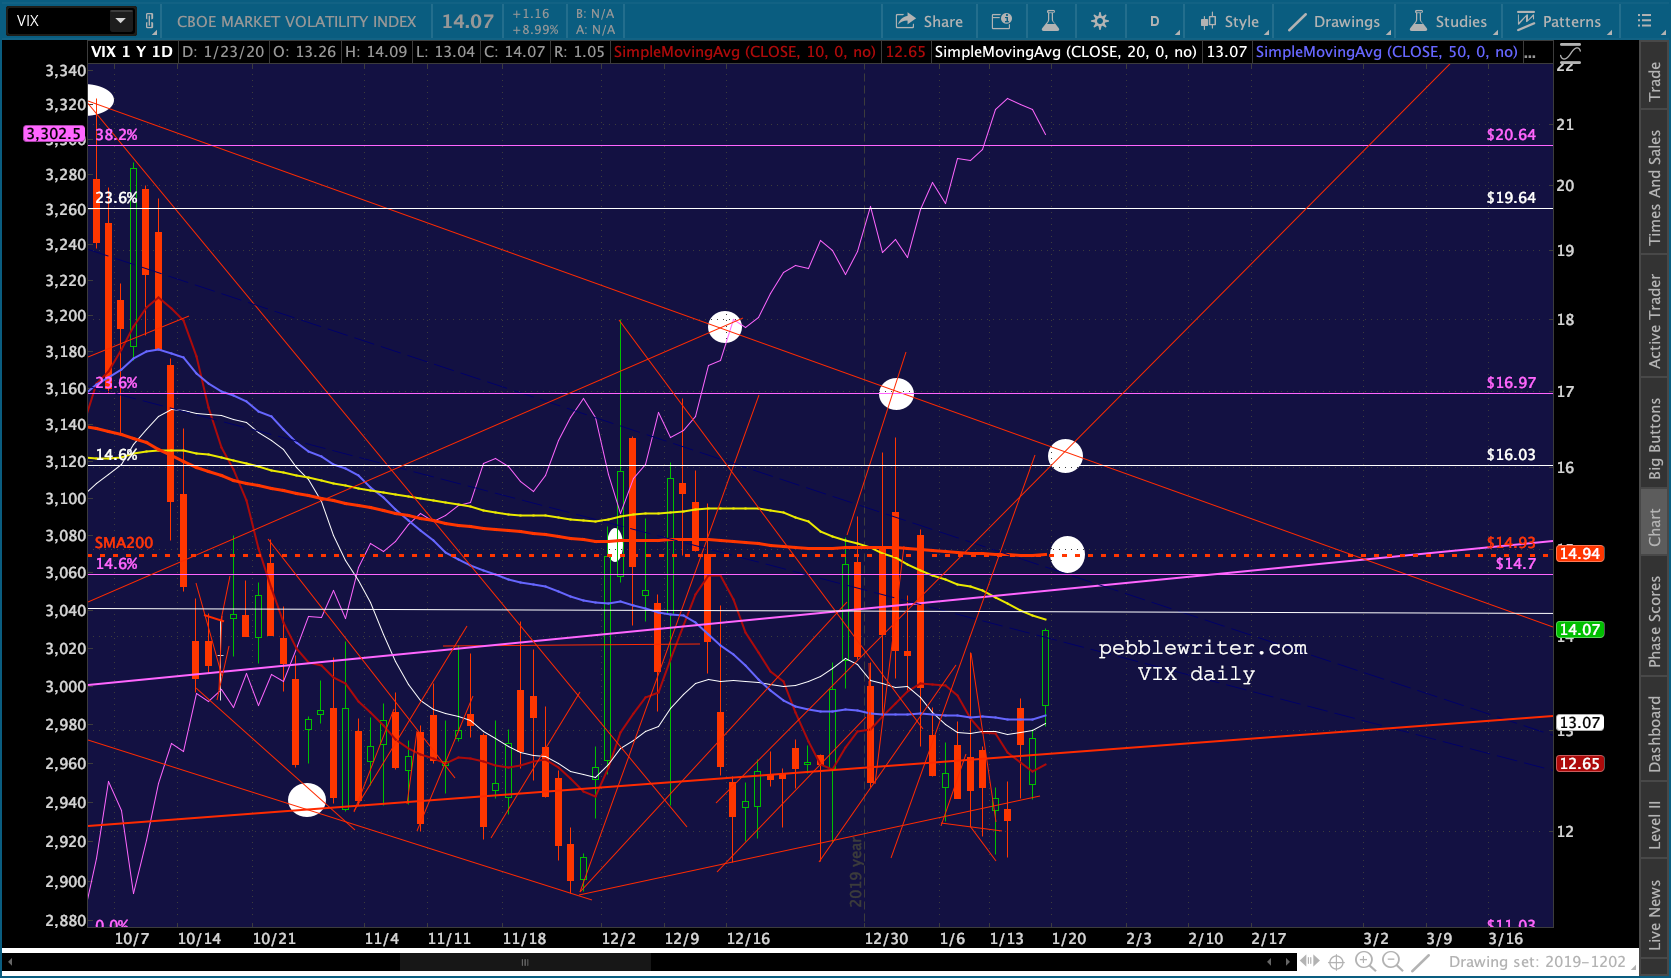 UPDATE: 11:20 AM
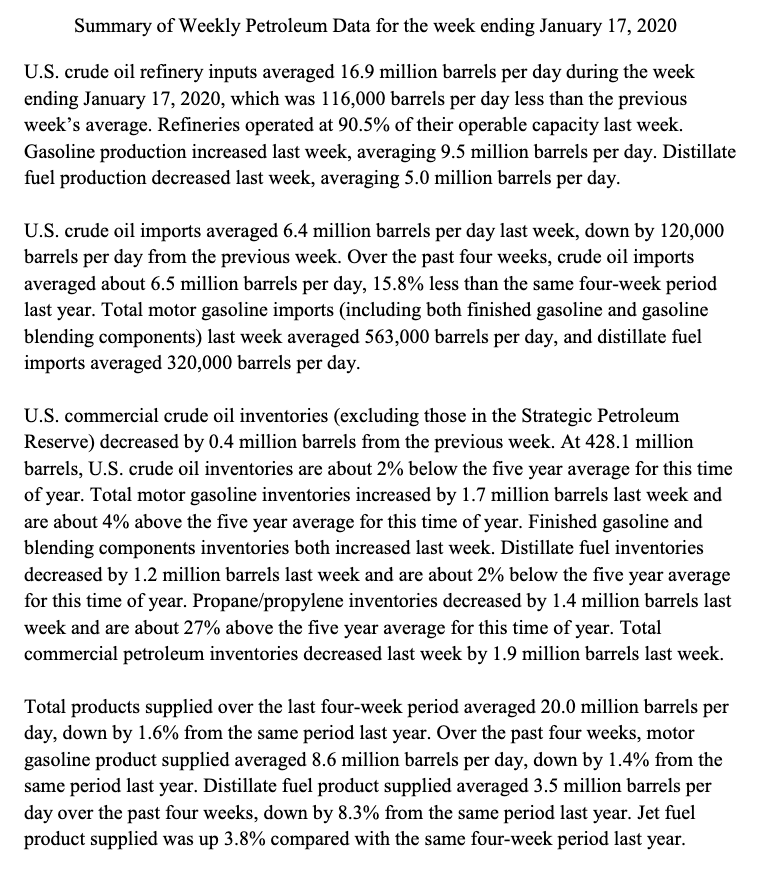
EIA’s data differed materially from API’s, with a small draw in crude versus a modest build and a smaller build in gasoline. Distillates saw a modest draw versus a large build. 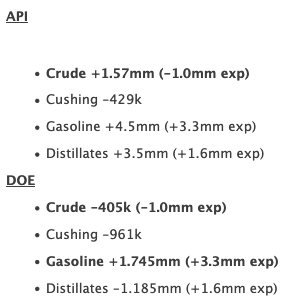
 CL and RB are both bouncing on the news.
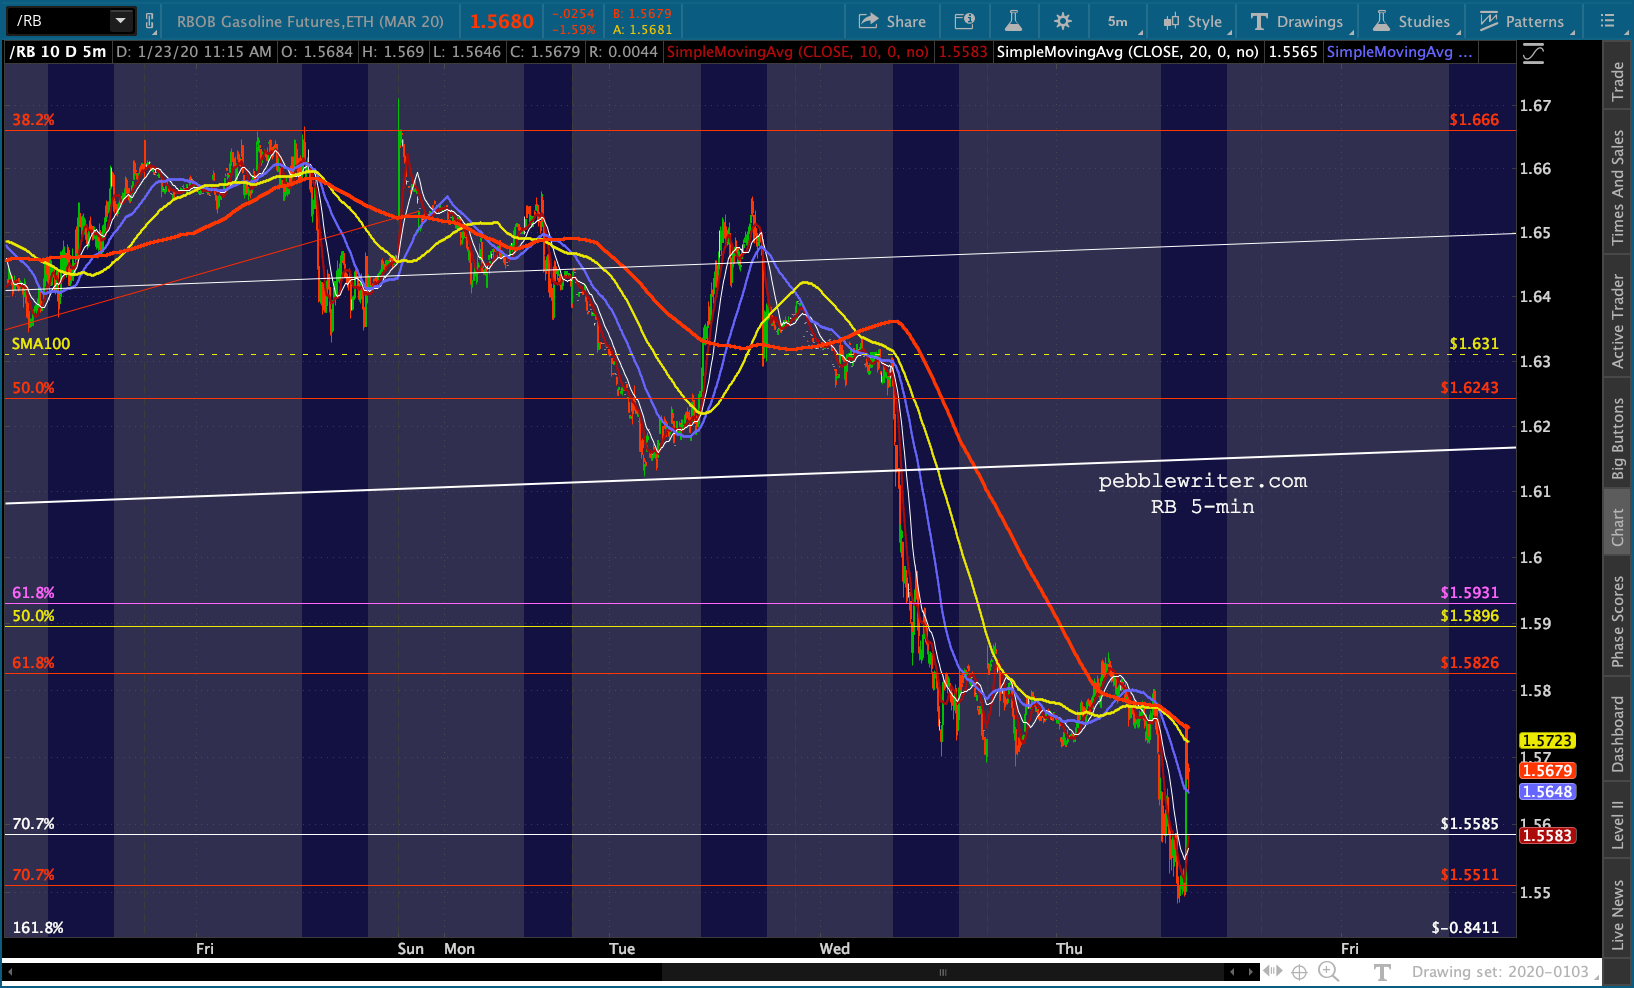
 SPX dipped very close to where today’s SMA10 would be, so it’s not too surprising that we got a bounce earlier after it and ES nearly tagged 3000.
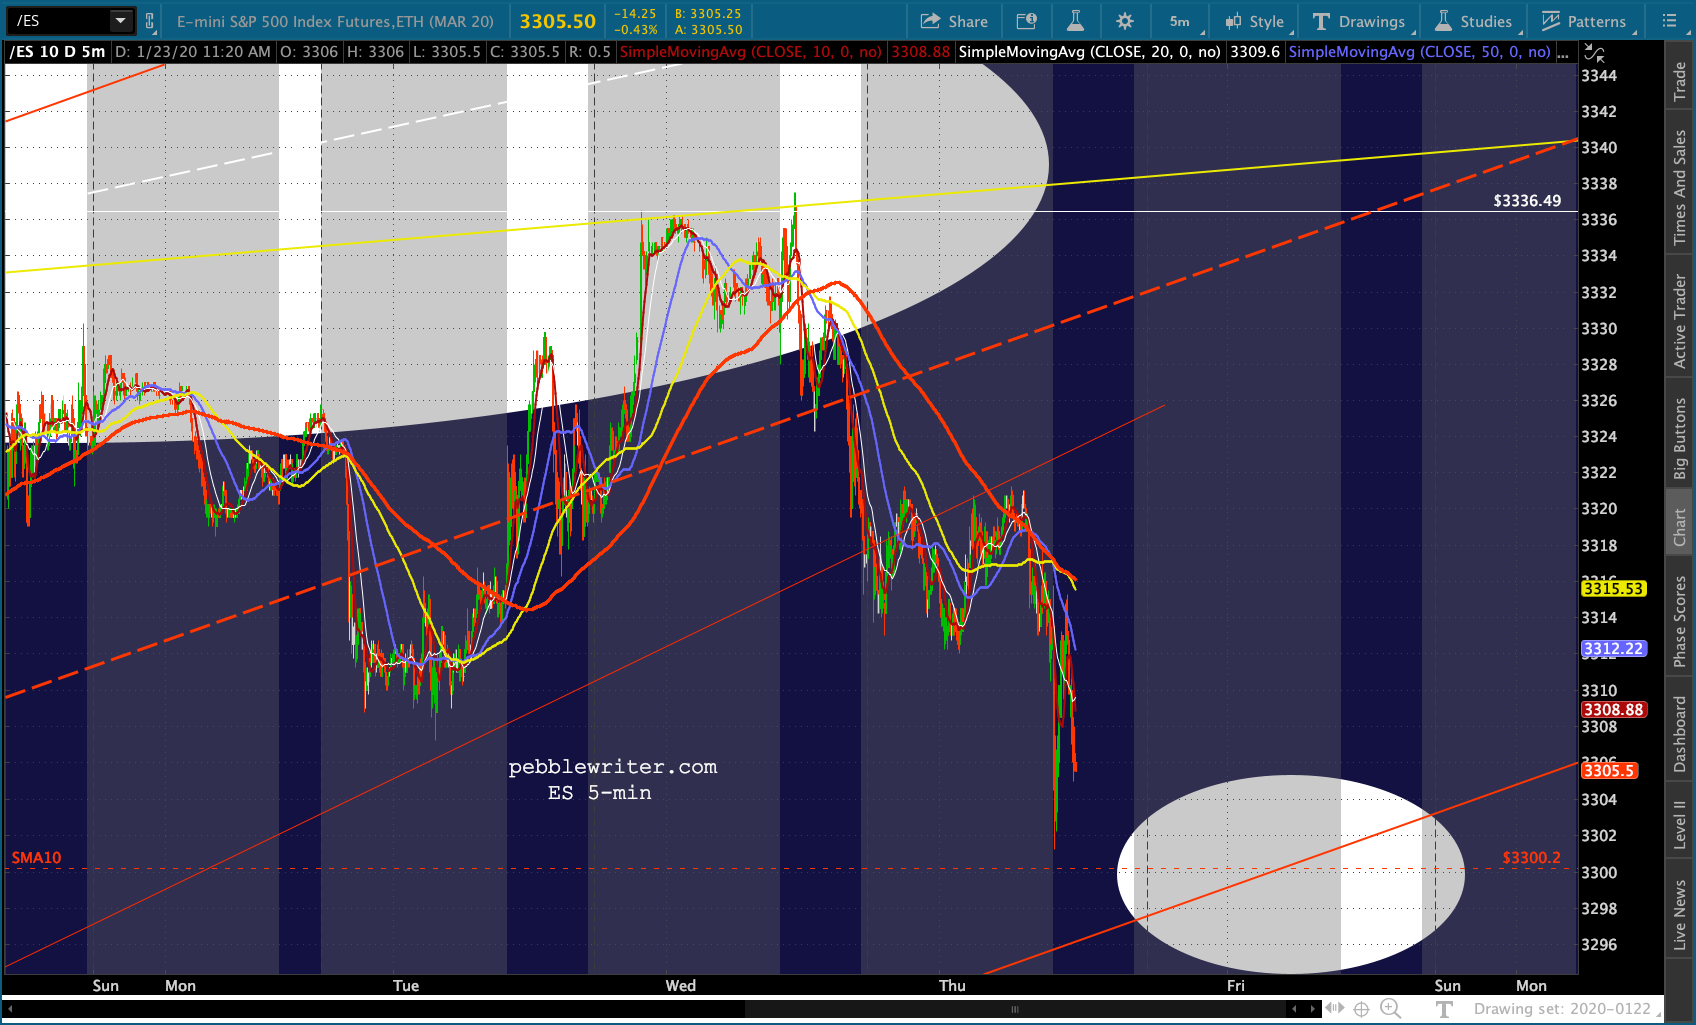
 Lower oil and gas prices mean lower inflation which means lower interest rates. And, sure enough, TNX and 2s10s are both sliding.