

About five weeks ago, when ES broke out of the channel it had inhabited since May 1, we noted that there were some very distinct upside targets which suddenly came into play. From Just Two Things on Dec 16: In Fibonacci patterns, upside targets are something to which stocks can aspire. But, they are also potential turning points. So, what does it mean that ES just reached that important Fibonacci target at 3336.49?
 continued for members…
The daily view shows a potentially important channel line here as well.
 Though it’s important to remember that the IH&S is aligned with the next higher major Fib extension at 3728.51. If I were working for Larry Kudlow, I would point out that reaching the 3728 target in October might be somewhat helpful to keeping his job for another 4 years.
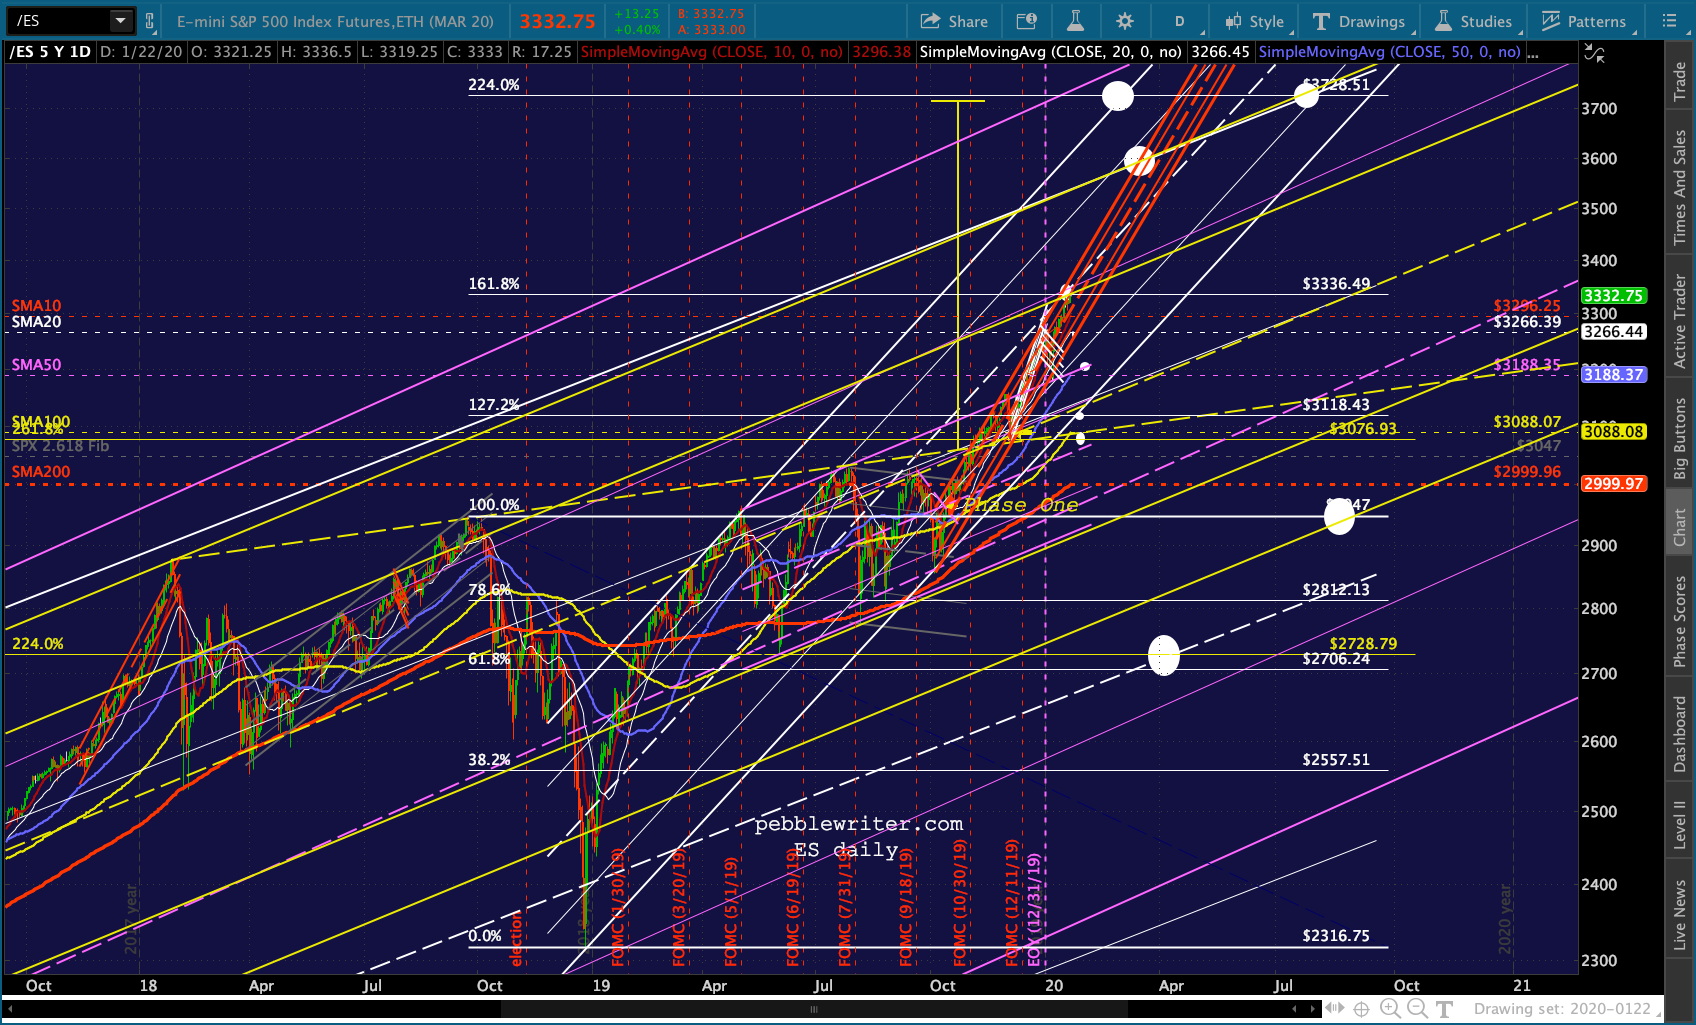 Remember, also, that SPX already shot past its 1.618 Fib a week ago. It’s 30 points north of it right now, implying that a mild backtest is all we can hope for.
Bottom line…for those looking for a trading opportunity on the short side, this is it. Use reasonable stops, though, as we’ve seen all too often how easy it is to thwart downturns.
Still arguing for a downturn: CL and RB. As RB’s channel breaks down, we’ll want to watch as it approaches its red .618 at 1.5826.
 CL’s downside is a little less clear. Though I’ve had that .618 target on there for quite some time, I think it’s a little extreme given that the market barely noticed the latest rise in CPI. Remember, the EIA inventory report won’t come out until tomorrow given the Monday holiday in the US.
 USDJPY is also failing to break out…again.
 This is a very important channel top it has tested. Every former reversal was associated with a significant equity downturn.
 DXY is also very noticeably not breaking out, at least yet.
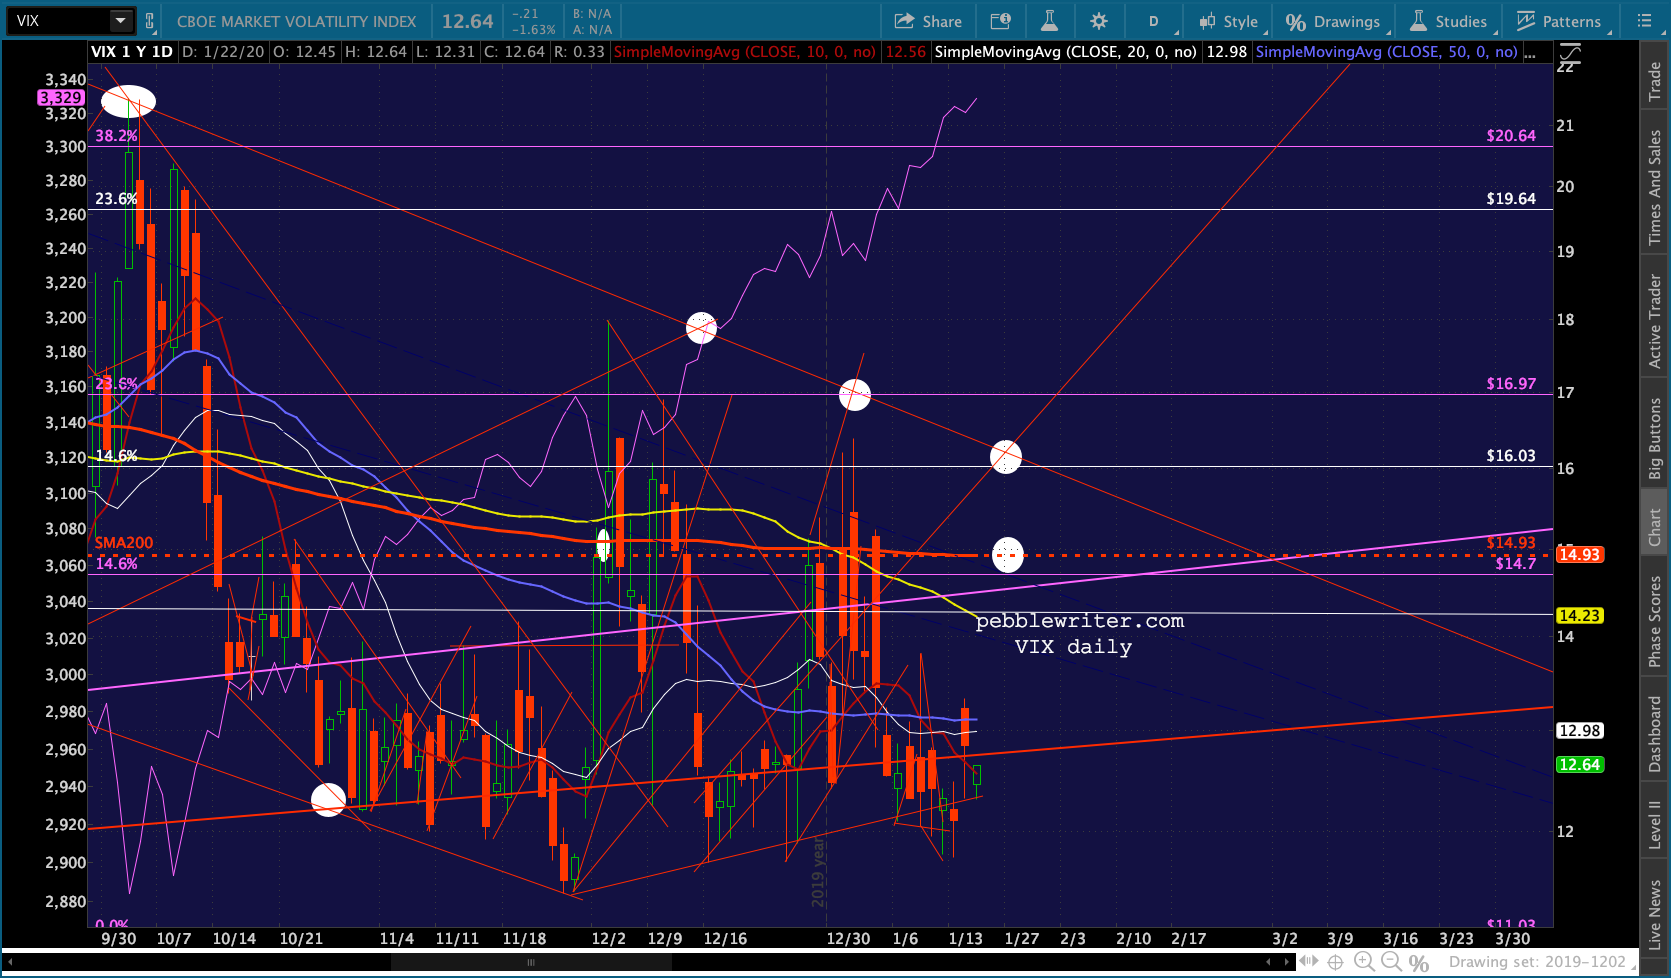
 As is often the case, much rests on VIX’s shoulders. Will it plunge below the TL from Nov 26 yet again? And would that offset what’s going on with CL, RB and USDJPY?
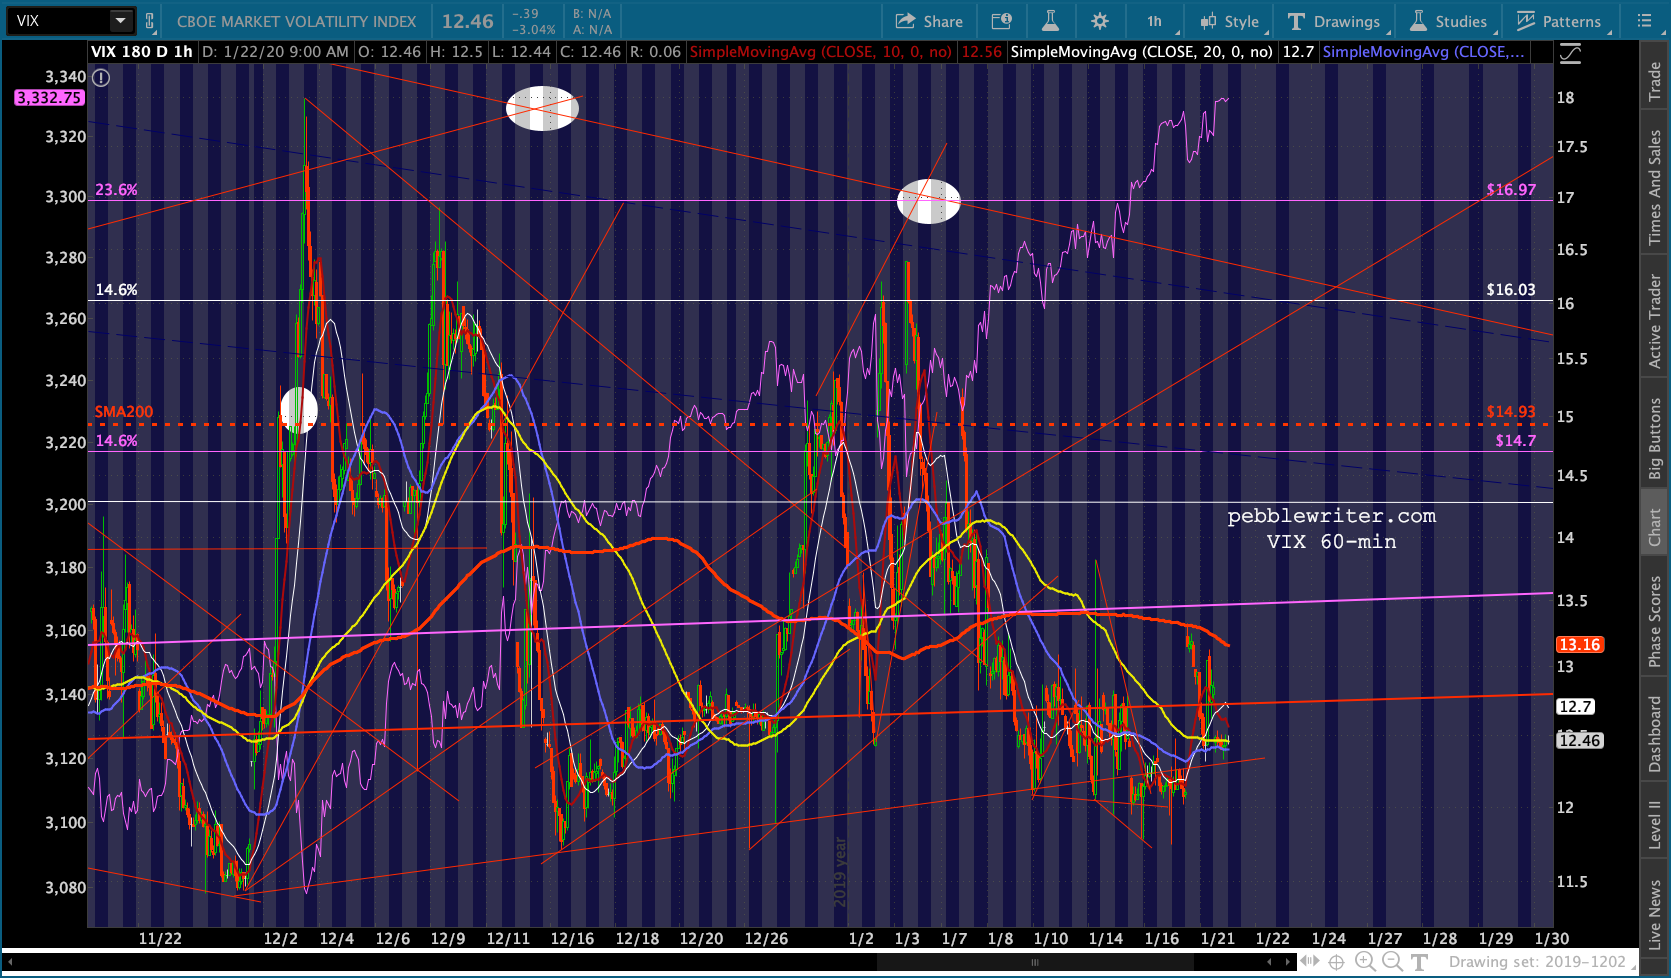 UPDATE: 11:00 AM
Looks like it’s time for the drop to get started…
 UPDATE: 12:14 PM
RB just reached the .618. For those holding short, keep a close eye on it as we could get a bounce here. Don’t think it will, but… ES is still trying to decide whether to let loose or not.
 I have to run out for an appointment, should be back around 2-2:30.
GLTA.
UPDATE: 5:00 PM
API came in with a large build for gas and a smaller one for crude. The numbers:
 The day was pretty brutal for both.

 TNX’s breakdown is starting to look pretty obvious.
  The math for gasoline: AAA reports a 12.8% YoY gain, GasBuddy a 13.4% gain. According to the EIA, the three week average for January is 2.474. This would be a 15.4% increase over Jan 2019’s 2.145. There is one more data point to be collected on Jan 27, so the bigger the drop between now and then, the better the odds of holding CPI to 2.3% or less. Recall that BLS reported a 7.9% gain for December – well below EIA’s 9.1%.
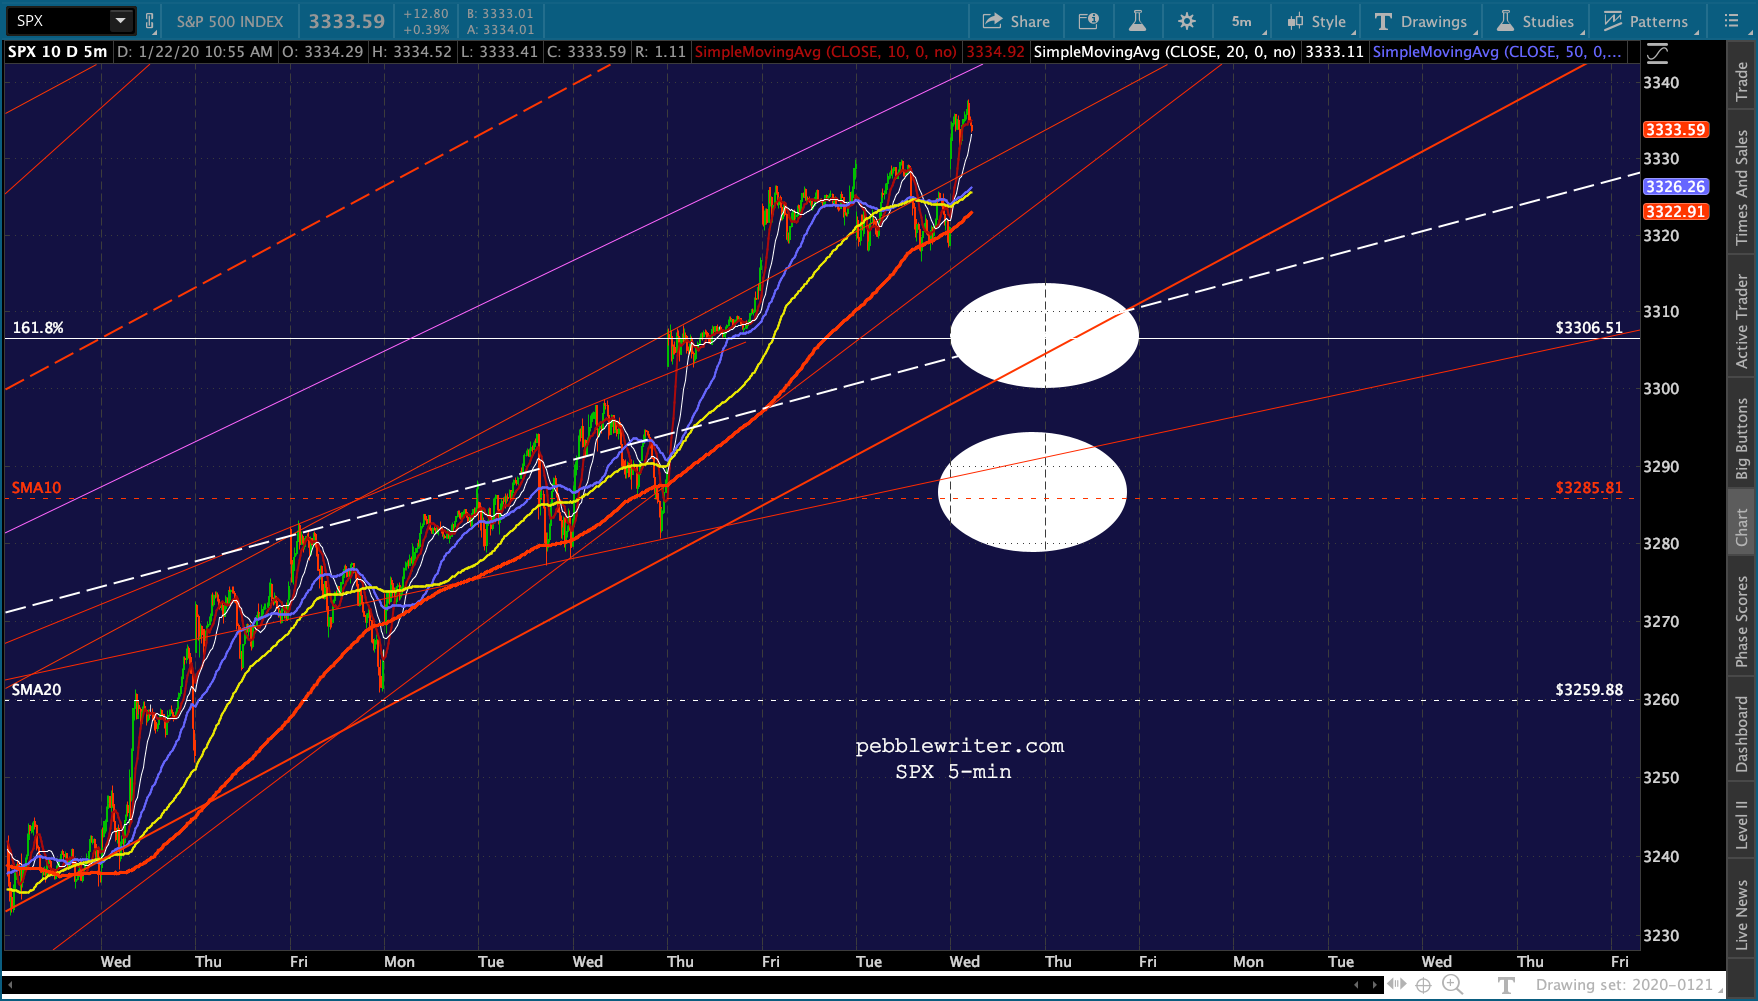
VIX managed to close higher. It wasn’t a big drop, but the fact that the ramp job was completely unwound made waves. The 3306 backtest is looking pretty good. If that fails, things could get exciting.

 FWIW, USDJPY is setting up to complete a little H&S pattern targeting the SMA10 at 109.26. Stocks will notice if it breaks horizontal support.