

The first is that VIX has again been hammered below a trend line dating back to Nov 2017. The algos are all over this and futures have soared 17 points. Total capitulation, at least for the time being. The second is that gas prices remain stubbornly high – signaling a coming spike in inflation unless prices tank in the next two weeks. The YoY delta has soared over the last two months, with December’s delta at about +10%. Hardly anyone is talking about this — at least publicly. I suspect the Fed is talking about it quite a bit behind closed doors.
 continued for members…
The rest of today’s charts:
ES will make new all-time highs today…
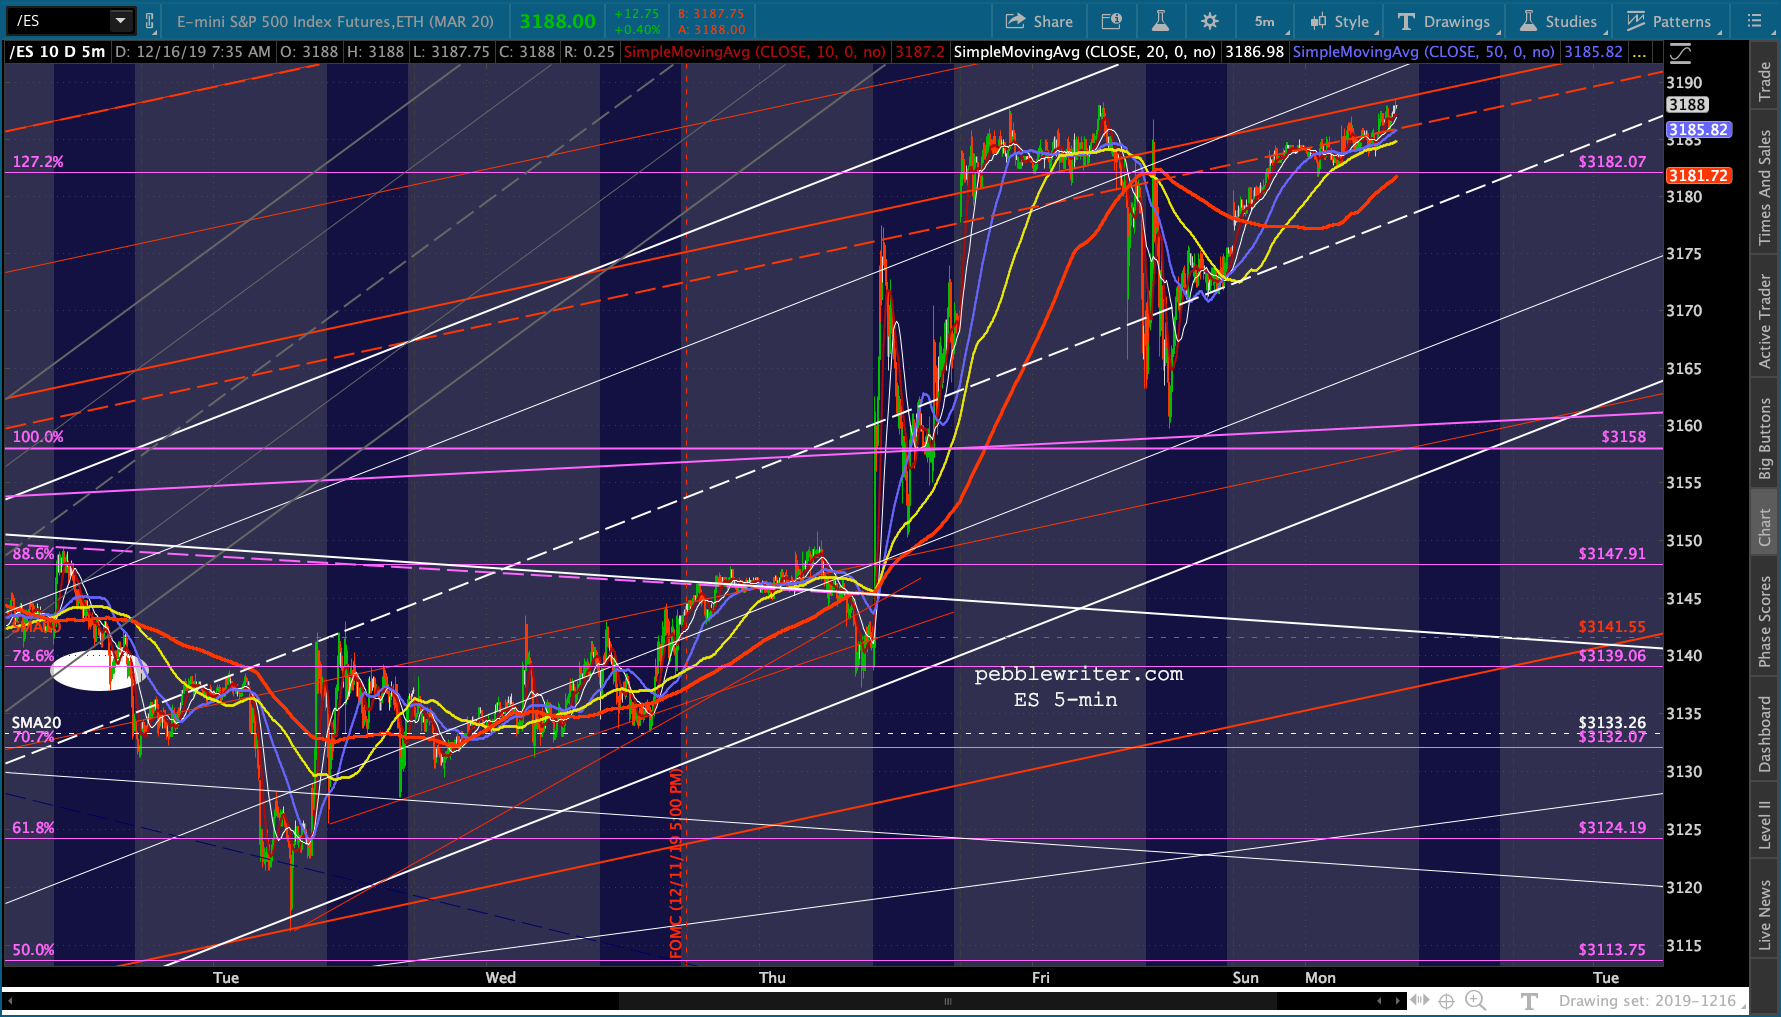 …as it once again departs the rising purple channel. The top of its small white channel is around 3200-3205 (depending on when), which should provide some resistance – at least intraday.

 Ditto for SPX – a breakout which greatly diminishes the chances of a 3047 backtest any time soon.
 USDJPY is contributing to the pop, though not “all-in” just yet.
 …meaning NKD is getting a nice boost. It has topped its .886 and isn’t far from its 2018 highs.
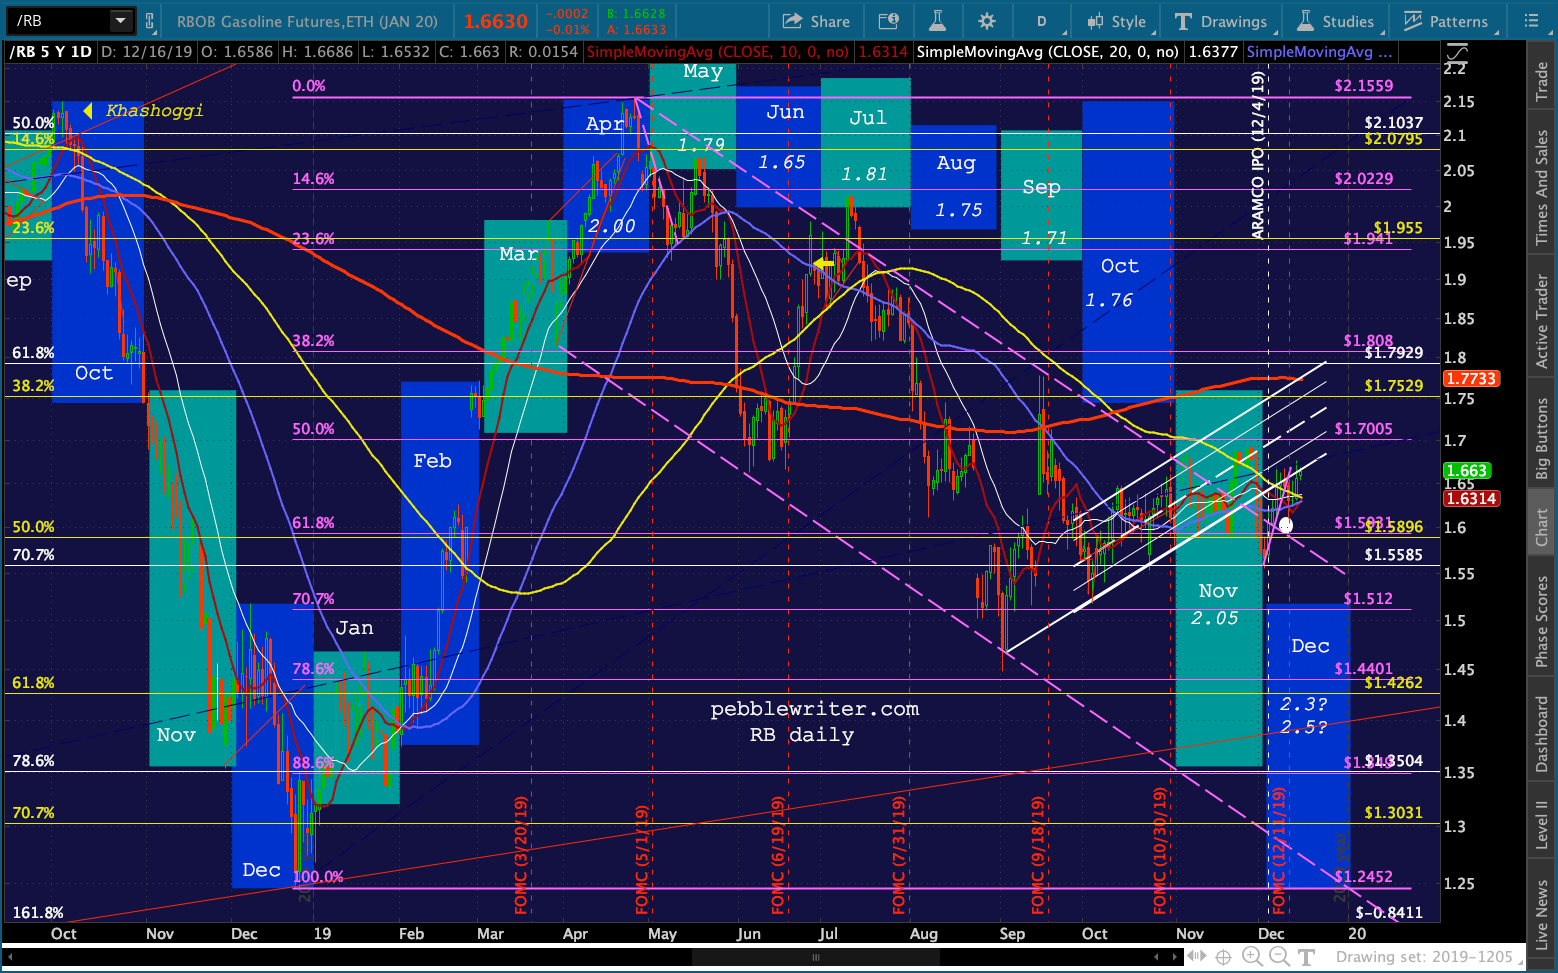
 CL and RB are hesitating, which makes perfect sense if the inflation debacle is to be avoided.

 And, 10Y notes’ SMA200 is getting closer and closer to a backtest.
 The inflation problem won’t be as severe in January, but it will remain a problem at current prices until at least March when RB can backtest its SMA200 at about the same price level as March 2018.
This should give gold a chance to finally hit 1588, even if it remains under pressure for the next 3-4 weeks.
The implications, of course, could be severe for the bond market. The strong correlation between the 10Y and CPI over the past 10 years… …means that the recent breakout could get worse before it gets better.
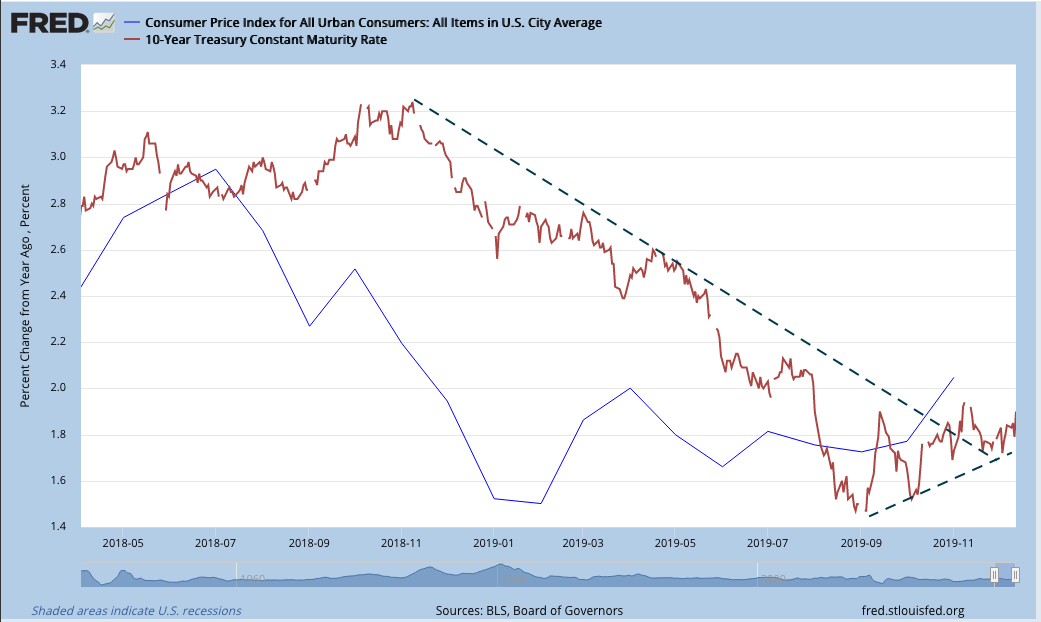 On the surface, this might not seem like a problem for the market. Higher rates are supposed to signal greater confidence and boost earnings for financials.
But, if the short end of the curve remains under pressure from not-QE or QE-4, the 2s10s spread could continue to increase. As we’ve discussed many times, breakdowns in the 2s10s are bad for stocks. Major breakouts, especially in the wake of inverted yield curves, are much worse.
 This is not to suggest that anyone run out and short the market right now. Though we’ve had a headfake consisting of 4 sessions below the SMA10, we never got a bearish 10/20 cross. Things haven’t really changed from a month ago [see: Melting Up]:
There are 29 sessions left in 2019, so I wouldn’t assume we’re going to get a major reversal between now and then — though we could. At this point, SPX is 2.5% above the 2.618 Fib (1.6% for ES), so it would be a very minor correction. Though, TPTB might be hesitant to break trend and open the door to a larger correction.
ES is coming up to a decision point – the red channel or the purple. We should find out in the next session or two.

By breaking out of the purple channel (again) on the 12th, ES reached the 3200 target well ahead of the end of the year and is well on its way to the yellow channel target around 3310ish. This is an algo driven meltup, and as such is subject to the whims of the usual algo drivers – which means very little to do with fundamentals or the news flow.
Momentum investors should be safe staying long as long as they keep stops at a reasonable level. Watch the SMA10 (now 50 points below ES) and any hint of it rolling over or crossing below the SMA20. As far as shorts go, the only compelling one is RB for the reasons we’ve discussed.
I have to run out for an appointment but will post more after the close if anything interesting happens.
UPDATE: 8:15 PM
I had a question earlier about SMH, which is up quite a bit ytd. I’m afraid the charts aren’t terribly conclusive, but here they are anyway. There are two legit channels from the lows, the larger purple one from 2008 below… …and the smaller white one from 2011. Neither is a great fit, but they’re what we have to work with.
 Prices haven’t reached the top of either rising channel, which implies more upside.
Note that the largest, yellow Fib grid shows a pop above the 1.272 (which wasn’t an apparent target anyway) and clear sailing up to the 1.618 at 162.17 somewhere around May 2020.
An equally impressive breakout occurred at the double 1.618 Fib at 135ish which intersected with an internal channel line of both channels. This should have presented more of a challenge than it did. But, like with SPX/ES, we had an algo-driven breakout.
The red channel midline could conceivably provide some resistance as it has in the past. But, there’s now good support at the 1.618s — not much of a short opportunity. Even the RSI shows more upside potential.
  Interestingly, SMH has been only slightly less volatile than SPX. So, as long as SPX is doing its silly algo-fed dance, SMH is likely to play along.
 Bottom line, upside potential to 162.17 – a 15% rise from today’s close of 141. Though there are several smaller scale Fibs to overcome at 149.35, 156.63 and 158.09. And, the purple channel top is currently around 151.
Downside risk to 135.52 – a 3.8% drop. If 135 broke down, the yellow 1.272 would offer support at 130.58. The SMA10 is just below the 1.618s at 135, so we’d have to consider it decent support.
Keep an eye on the SMA10, which recently dropped through the SMA20 for about a week. If SMH struggles, as it did beginning on Nov 19, that’s where the trouble will show up first.