Two weeks ago, after Boeing’s second 737 Max 8 crashed, I suggested the most obvious outcome from a charting standpoint [see: One Step Forward, Two Steps Back.]
Obviously, BA is reacting to the second crash of its key 737 Max 8. But, its chart already argued for a downturn before the latest tragedy.
First order of business will be to close the gap at 369ish. If it can’t hold at 369, look for it to test the SMA200, the .618, or potentially the .786 Fib well ahead of schedule.


BA closed the gap that morning, then worked very hard to bounce. Unfortunately, despite the company’s best efforts (and, no doubt a few billion in buybacks) the stock has had a hard time staying airborne.
From a charting standpoint, there just wasn’t much support at the original bounce point. As we forecast, the 200-day moving average and potentially the .618 Fib at would likely need to come into the picture. That’s why the stock has spent over two weeks in limbo.
And, that’s why someone dumped a bunch of shares at 4:30 yesterday — 30 minutes after the market had closed for the day. It took all of two minutes for the stock to drop from 370 to 359, and four minutes for it to recover. No fuss, no muss. The plunge won’t show up on the daily chart…
 …but, it’s on the hourly chart and — the company hopes — in the memory banks of those who are betting that the company needs more than a software update to restore public trust in its products.
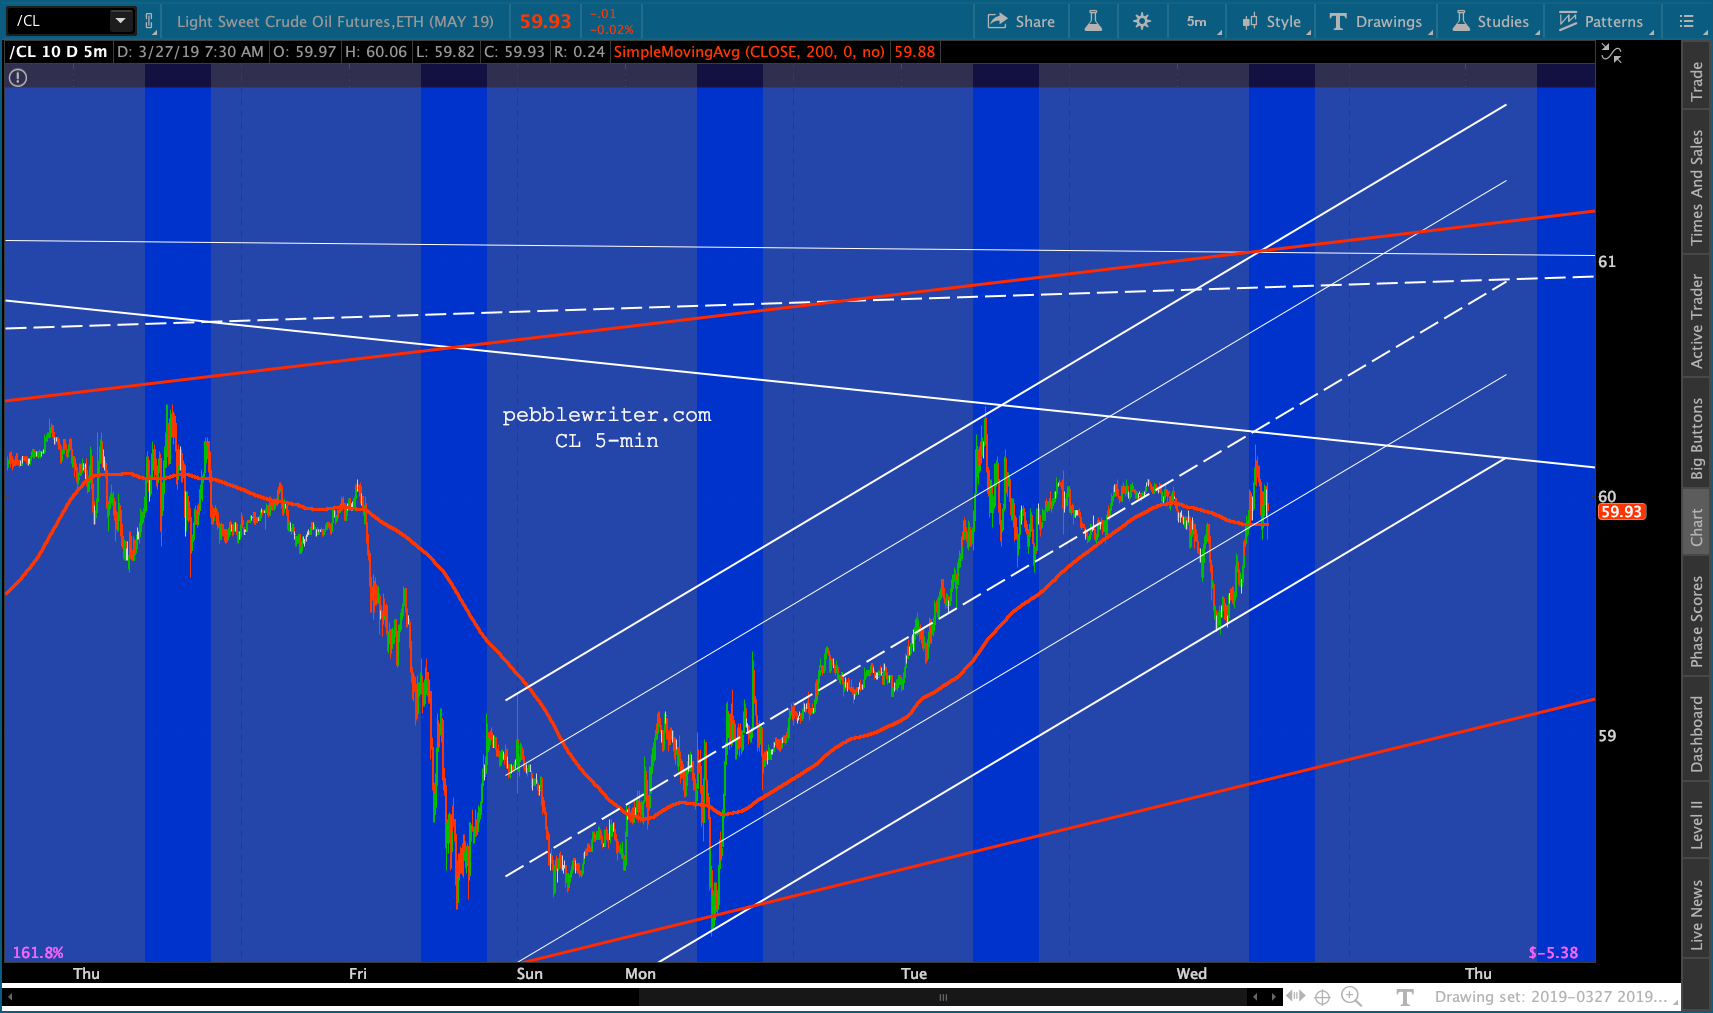
 Meanwhile, ES’s small white channel broke down overnight. All targets remain in force, with this morning’s EIA inventory report likely playing a pivotal role in next steps for the overall market.
continued for members…
A quick overview…
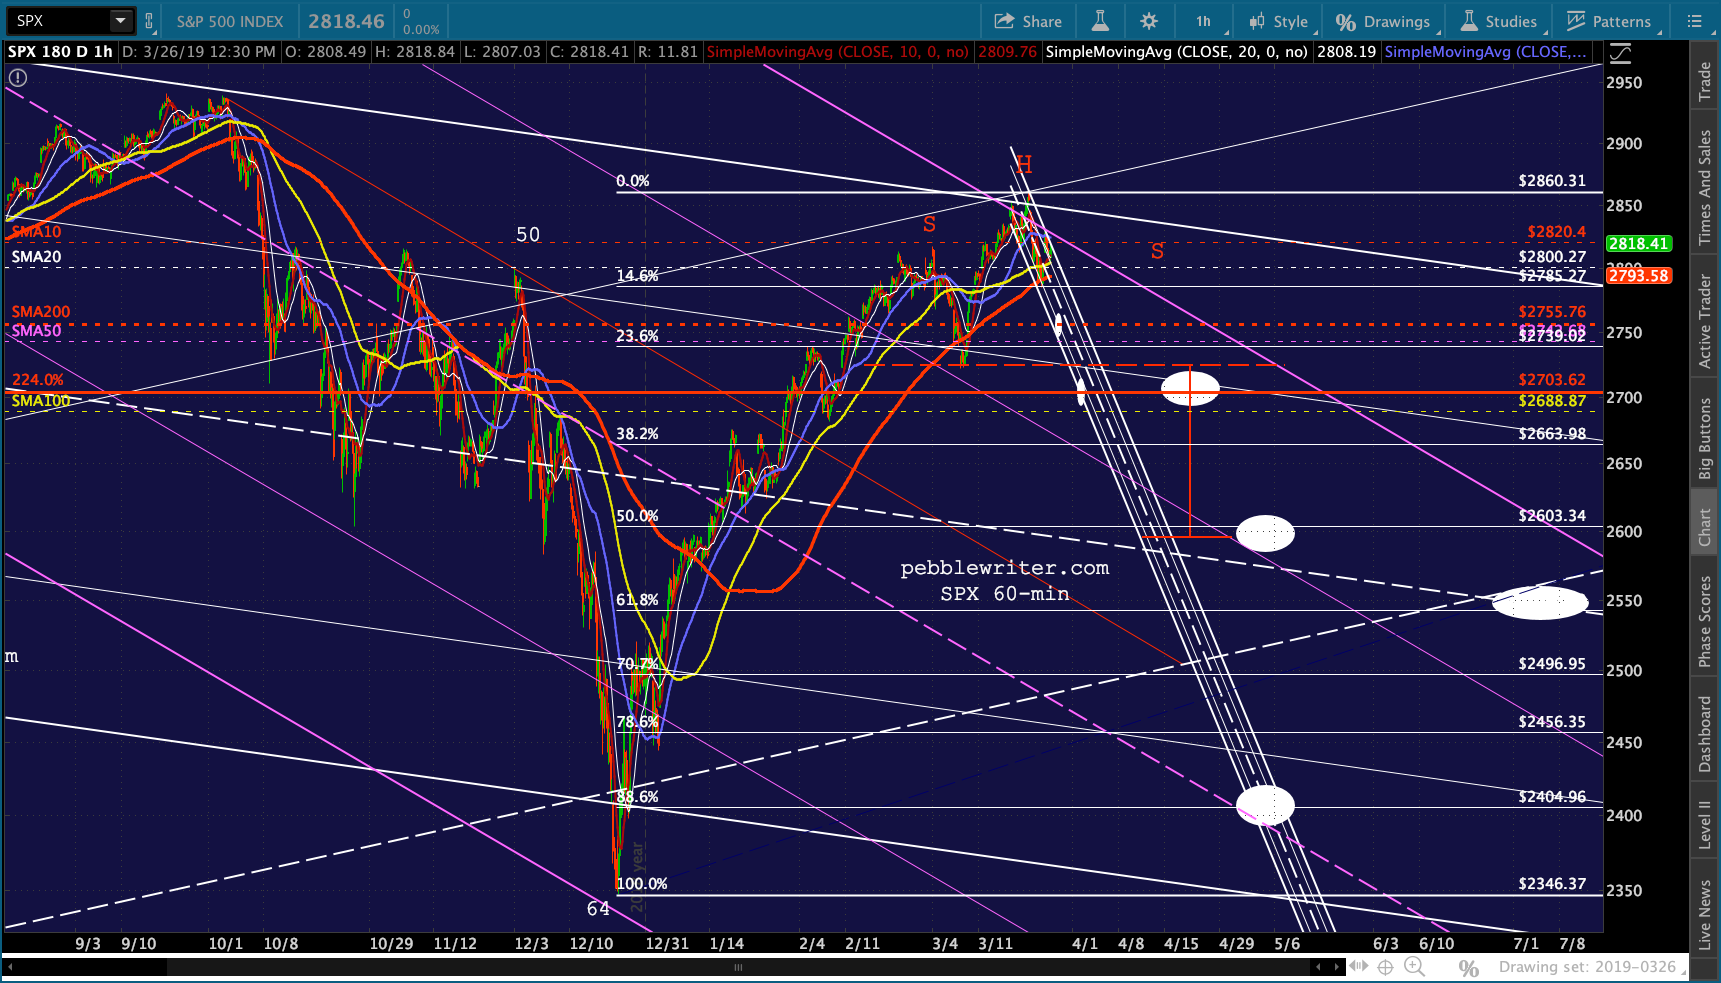
ES’s falling channel remains intact.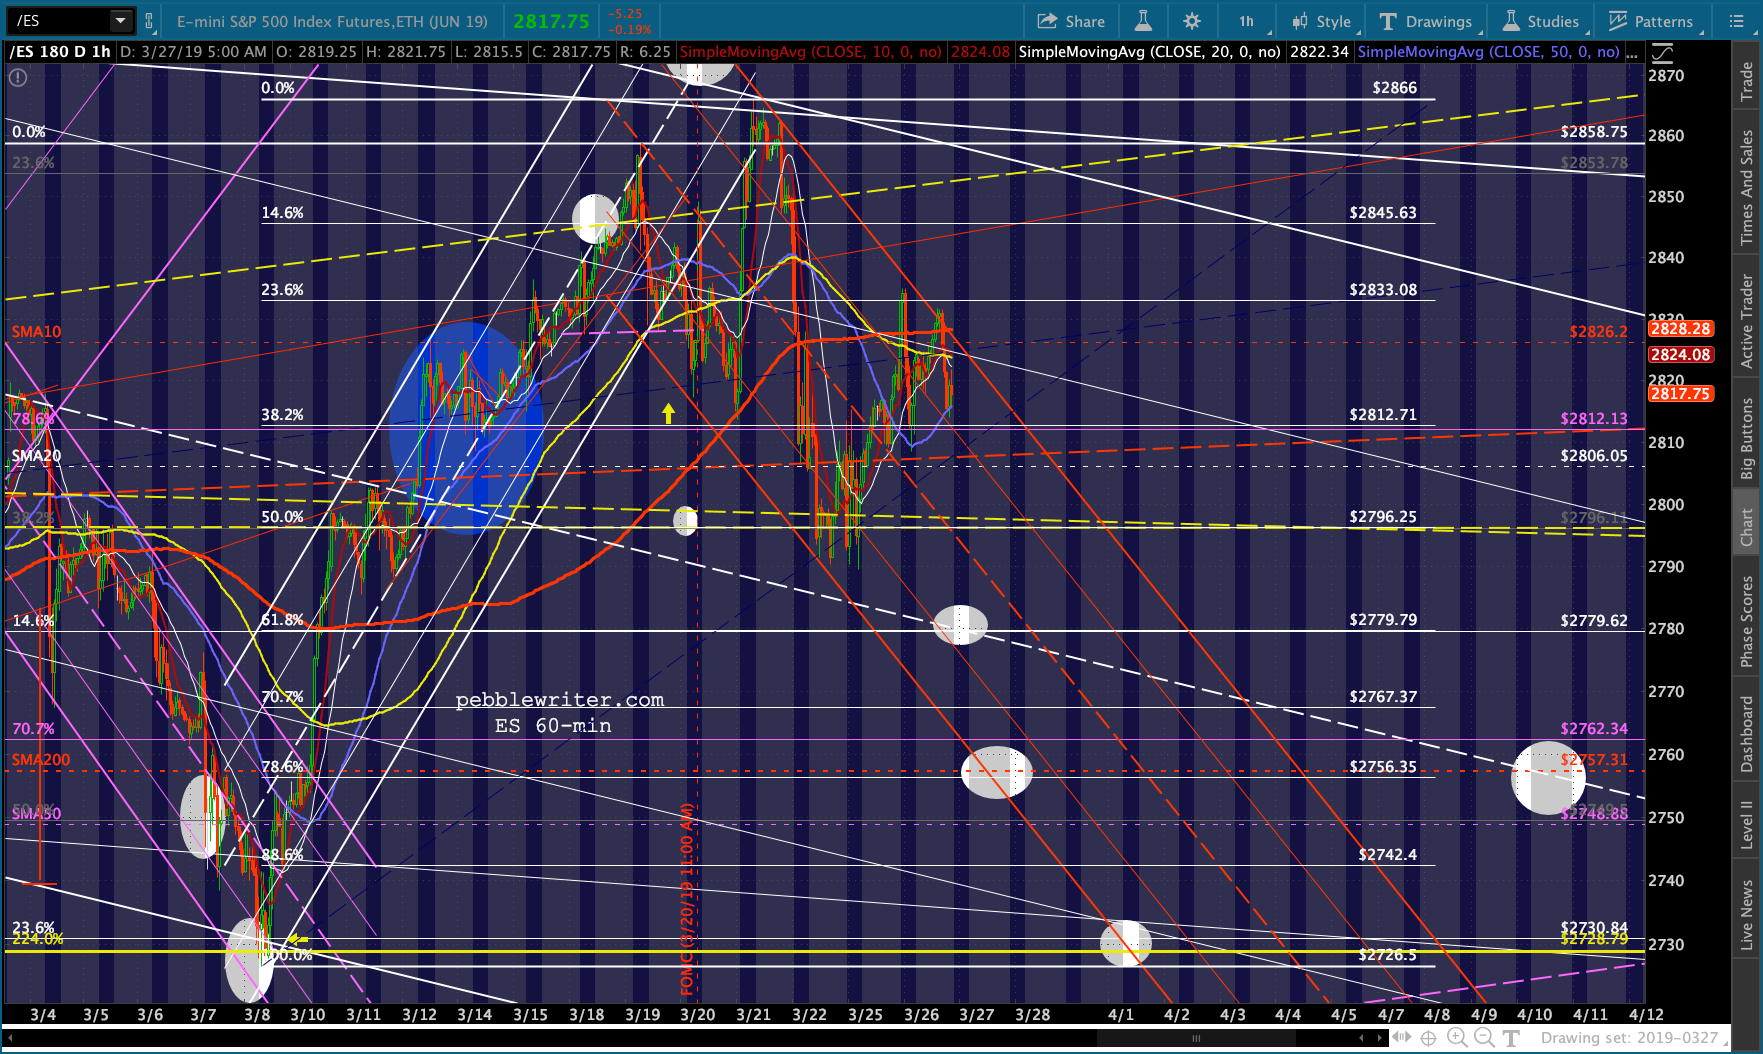 As does SPX’s:

 Despite its bounce at the midline, AAPL is still below its SMA200.
  VIX has TL support. Now if it will just hold it… In speaking with a buddy of mine in Switzerland, I suggested VIX is in a fine position to pop to at least 30 over the next couple of months.
I’m not a big fan of options, but for those looking for an outright gamble the May 30 calls are going for the quite reasonable price of .35 each. 10Y rates are still under pressure, with the 2Y reaching potential support.

 The currency picture… EURUSD has yet to make its move.
 While USDJPY is taking a pause, probably before the upcoming dip to the .618.
 RB is retreating from our upside target at the yellow channel top and looks likely to backtest its SMA10 very soon, with the SMA200 at 1.7837 the next level of support.
 CL remains the biggest wild card, with the 2019 as 2015 analog still suggesting a big downturn in the weeks ahead.
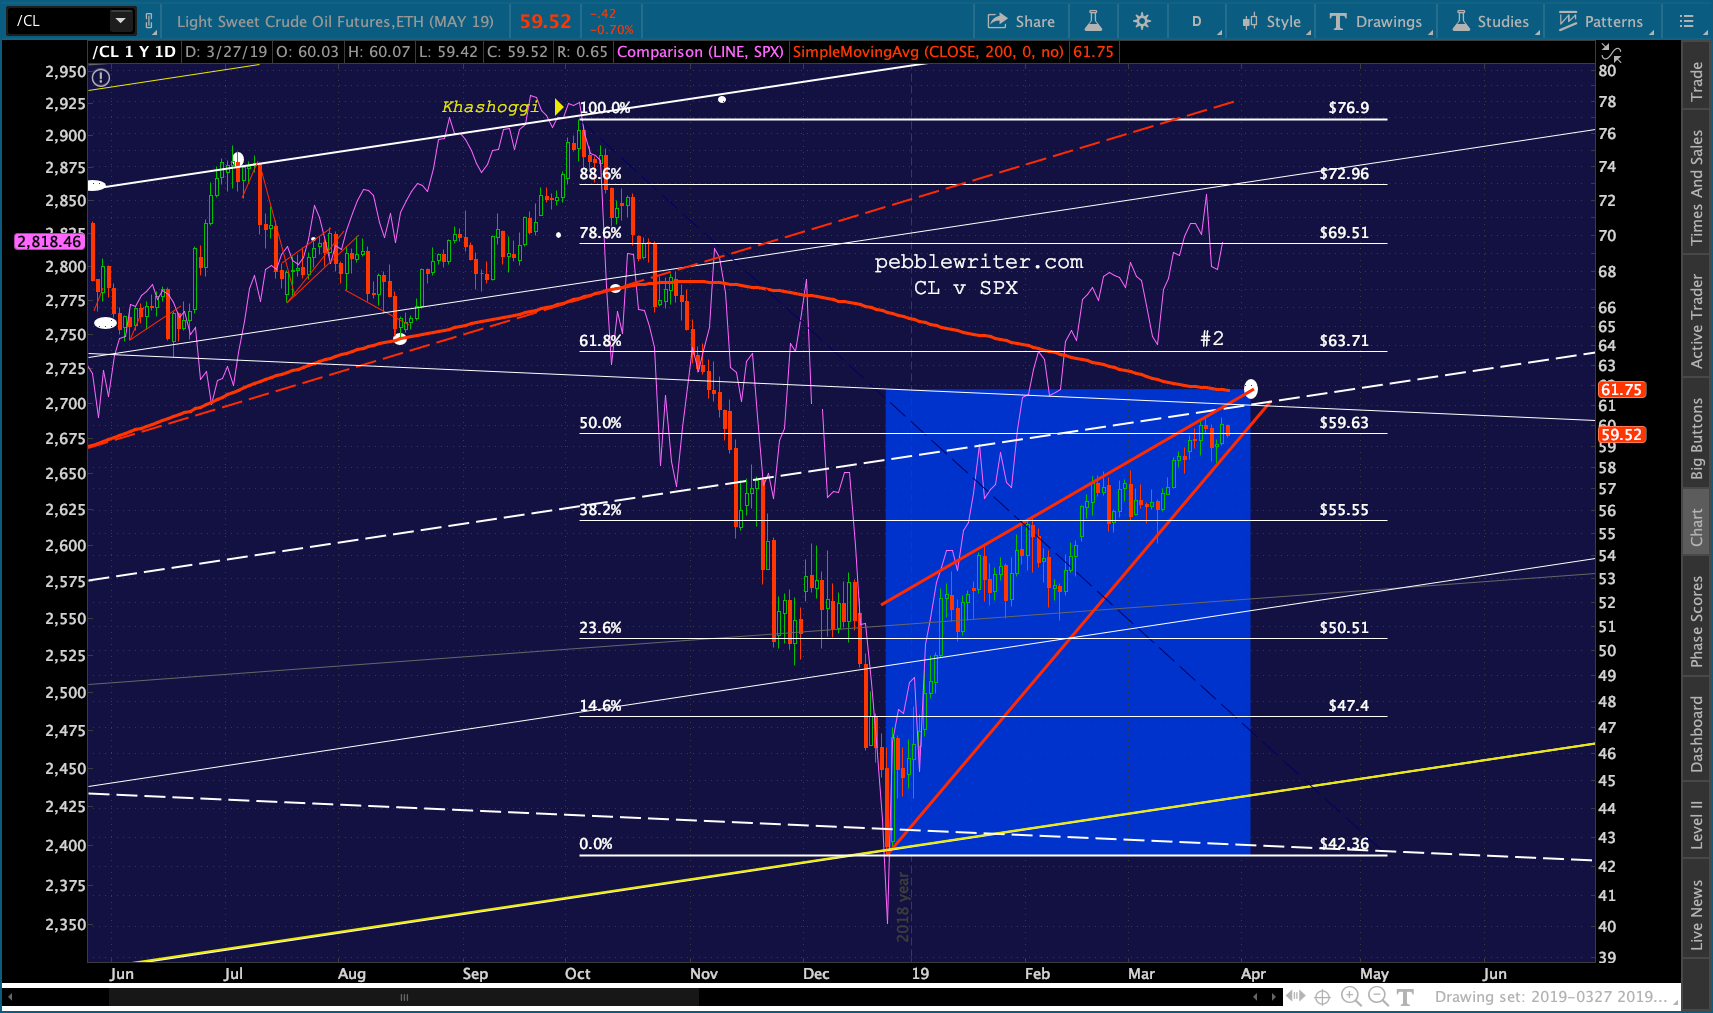
 The chart below isn’t a forecast per se. It merely shows what a repeat of the 2015 decline would look like.
 I’m going to sign off for the day. I have two meetings and will use the time in between to try and finish the big picture post.
GLTA.
UPDATE: 10:30 AM
Build in oil, draw in gas.