

Looking at the latest housing starts data…this is not a recovery. This is a patient who was shocked back to life by QE but is slowly slipping into a coma.
 The rest of the data is just as depressing, including the rate of SF price growth which is pretty clearly rolling over.
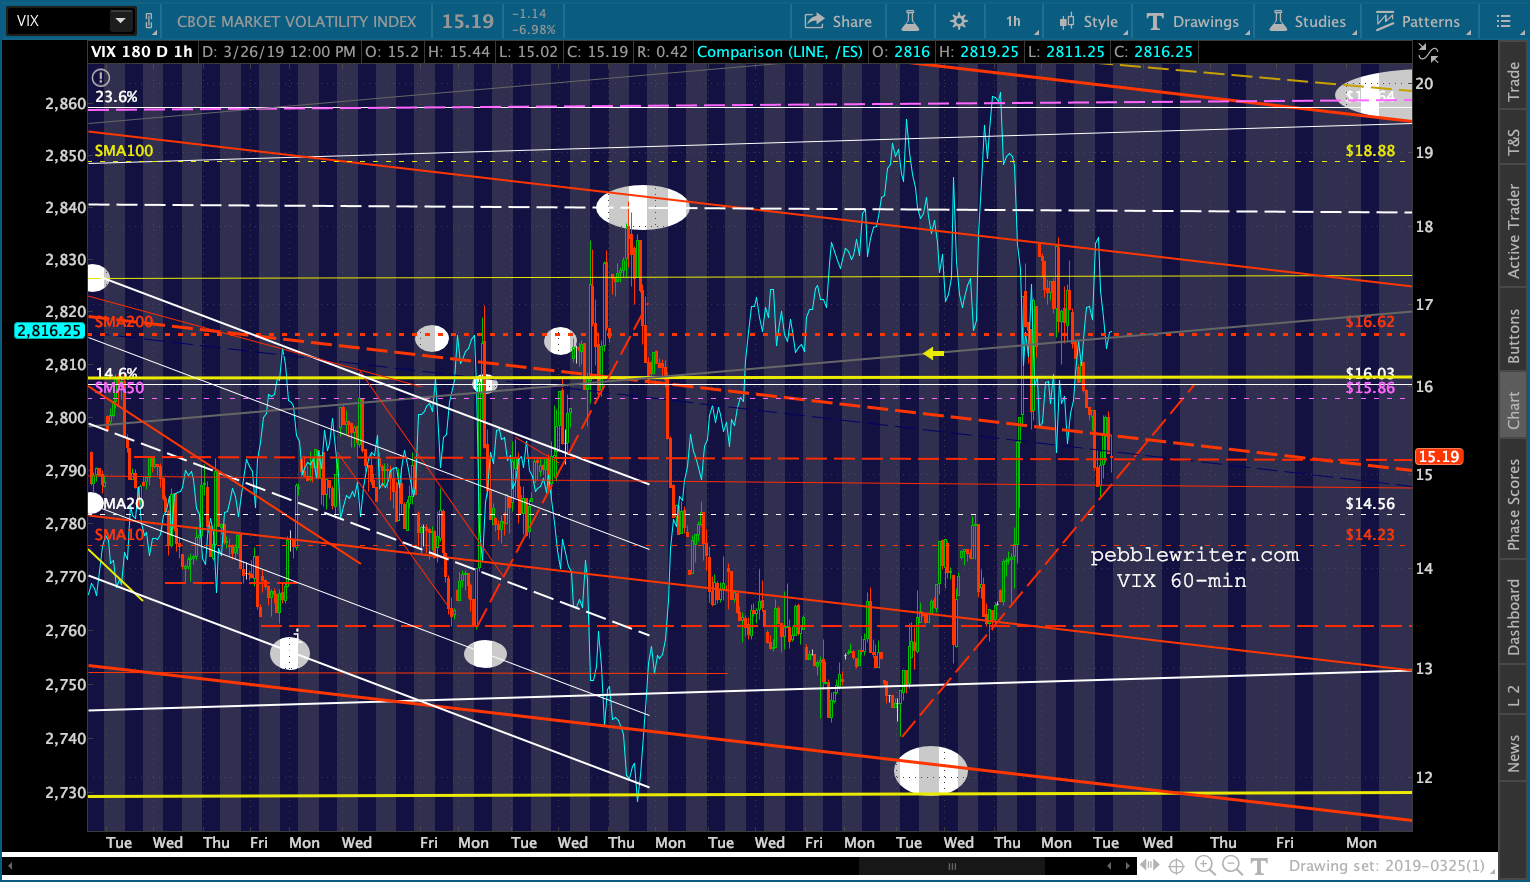
 The algos have ignored the data, preferring instead to focus on VIX’s retreat back below its SMA200 in the after-hours…
 …and AAPL’s rise back above its.
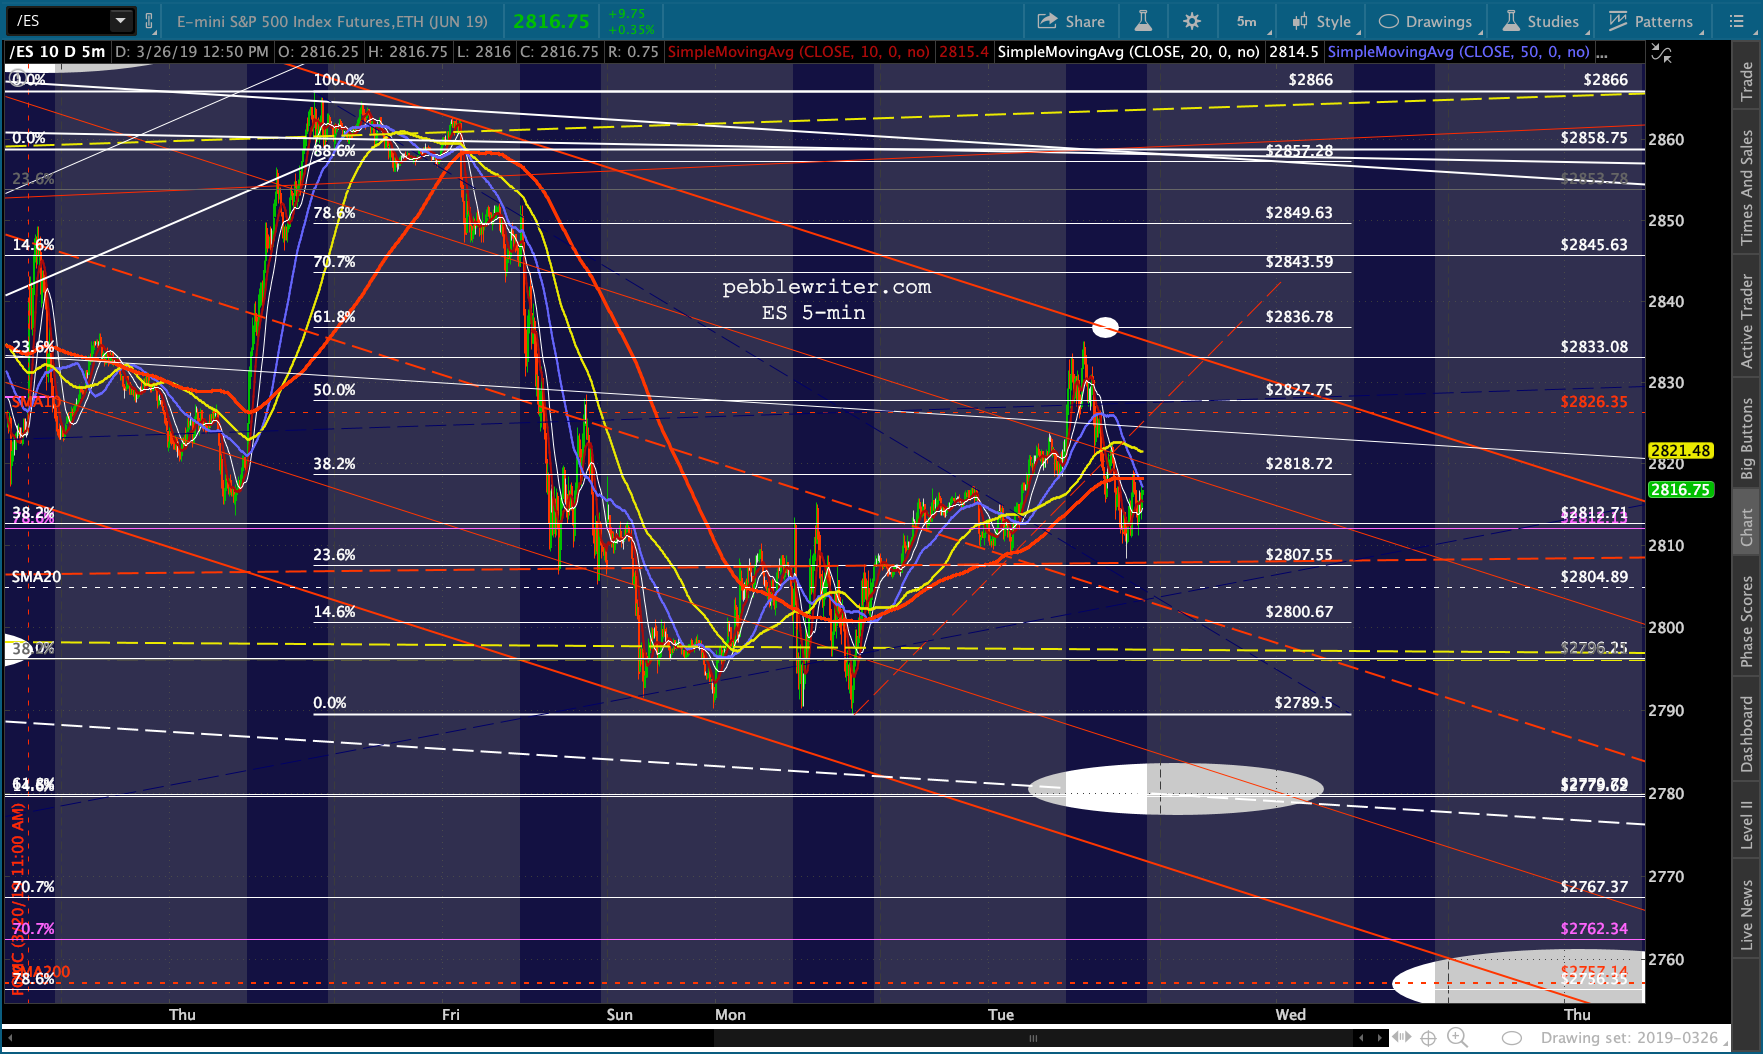
 ES is angling for a 10-DMA backtest — an important line in the sand.
 Thank goodness consumers are still confident. Oh, wait…
 continued for members…
The SMA10 is right about where the white channel .786 line lies.
 Interesting that it’s happening as VIX tests a major channel midline.
 I’m still looking for COMP to backtest its SMA200.
 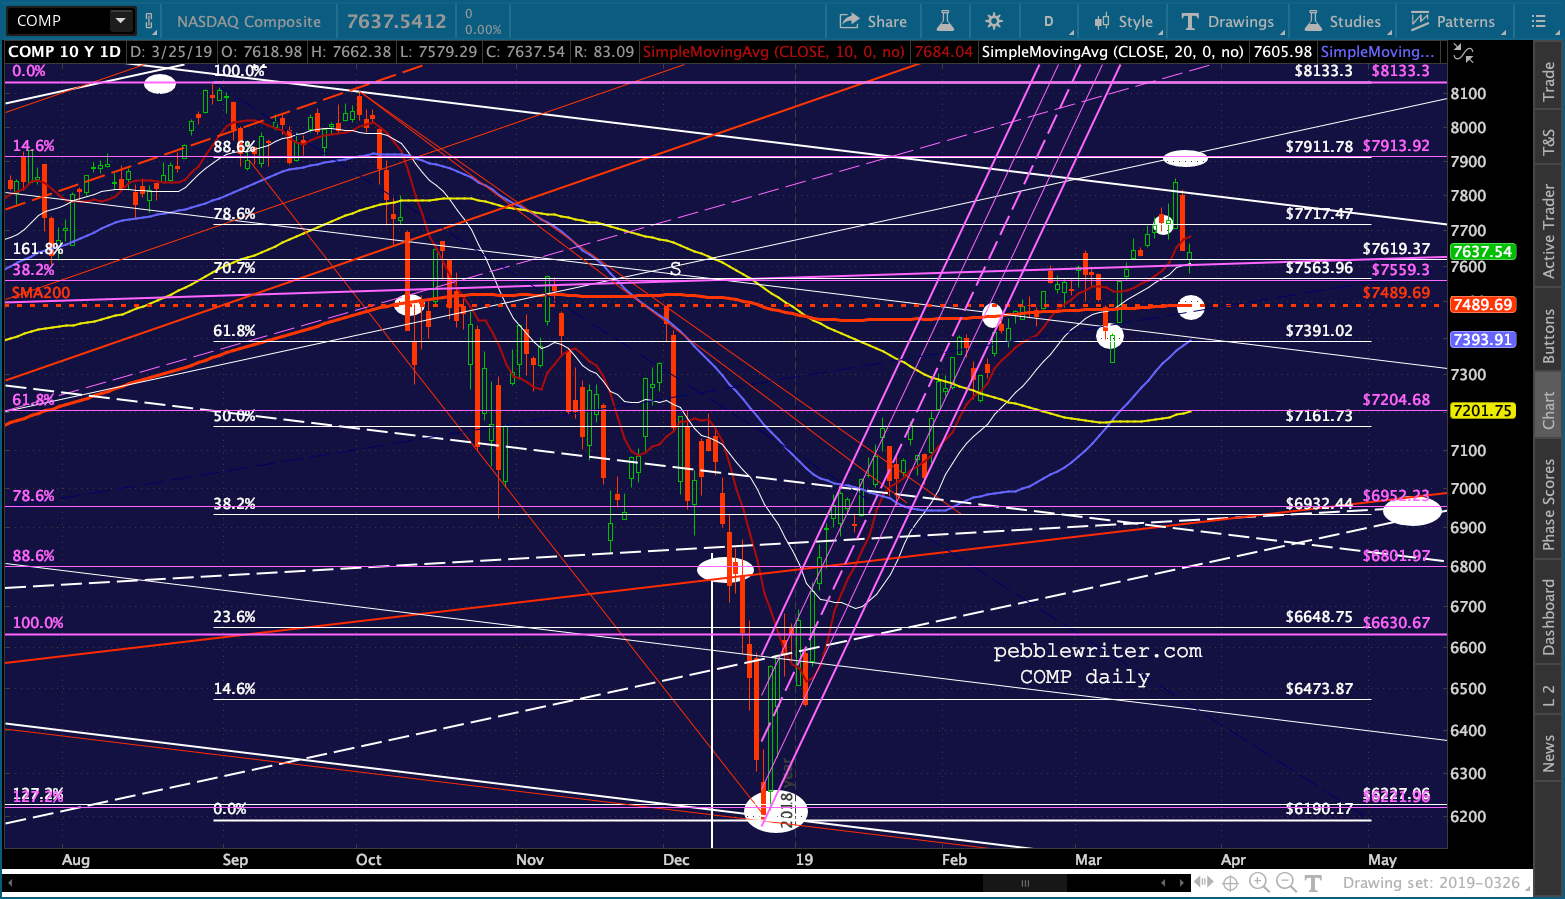 SPX is set up similarly.
 RB has now officially tagged its .786 Fib, with the yellow channel top just above at 1.98ish.
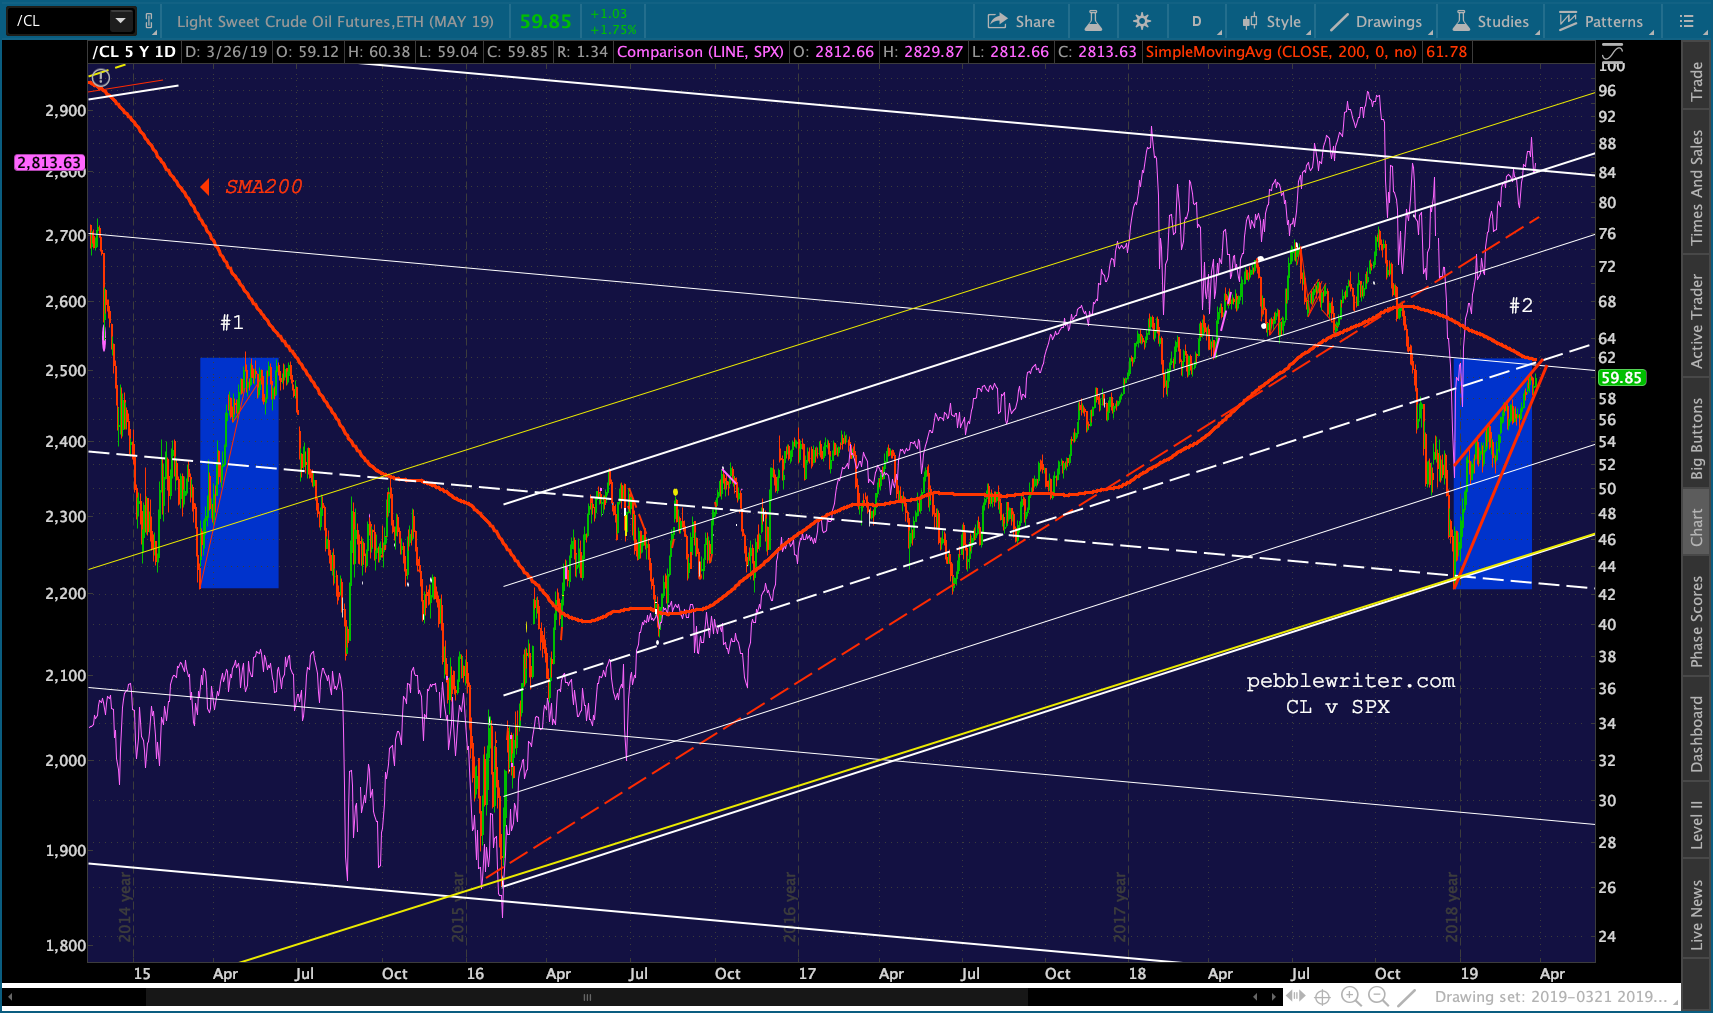
 Though, CL is still short of its SMA200 as it was in 2015.
 On the currency front, EURUSD’s slide (still shunning the SMA200)…
  …is lending DXY strength (note the divergence with TNX!)…
  …as is USDJPY’s continuing bounce.
 Even the 2s10s is helping with this bounce.
 Though TNX is still broken down…
  …and ZN is still broken out.
 Bottom line, we’re getting the kind of nice bounce we talked about based largely on moves in currencies, VIX and oil/gas which shouldn’t last.
The decline we charted last week [CLICK HERE] is ongoing. I know it’s hard to be confident, as we only scored 2.6% before yesterday’s bounce got started. But, that’s the point of bounces like this – to shake out weak bears.
IMO, the decline merely got ahead of itself. We’ll know for sure if/when ES drops back through its SMA10 or pushes above the red channel top at 2837ish.
Remember, SPX’s SMA50 is fast approaching its SMA200 – a golden cross. As we discussed last week, this could be a game changer or a really good head fake as we saw in 2015. 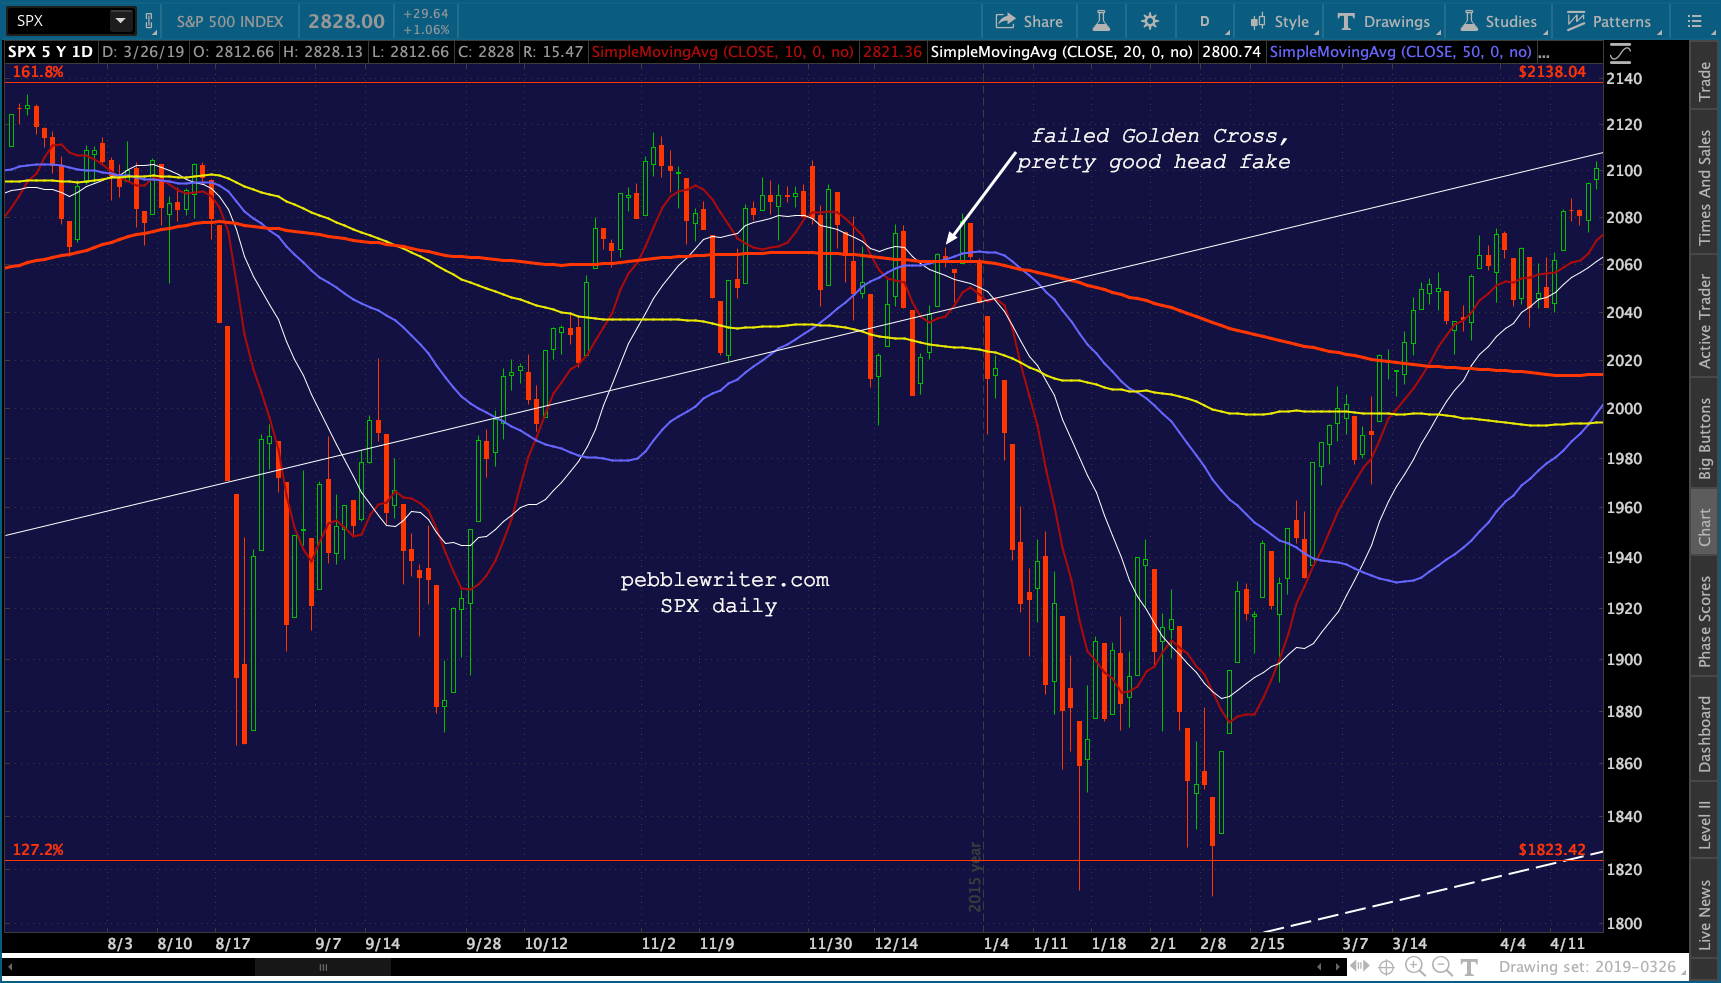 I’m betting on the latter — though we’ll find out before the end of the week.
More later…
UPDATE: 12:35 PM
Decision time for ES, which is testing the red TL from yesterday’s lows as the SMA5 200 approaches the .382 Fib at 2818.72. A failure to hold either would probably unwind the last two days ramp job in one fell swoop.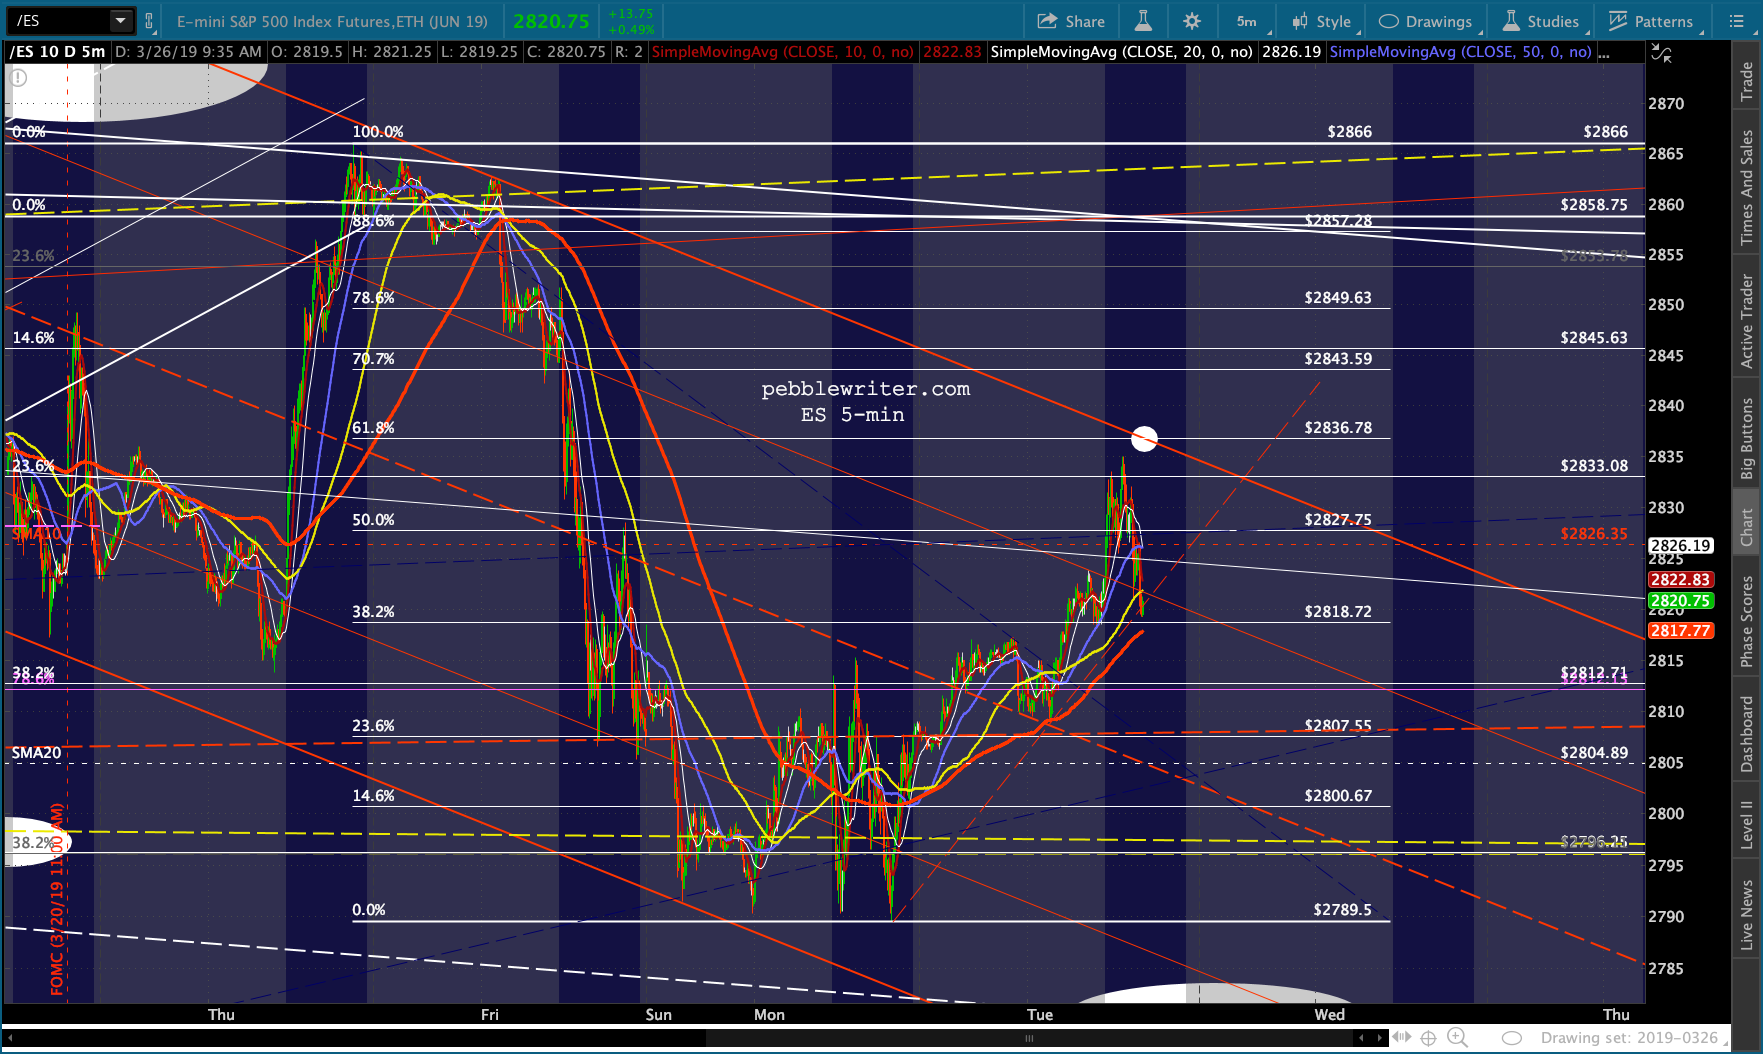 Just a reminder, we’ll get API inventory data after the close and EIA data tomorrow morning. Nice looking rising wedge on CL.
 UPDATE: 3:50 PM
If the current pattern in RB/CL were the same as in 2015, it would peter out by April 2 — presumably as CL reaches its SMA200 — presenting a serious challenge for stocks. While CL seems to have a little further to go…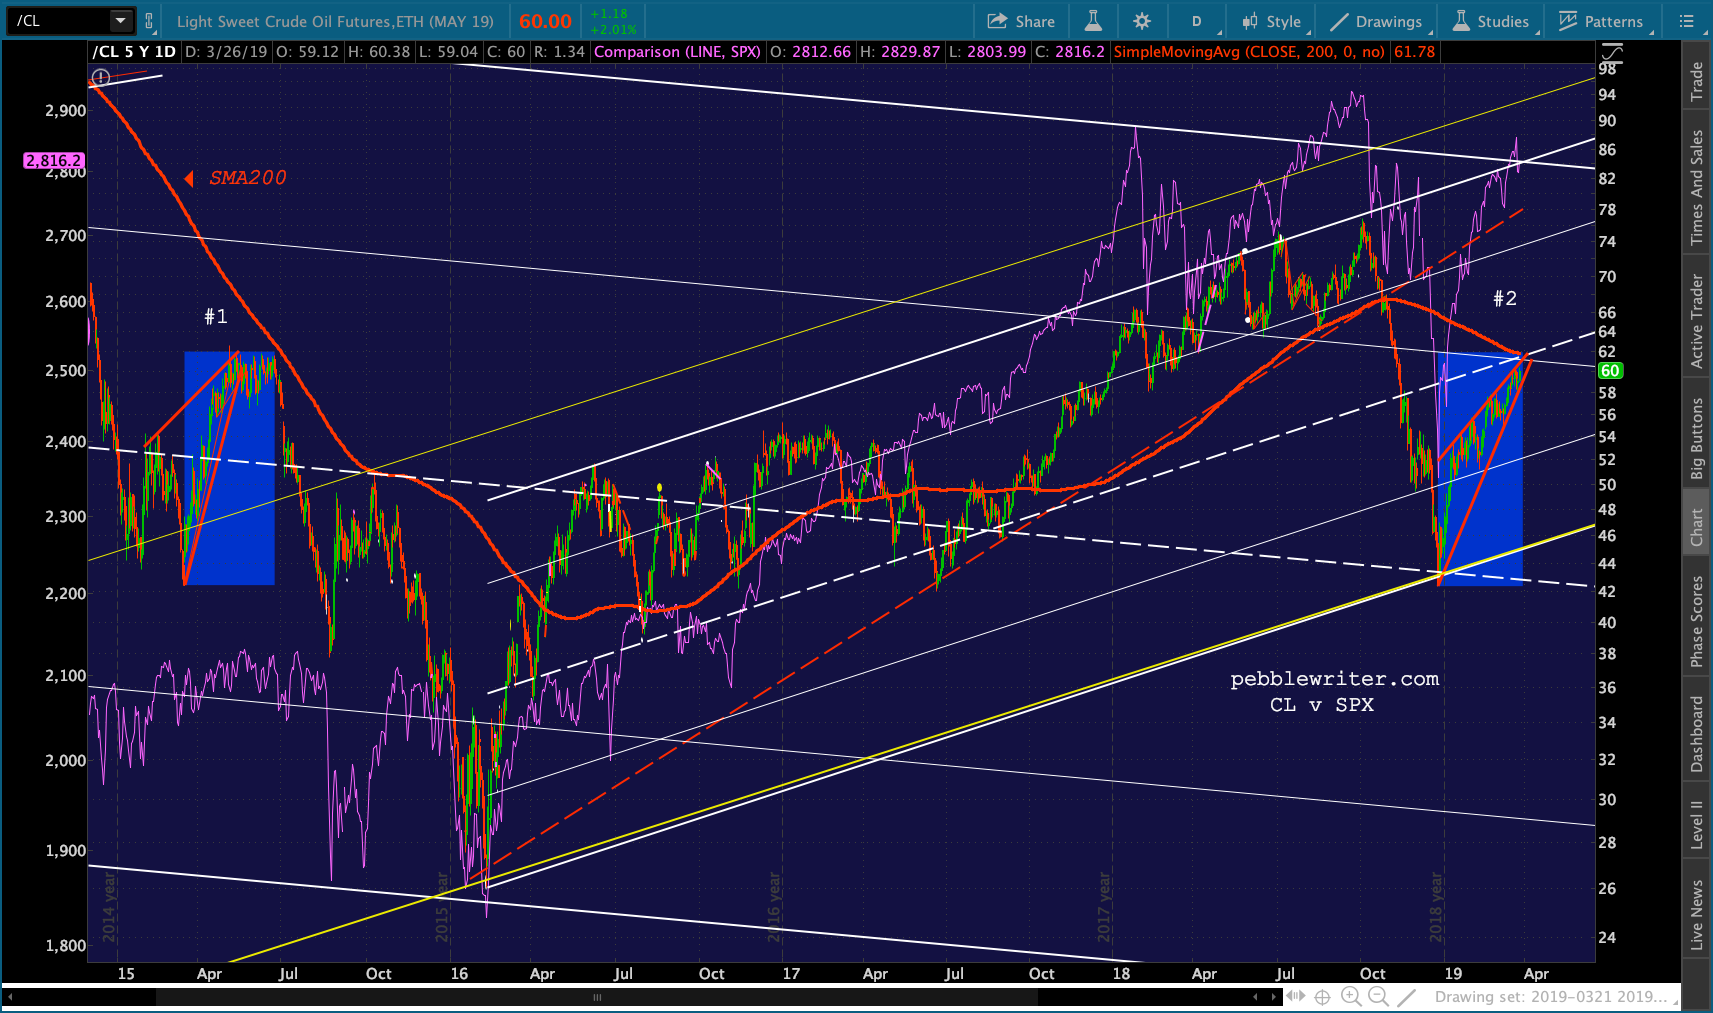 …RB just tagged the channel top at 1.98 and is reversing. I’d revert to short here with loose stops.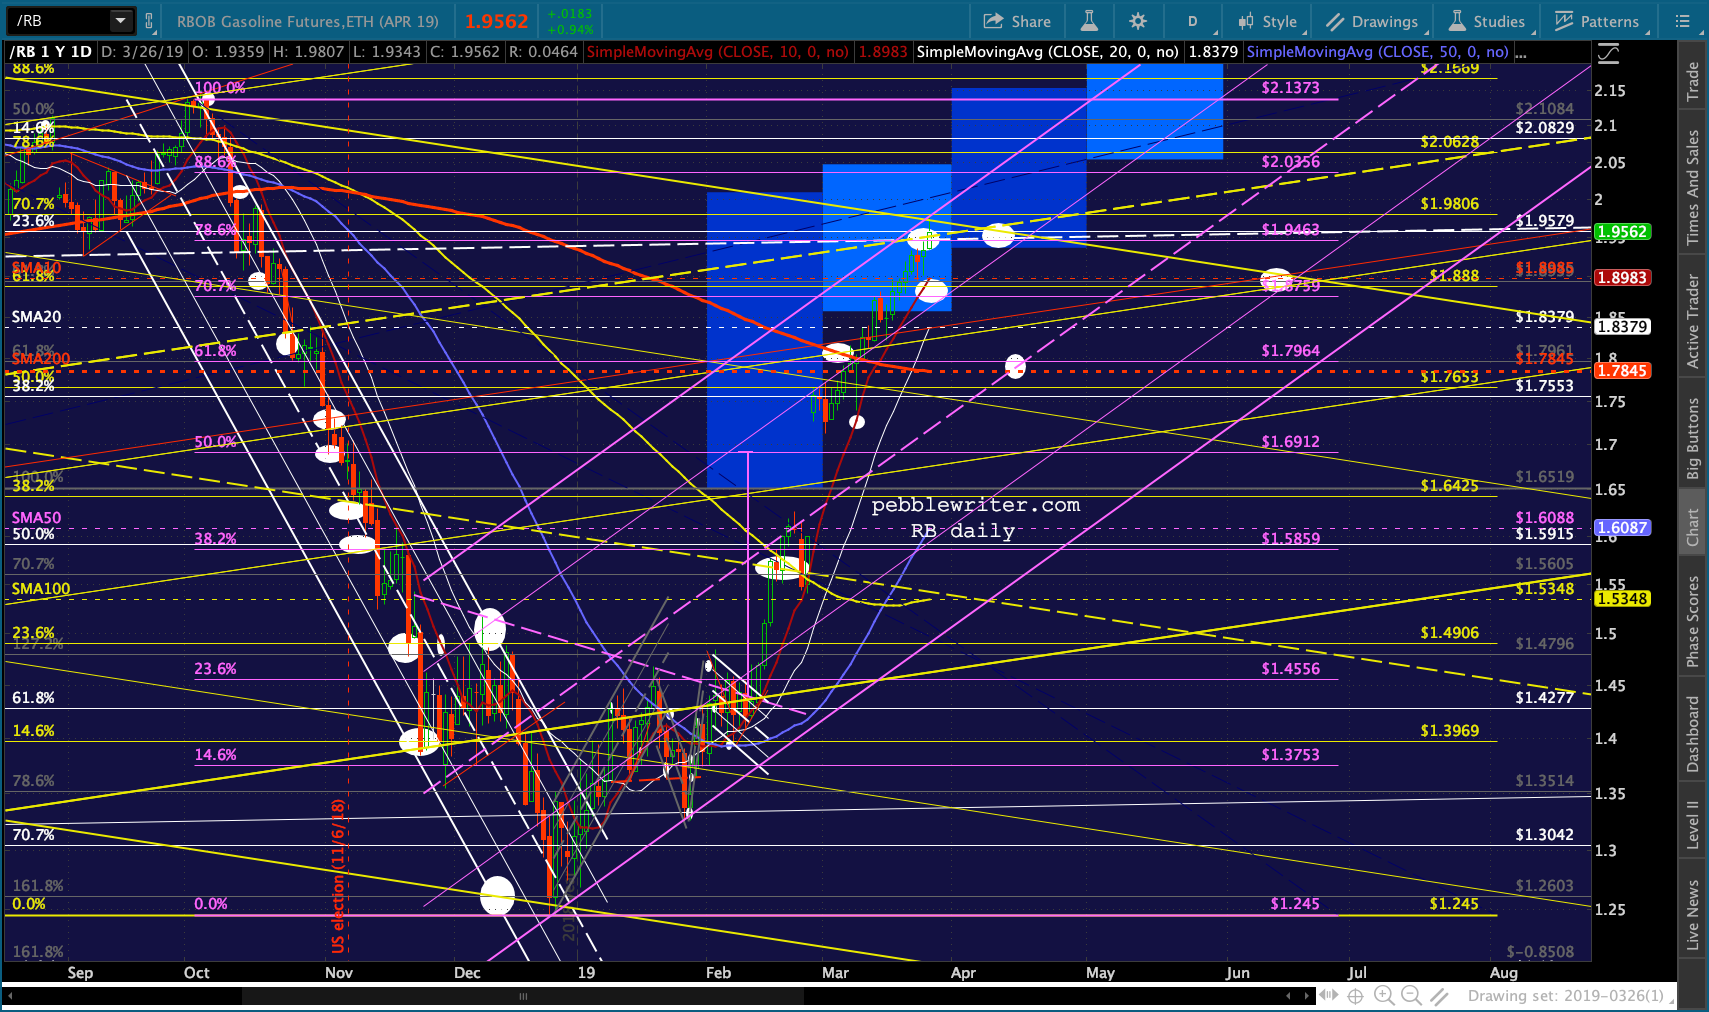
 By my calculations, SPX would need to average a 24-pt drop per day in order to avoid a golden cross altogether. This would imply reaching 2703 — a 4.1% decline — by April 2 or so.
Stay tuned.