After being stuck in a textbook triangle pattern for almost six months, XLF finally broke out last week.
We noted its having reached overhead resistance a few weeks ago [see: Yield Curve Model – Correction Imminent.] At the time, the 2s10s was threatening a breakout which, per our model, suggested a downturn for equities in general and XLF in particular. The 10Y did, in fact, reverse as expected and XLF dutifully tumbled – but, to a higher low. By Oct 30, a triangle was very well established and we were again facing a break out vs break down decision. Note that XLF had dropped through its SMA200 and was in a bearish SMA10/20 alignment.
  Had interest rates continued falling, I have no doubt that the triangle would have broken down and XLF would have reached the .618 Fib at 21.06. Instead, the 10Y popped back above its SMA200 (the yellow arrow)…
 …and XLF got a much-needed bounce back to the top of the triangle. Yes, again. This time, however, TPTB were ready. After bumping into the top of the triangle on Nov 5 and 6, XLF received a fabulous gift.
The 10Y gapped sharply higher, again breaking above the SMA200 it had fallen below and even above the top of the rising white channel. It was a massive move from 74.8 bps to 97.5 bps (point 6 in the chart above) in just two sessions thanks to the announcement of a vaccine from Pfizer and better than expected employment data [see: Vaccine!]
As a result, the 2s10s broke above overhead resistance.  A steeper yield curve is theoretically the solution to the banks’ woes. Though, historically, major breakouts in the 2s10s have led to equity crashes.
  Even for XLF.
  We’ll see if this time is any different.
In the meantime, XLF has backtested the midline of the rising white channel from its 2009 lows… …following its very obvious failure to break out to new highs in February which resulted in its 44% crash. Note that a failure to push above the midline means at least a backtest of the triangle top around 25.26. Much will depend on some very fancy footwork by the Fed.
 The Fed’s exercise in ZIRP, which served as a lifeline to many sectors of the economy – not to mention the stock market, is a weight around the neck of the financial sector.
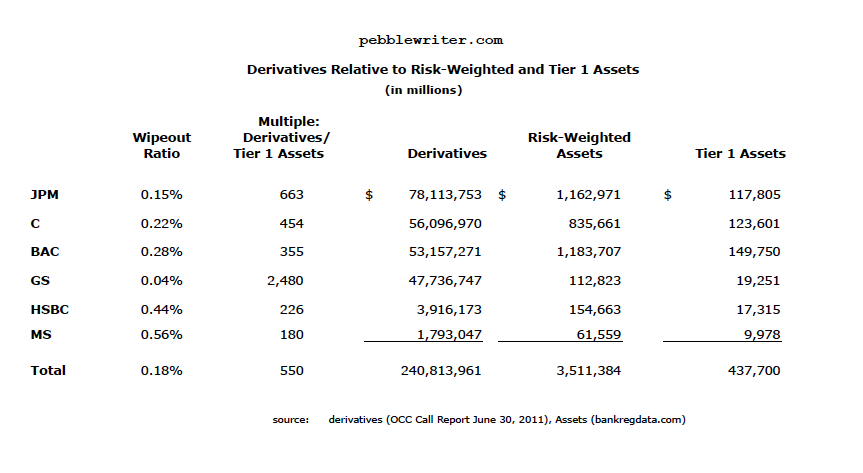
Rising rates and a steeper yield curve might be okay with $7-8 trillion in debt. But, at $28 trillion, it’s a tad scary. Can the Fed find a way out of the corner into which they’ve painted themselves? Can they maintain the disconnect between the S&P 500 and the pandemic-stricken real world in which 30% of Americans are expected to be infected and another 200K are expected to die?
“We’ll spend the next three months probably infecting another 15% and get to 30%, maybe more,” [former FDA Commissioner Scott] Gottlieb, now a CNBC contributor, said on “Squawk Box.” “Thirty percent assumes the current run rate if things don’t get any worse.”
Stay tuned.