Year: 2021

  • VIX’s Journey

    Determining what the charts say is usually pretty easy. Determining when central bankers will hit the panic switch is considerably harder.

    When the markets melted down in Feb-Mar 2020, some very important support levels were tested. The Dow, for instance, was propped up precisely as it arrived back at post-2016 election levels — fortunately for Trump.One of the most consistently effective tools in propping up stocks has been hammering vol into submission. The algos and everything which keys off them – about 90% of daily trading volume – pay very close attention to VIX. It’s not an overstatement to say that VIX is the tail that wags the market’s dog.

    VIX had soared from the low teens in late 2019 to 85 by Mar 18, 2020. On that day, two days before stocks bottomed out, it began a punishing journey back to its former lows which continues to this day.

    The falling white channel below is testament to its precision, particularly once the Jan 27, 2021 high was in place. The subsequent highs all represented turning points, with VIX collapsing at the top of the channel each and every time — until Sep 20.

    This time VIX not only poked above the channel top, but remained up there for 13 of the 17 subsequent days. Not only that, but its chart supported/signaled a rise to 32.

    The move was logical in that SPX’s rapidly rising 200-day moving average was almost within 10% of its recent highs and was aligned with the bottom of a channel which had guided the index higher since mid 2020.

    Since SPX had fallen through its SMA50 for the first time in a year, it seemed as though central bankers had tacitly agreed to allow an actual correction, a 10% drop to the 200-day moving average and channel bottom.

    On Sep 20, however, someone pushed the panic button. Since then, VIX has been sliced in half and has fallen back into the falling white channel from which it broke out. Furthermore, it is threatening to break down below a trend line of support dating back to 2017.

    As a result, SPX broke out of its bearish patterns and made a new all-time high yesterday.  ES joined it today. From a charting standpoint, this busts many — though not all — of the bearish scenarios. I emphasize this is merely a charting or technical analysis perspective. There are obviously a number of fundamental and arguments for higher prices, not to mention TINA, FOMO and BTFD.

    continued for members(more…)

  • Charts I’m Watching: Oct 21, 2021

    Futures are off slightly this morning, passing on the opportunity to make new highs in the after-hours.

    continued for members(more…)

  • Judging the Fed

    In an excellent interview on CNBC this morning, Paul Tudor Jones echoed what many on Wall Street have been thinking and we have been writing for the past year or so.

    Has the Fed committed a policy mistake? Most certainly. Even more outrageous, it did so deliberately.

    If yours truly, sitting in his home office with a Mac Pro and a public school MBA, can accurately forecast soaring CPI long before the convenient supply-side disruption pretext came along — then the Fed’s brain trust of MIT grads with supercomputers certainly saw it coming even sooner. How did they respond (besides protecting their own portfolios)?

    1.  changed their inflation target language to accommodate higher inflation
    2.  lied about their expectations of it being transitory
    3.  continued to pour $120 billion per month into fixed income markets
    4.  manipulated interest rates lower with said injections of QE
    5.  thereby eliminating price discovery in bond markets, potentially permanently
    6.  reinflated bubbles in virtually every financial and real asset market
    7.  reduced housing affordability to 13 year lows
    8.  enriched the top 10% of Americans by $17.5 trillion
    9.  subjected the bottom 50% to contracting real discretionary income

    The kicker is that they are still pouring $120 billion into the markets every month, even though they have publicly admitted that inflation has “surprised” to the upside and is not transitory. This is in stark contrast to Powell’s assurances that the Fed would use its “tools” to prevent such an occurrence.

    Now, I don’t for a minute believe the Fed is an evil cabal bent on ruining the middle class and subjecting the poor to unbearable hardship. I believe they entered into the latest round of QE with the intention of staving off an economic collapse and saving financial markets from crashing even further. They successfully accomplished this.

    But, somewhere along the way, probably in June 2020 as SPX fell below its 200-DMA for the second time, the conversation turned to making sure the rally continued. It took almost 10 weeks, but on Nov 4 SPX rose above 3393 for the last time.  It hasn’t looked back, bouncing on its 50-DMA over and over until last month when it finally backtested its 100-DMA – registering a meager 5.9% decline.

    The Fed has demonstrated the astounding power of its tools: ever-increasing oil prices, currency manipulation, interest rate manipulation, and the periodic crushing of vol. But, it has caused, not moderated, higher inflation.

    continued for members…
    (more…)

  • Netflix’s Big Day

    I love charting NFLX. It’s one of those stocks whose chart almost always makes perfect sense regardless of the fundamentals or the news of the day.

    The last time we discussed it on this website was Sep 10 when it looked vulnerable to a pullback.

    I’ve had a couple of inquiries about NFLX. The charts are not positive at the moment – not since it topped out in the rising white channel after seeing its huge rising wedge break down.

    It was a bit of a gimme, and the stock slid almost 8% before stabilizing. Several other reversals have been just as easy to pinpoint [HERE, HERE and HERE.]

    Since the company is releasing earnings today and seemingly everyone is watching it closely, let’s see what the charts show.

    The gently rising white channel was broken out of on Oct 5 and NFLX completed a nifty little Crab Pattern good for a 13.6% gain from its Sep lows.The breakout and backtest, combined with a very deliberate and carefully constructed rising wedge [thanks, no doubt, to timely share repurchases] makes for a very bullish looking chart.Does that mean it’s destined to continue higher?  We could go ’round and ’round regarding the news/controversies (Dave Chappelle, Squid Game, etc.) and its overly aggressive (IMHO) production slate, and its considerable competition.

    But, at the end of the day, NFLX’s chart tells us all we need to know. In this made-to-order market of ours, buoyed as it is by central bank liquidity, share repurchases and zero interest rate policy, the company is likely to do whatever it takes to remain above the white channel top at 619ish – only 2.8% below current prices.

    Should it fall below 619, that rising wedge will have fallen apart and the Fibonacci Pattern targets would come into play, targeting the mid-500s.

    Stay tuned.


  • Charts I’m Watching: Oct 19, 2021

    The breakout is in full bloom, raising the question of whether it’s a deep retracement or the path to new highs. VIX’s recent breakdown and bearish (bullish for stocks) 10/20 cross would argue the latter…

    …though lower lows would be more convincing.

    continued for members(more…)

  • A New Path?

    Futures are off about 20 points this morning, but it’s last week’s breakout that has us wondering whether the downside case is still intact.

    continued for members(more…)

  • At The Brink

    I didn’t set out to be an FX analyst. About the only time I ever focused on currencies was when planning a trip abroad, which seemed to always line up with USD lows. Eight dollars for a croissant? Really?

    Ten years ago, however, I began to notice how closely aligned equity performance was with moves in the USDJPY and EURUSD. That curiosity blossomed into a robust appreciation of the fact that many currency moves have become tools for central bankers to support equity markets.

    On April 23 [see: A New Catalyst] despite the fact that USDJPY had been locked in a falling channel since November 2016 and was seemingly breaking down, I added the breakout target shown below due to what I reasoned was stocks’ vulnerability at the time.

    This morning, USDJPY reached that very target for precisely that same reason.

    Likewise, EURUSD was seemingly breaking out of a downtrend. I expected the breakout to ultimately fail and for EURUSD to very gradually backtest the channel from which it had broken out. This would be the least disruptive outcome for stocks.A few days ago, EURUSD completed that backtest – after several more headfakes along the way of course.My point isn’t that I’m any smarter than other FX analysts. It’s simply that we can usually count on central bankers to manipulate whatever is handy (interest rates, currency exchange rates, vol, etc.) to prop up stocks.

    This morning’s move was fairly predictable only because it was apparent that the BoJ (the reigning world’s best market manipulators) wouldn’t be satisfied with NKD’s backtest and reversal at its 200-day moving average.  Thanks to USDJPY’s strong overnight move, the Nikkei had no trouble spiking through that particular overhead “resistance.”

    At no time does the manipulation get more frenzied than around options expiration day.  Today is one of those days and, as usual, stocks have gone hog wild in an effort to cause as many of the puts purchased over the past month as possible to expire worthless.

    The falling channel which has faithfully guided stocks lower since our correction call in early September has seemingly been busted. Of course, that was also the case on September 16 after ES had popped through the yellow trend line and was apparently breaking out of the falling white channel going into the close.

    The ruse continued into options expiration on Sep 17, at which point the bottom fell out and stocks suffered their worst two day plunge in months.

    Why does it matter, you ask? Because we’re in a very similar situation all over again. Based on the market action yesterday and today, you’d be crazy to short stocks. Which is exactly what the market makers want you to think.

    continued for members(more…)

  • Don’t Hold Your Breath

    If you’re looking for producer prices to level off and take the pressure off consumer prices, don’t hold your breath. If anything, September’s print should serve as a strong reminder that something’s gotta give. Either consumers or retailers will bear the brunt of rising prices, and neither is all that positive for markets.

    Speaking of markets, futures have completed their trip to the falling channel top just in time for OPEX tomorrow.  Absent a world class head fake, this should be the hopping off point for the latest algo-driven bounce.It’s been 5 weeks since we announced a correction watch, with SPX having given up a little less than 6% at its worst. Should there be another leg down, it should be about ready to get started.

    continued for members…
    (more…)

  • Inflation: Still Not Transitory

    It’s almost like a line from a vintage SNL weekend update.

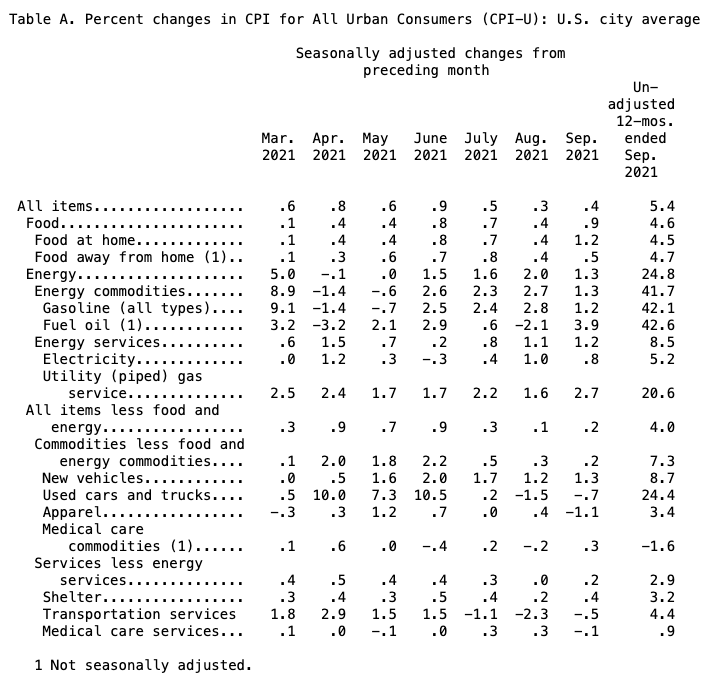
    See if you can find a category in Table A below which is susceptible to price decreases.

    Blame it on supply chain shortages rather than trillions in stimulus if you like, but the current inflation spike is likely to be with us for quite some time. Only the BLS’s cooked books prevented a new 20-year high. It goes without saying that the uncooked numbers are much worse. Take this chart, for instance, comparing actual apartment rental rates to the BLS’ fictional OER.

    Futures dipped back to UNCH on the news, looking as though they might even turn negative. But, the algos were transfixed by VIX’s daily pre-opening dip below its SMA200 and, well, we all know how that works.

    continued for members(more…)

  • We’ve Seen This Movie Before

    This little article on Reuters caught my eye this morning.

    Japan’s new Prime Minister Fumio Kishida noted that a weaker yen would exacerbate Japan’s spiraling wholesale prices (+6.3% last month.)

    Of course, the weaker yen – a result of the yen carry trade – is a big reason why stocks are so high.

    As we’ve discussed many times in the past, the trade has its limits. When the yen weakens significantly at the same time that oil/gas prices are rising rapidly, something has to give.

    Otherwise, you end up with untenable price increases…

    …which lead to untenable inflation……which in turn lead to untenable interest rates (in Japan, anything above 0%.)Now, Japan’s bond market is even more broken than the US bond market. The journey to NIRP has been going on for a long, long time. Given Japan’s 272% debt to GDP ratio, it’s been necessary.

    [The US is expected to exceed that ratio by 2029, but I digress.]  The last time Japan’s producer prices increased this rapidly was in 2014……when CPI also neared 4%. It wasn’t a good look for a central bank which required negative interest rates in order to avoid the appearance of technical default.

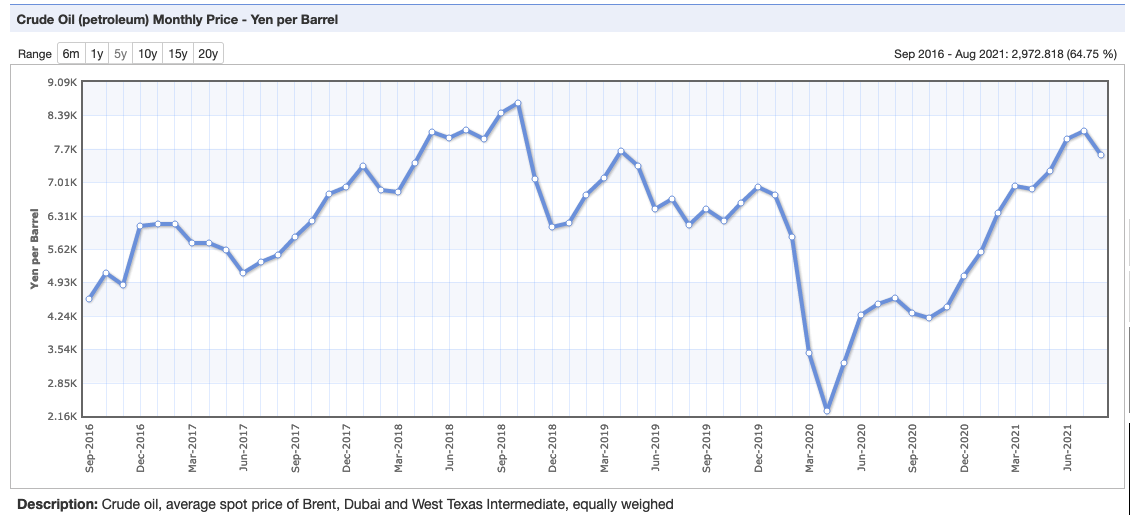
    Then, as now, it was largely a function of sharply rising oil prices.  Clearly, oil prices needed to come down.  But, how could they do that without killing off the rally from 2011’s Fukushima lows?  Easy.  The yen carry trade, which had helped the Nikkei almost double in the two years since Fukushima……came to the rescue. Not coincidentally, USDJPY broke out on the exact same day that WTI broke down.

    The carry trade’s influence on the algos prevented crashing oil prices from also crashing stocks.  And, cratering oil prices prevented the crashing yen from exacerbating inflation. It was a win-win. By the end of the 2014 CPI was down below 0%, 10Y yields were slashed in half, and the Nikkei had risen an additional 20%.

    What if USDJPY hadn’t broken out to offset oil’s breakdown? We got a taste of that in October 2018 when oil/gas reversed lower following Jamal Khashoggi’s murder.  WTI plunged 45% in a little over 11 weeks, while USDJPY shed about 8.7% and stocks swooned by 21%.

    Why does this matter?  We can see from the 10Y chart that rates are testing 0% again, even though the BoJ continues to suppress interest rates. It’s no wonder that rates are breaking out given that broad-based inflation is on the rise.

    Rates are threatening to break out in the US and the euro zone as well. The most expeditious way to get inflation under control is to hammer oil/gas prices lower.  But, how to keep stocks from following suit if, as PM Kishida intimates, the yen carry trade is off the table? How indeed.

    continued for members…
    (more…)