

It was another potential ugly day that turned into a barn burner as VIX followed through on its bearish 10/20 cross and broke below a trend line dating back to November. The day was also about expectations. AMZN, for instance, which had broken down after establishing a pennant pattern dating back to Sep 2 and hasn’t been able to top its SMA10, surged a whopping 4.57%.
  The departure of Jeff Bezos’ nemesis, perhaps? In any case, it wasn’t the only major component of the S&P 500 to spike higher.
AAPL +3.29%
MSFT +3.65%
AMZN +4.57%
FB: +2.44%
GOOG +5.36%
NVDA +2.61%
NFLX +16.85%
With the FAANGs back in business, can we stop worrying about the downside?
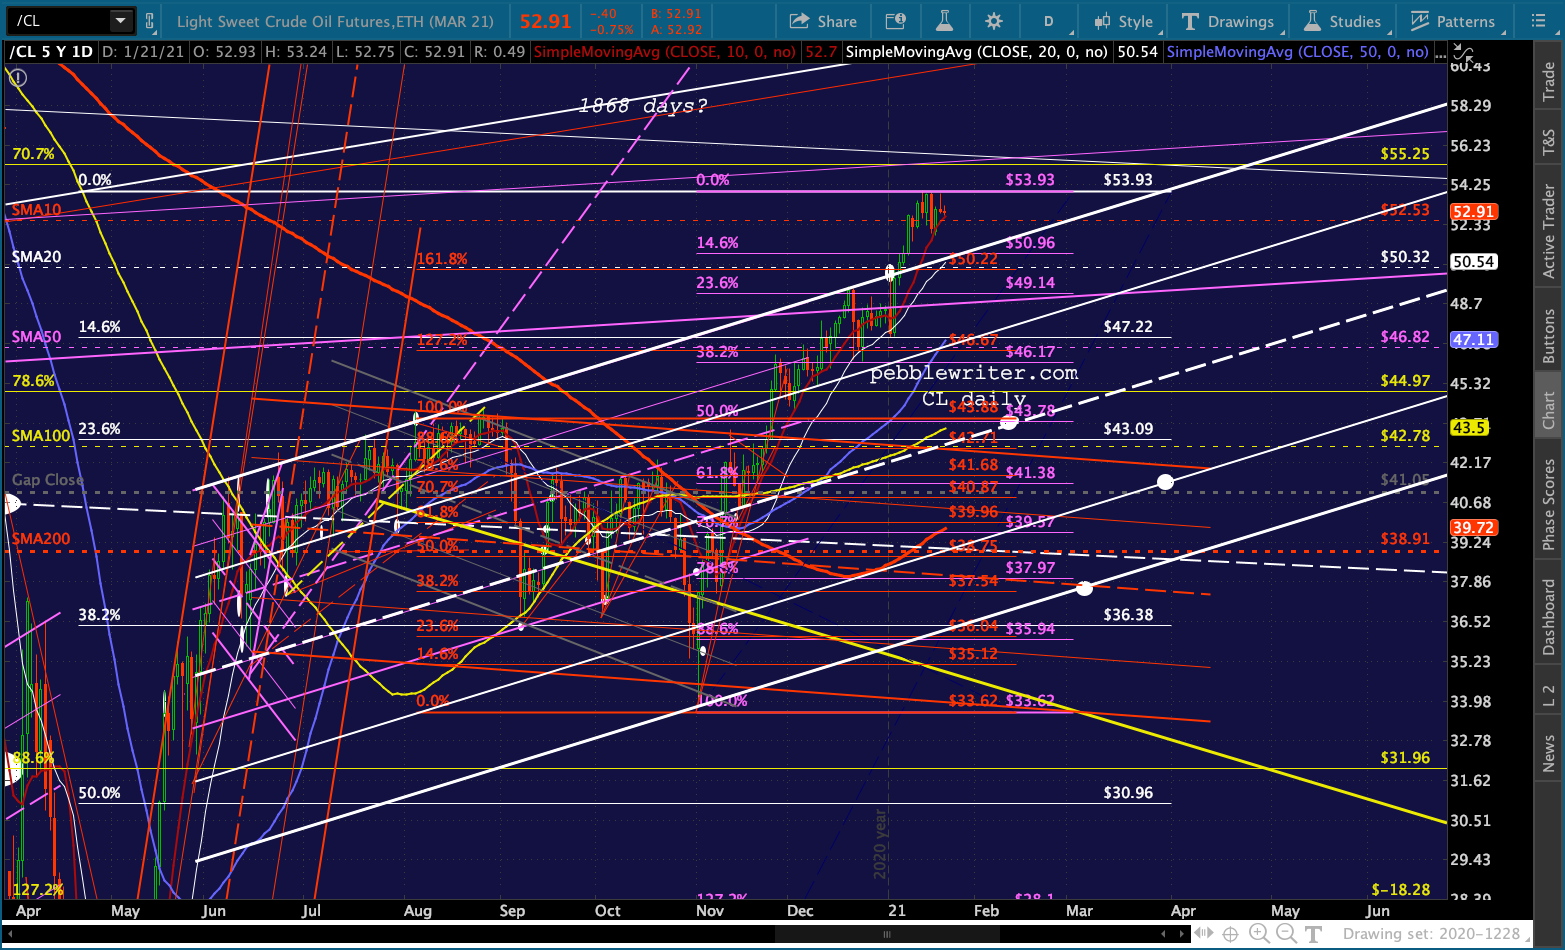
continued for members…At some point, ES/SPX might still want to backtest their 1.272s. ES is one day past the intersection of its red channel midline and 1.272. It’s pretty much now or never.
 SPX faces the same kind of situation with the TL off its old highs.
  But, VIX has clearly broken down. Unless it pushes back above the rising white channel bottom, the odds of a significant decline aren’t great.
 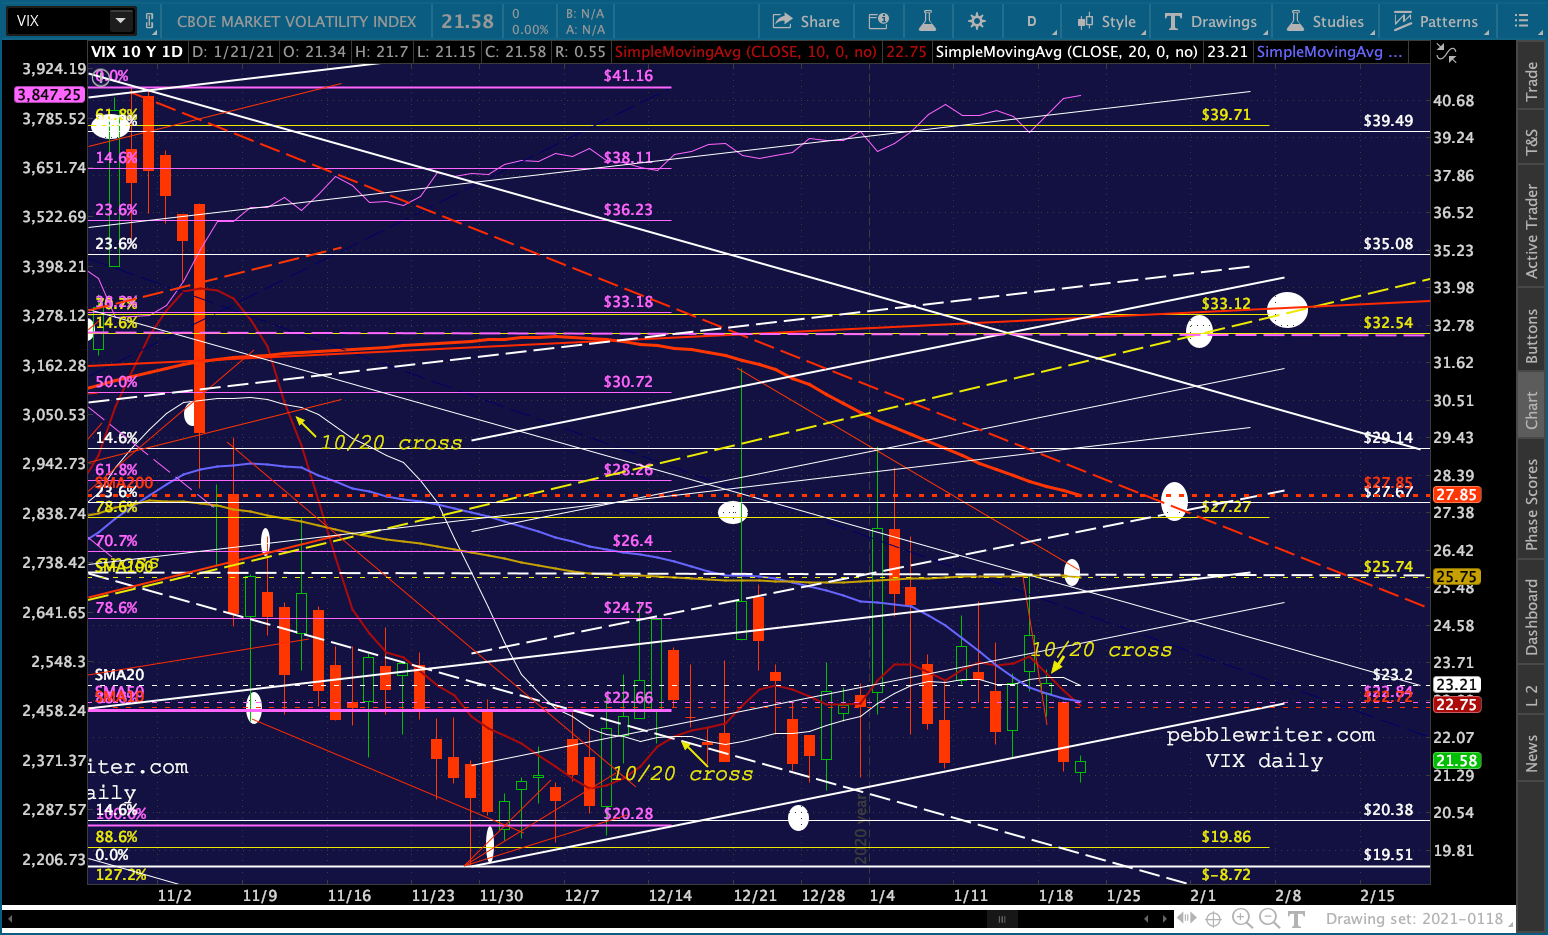 I have some interesting big picture charts to share, but first the rest of the algo drivers.


 UPDATE: 11:30 AM
Sorry for the delay, had one of those virtual doctor appts that dragged on. In any case, it allowed time for AMZN to show its colors.
 Here’s the first of the charts I want to discuss today. Note that COMP has broken above the large rising white channel and even the gray 1.618 extension of the drop last September.
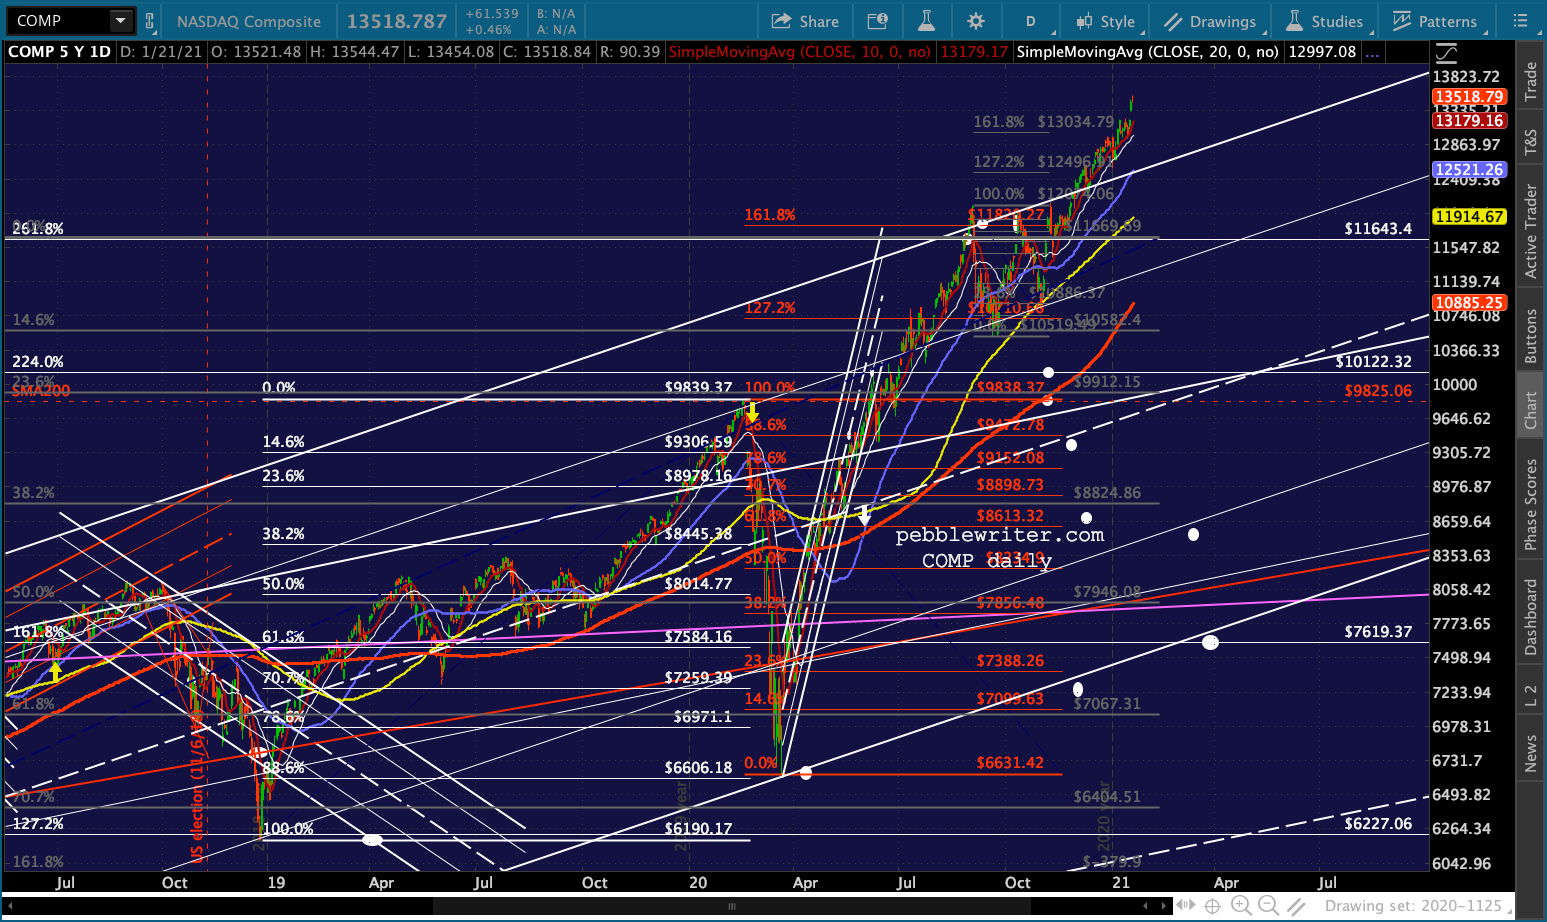 This is actually a breakout of a channel which, itself, is a breakout of a much larger channel shown below in yellow. It’s also a breakout above a 2.618 extension of the drop from 2000-2003 as can be seen in the chart after this one.
 How important is that channel? It dates all the way back to 1975. The last time COMP broke out of it was from August 1995 when it soared from 945 or so to 5132 in Mar 2000.
Note that the top of the yellow channel was essentially a neckline for a gigantic H&S pattern that targeted negative 1,986. Obviously, it could never be allowed to play out. Instead, a gentle rising flag pattern was established that allowed COMP to return to the channel bottom gracefully – pretty close to the .886 Fib retracement which had already been tested four months earlier.
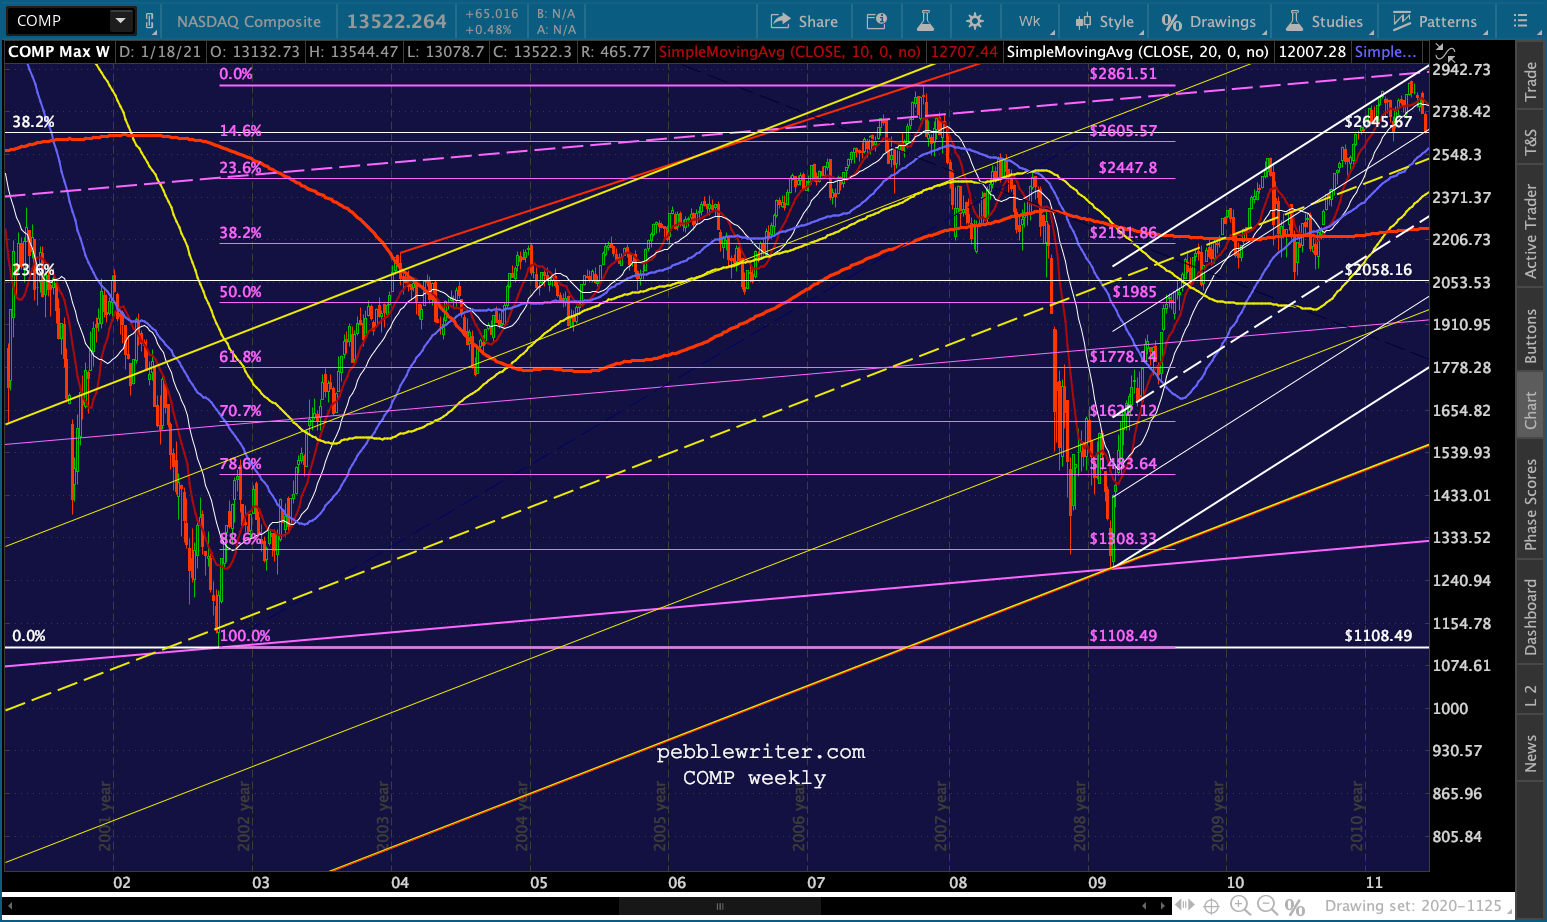 I’m not saying the exact same thing will happen again. But, I want to emphasize how significant this departure could be.
  more later…
Comments
2 responses to “FAANGs: Back in Business?”
Bitcoin seems to be a leading indicator for the market. It tends to rise and fall before stocks. I’ve been waiting for the VIX gap at 18 to fill, obviously the market knows this level is important. I find it interesting that stocks also tend to make a significant top or bottom between Jan-March since 2000. How much longer can the markets ignore the debt and unemployment rate?
All good points, Tim. Interesting situation with VIX’s gap. It would mean dropping through the .886 retracement at 19.86 of the rise from 11.42 to 85.47. VIX tagged it on Nov 27.
The correlation between BTC and SPX is notable – with a few exceptions. (1) BTC: -70% from 12/17/17 to 2/6/18 vs SPX: -12% from 1/26/18 to 2/9/18. (2) BTC: -58% from 9/4/18 (not much of a top) to 12/15/18 vs. SPX: -20% from 9/21/18 to 12/26/18; (3) BTC: -53% from 6/26/19 to 12/18/19 vs SPX -7% from 7/26/19 to 8/5/19 (SPX gained another 20% till its next top while BTC continued falling); (4) BTC: -63% from 2/13/20 to 3/13/20 vs SPX: -35% from 2/19/20 to 3/23/20. What should we make of BTC’s Jan 8 top and 31% (so far) decline? The correlation seems to be strongest when BTC plunged sharply/quickly. I’ve inserted a BTC v SPX chart at the end of today’s post.