If you’re looking for producer prices to level off and take the pressure off consumer prices, don’t hold your breath. If anything, September’s print should serve as a strong reminder that something’s gotta give. Either consumers or retailers will bear the brunt of rising prices, and neither is all that positive for markets.
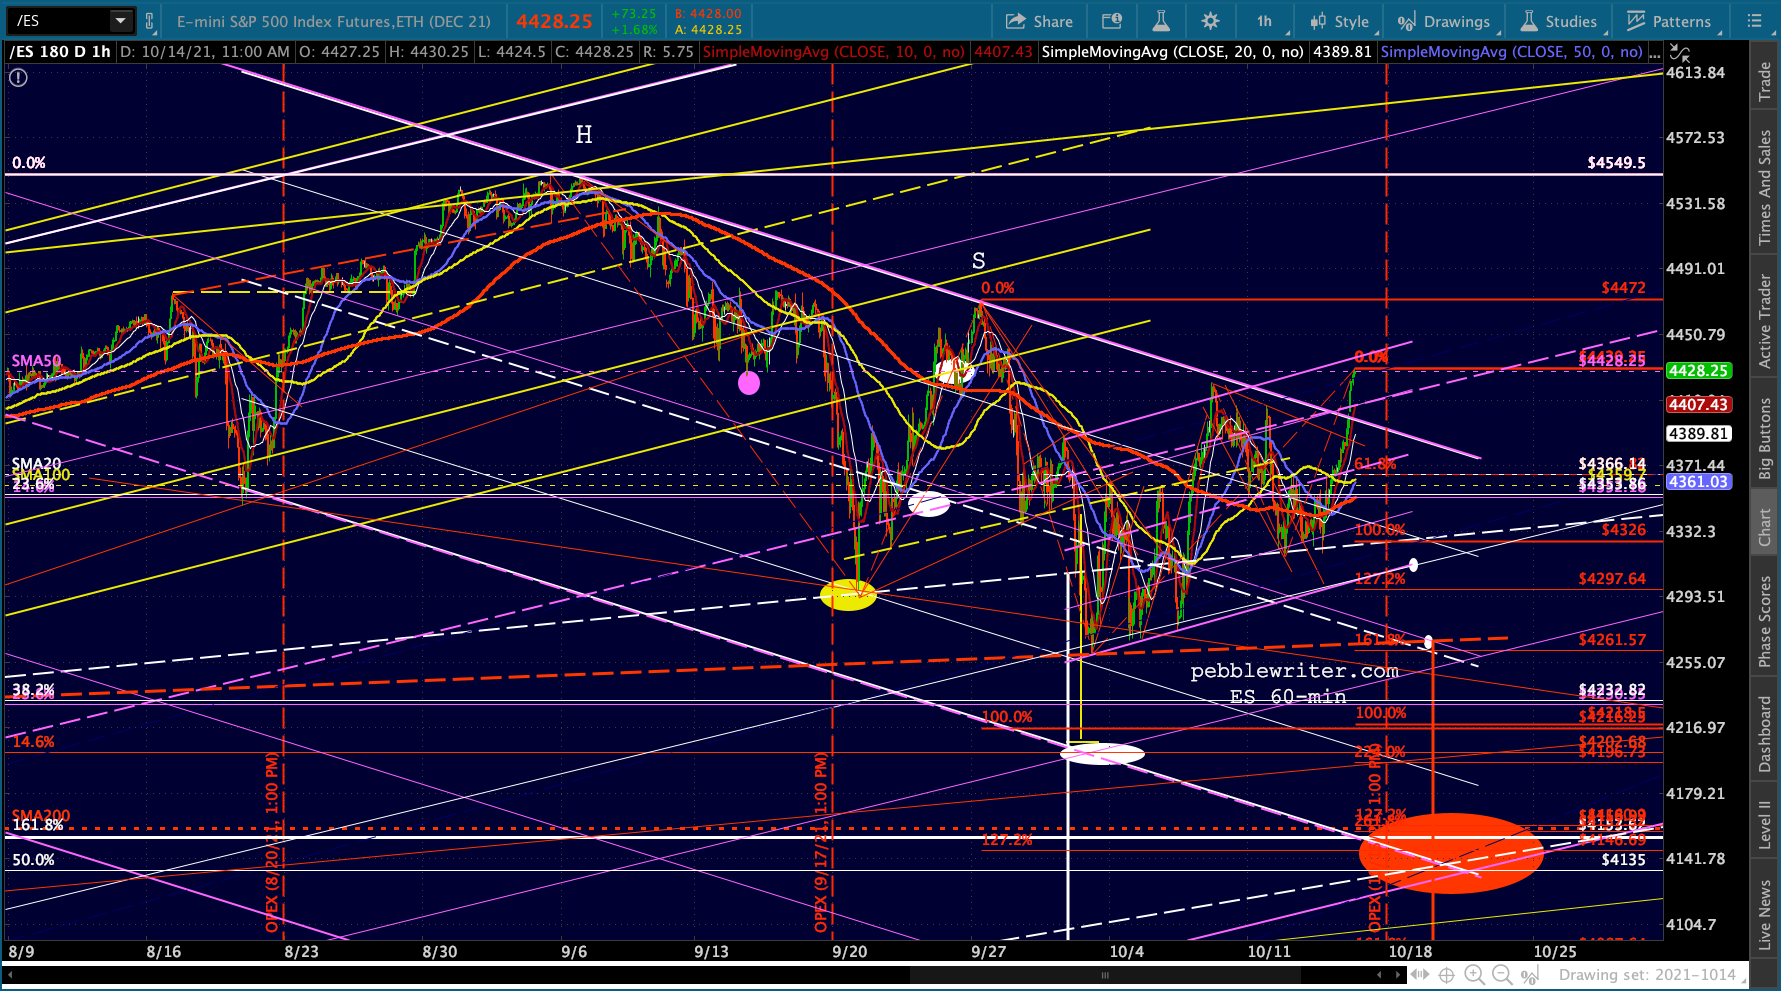
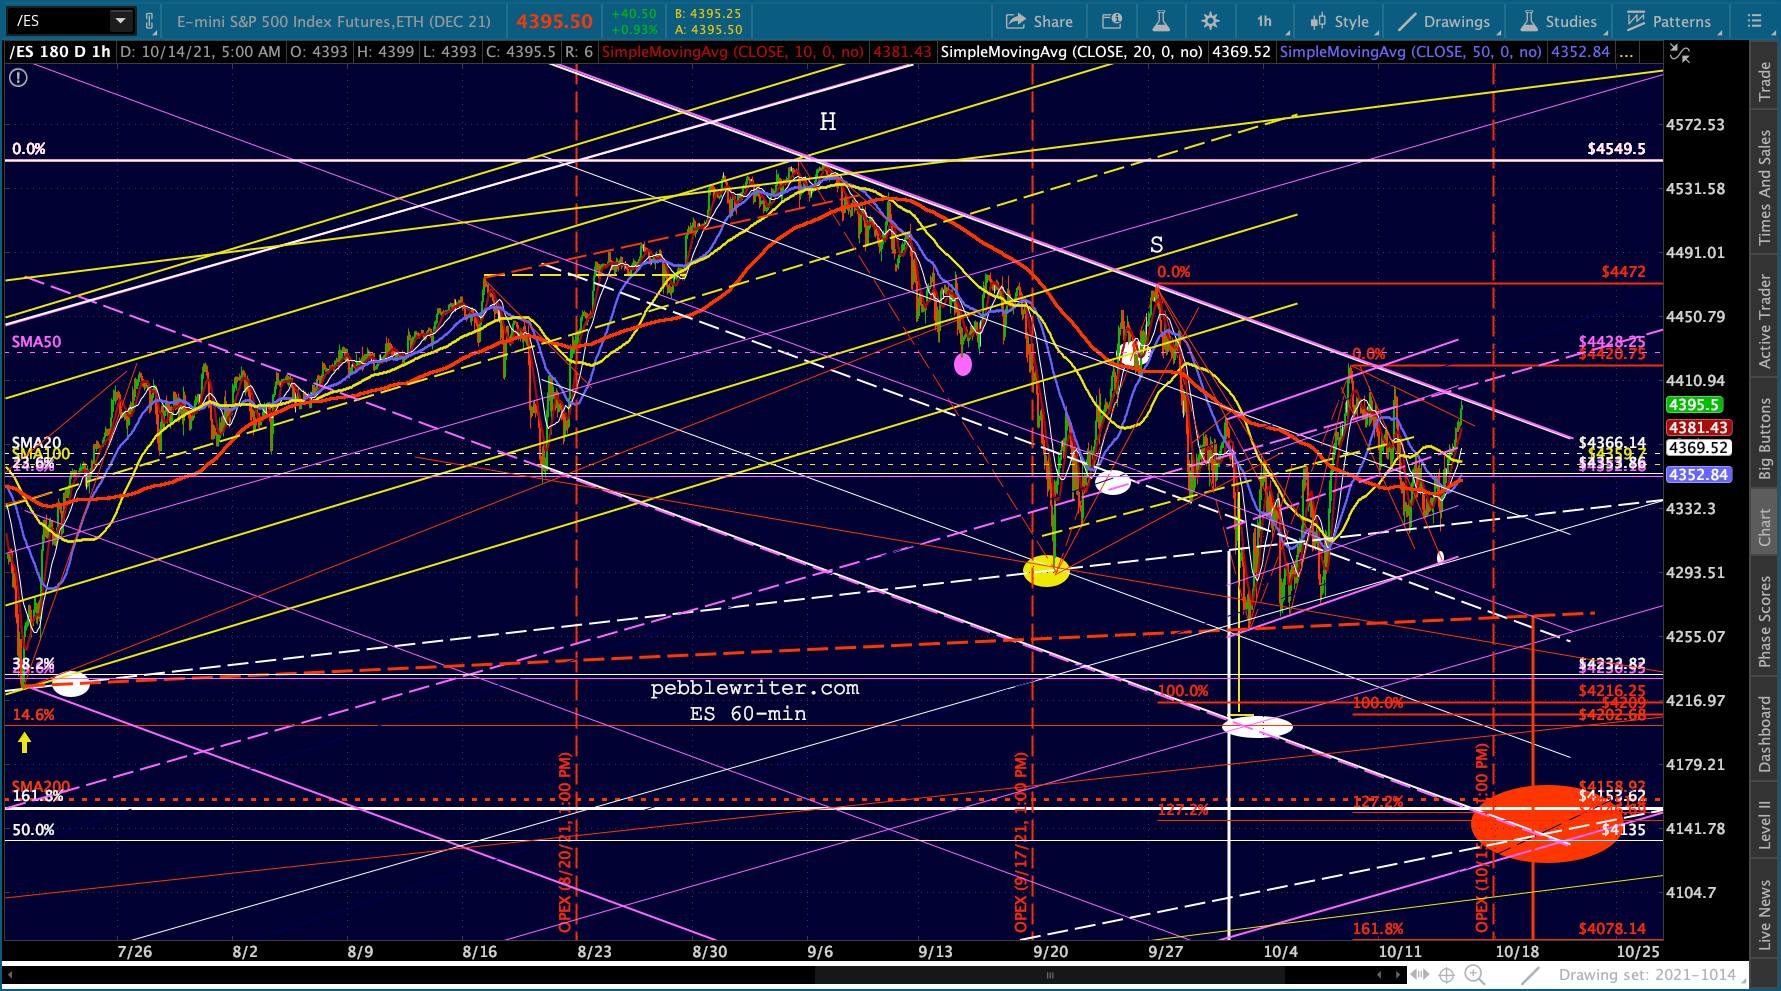
 Speaking of markets, futures have completed their trip to the falling channel top just in time for OPEX tomorrow. Absent a world class head fake, this should be the hopping off point for the latest algo-driven bounce.
 It’s been 5 weeks since we announced a correction watch, with SPX having given up a little less than 6% at its worst. Should there be another leg down, it should be about ready to get started.
continued for members…
The bigger picture:
 I’ve included a SPY chart just to show (1) the variety of H&S Patterns which can be legitimately drawn, and (2) the choices available in terms of total losses. The red TL shows a 10% correction would land at 408.65, while a SMA200 backtest would result in a 8.5% drop from the top.
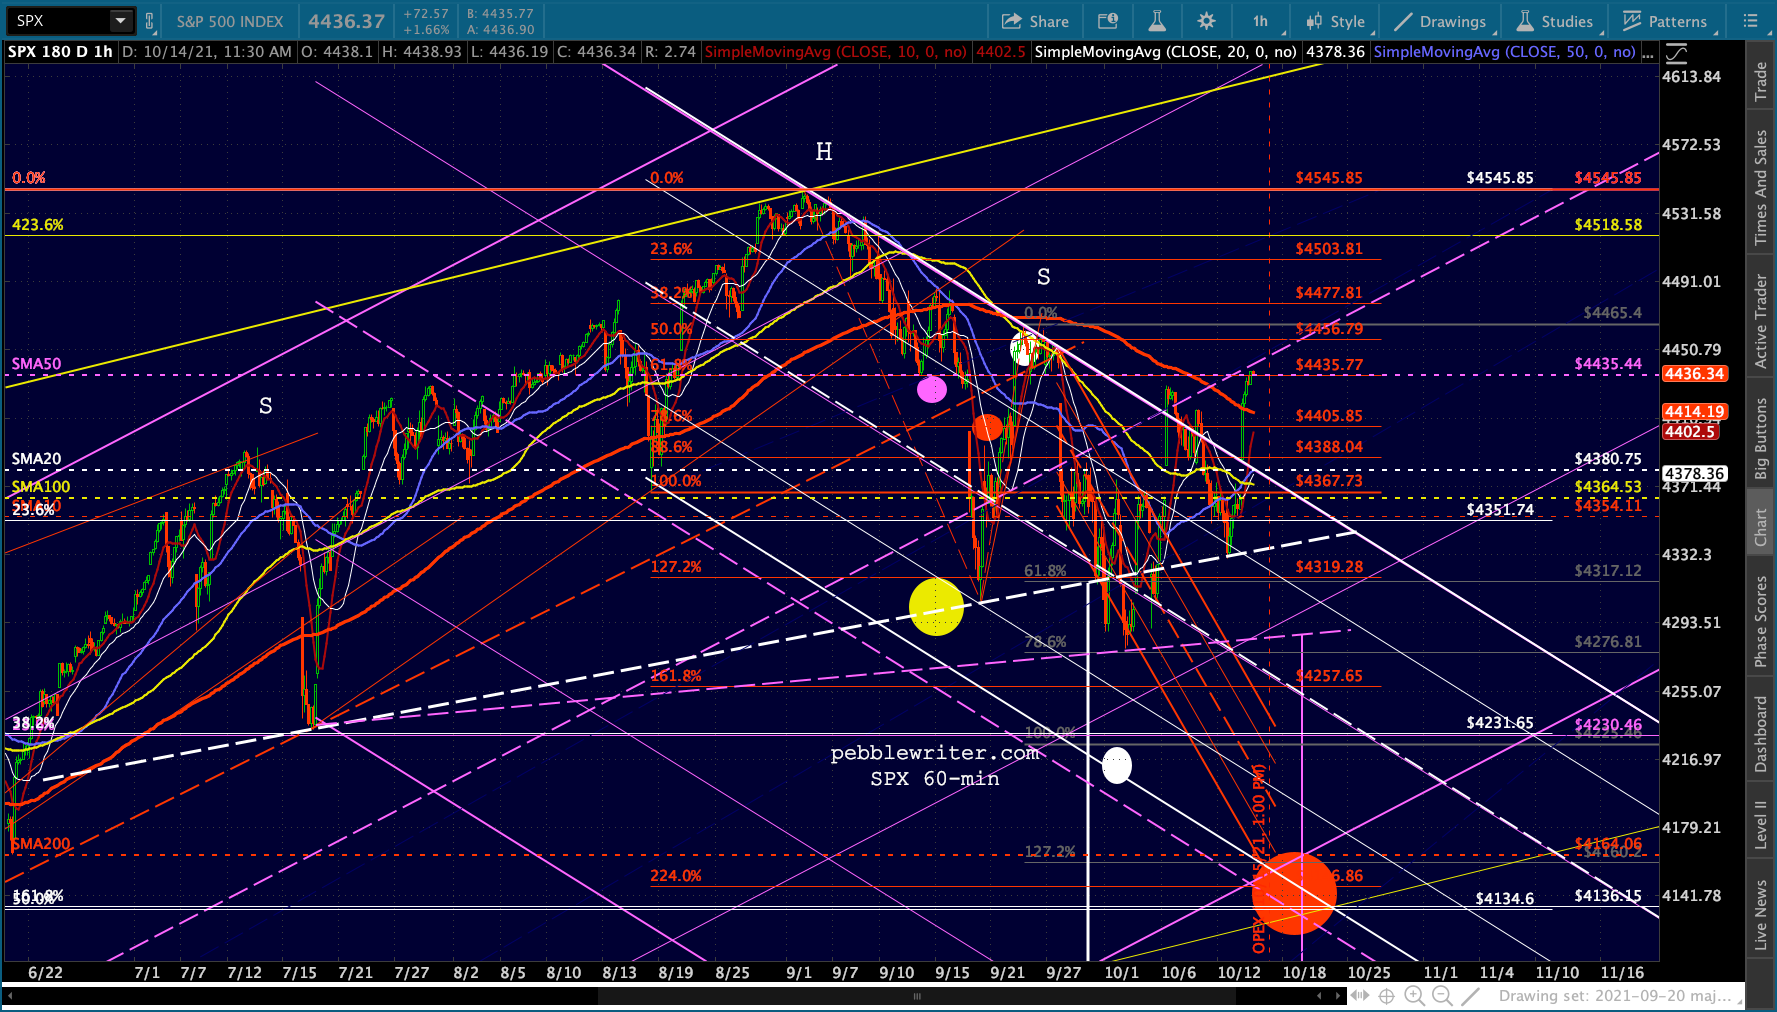
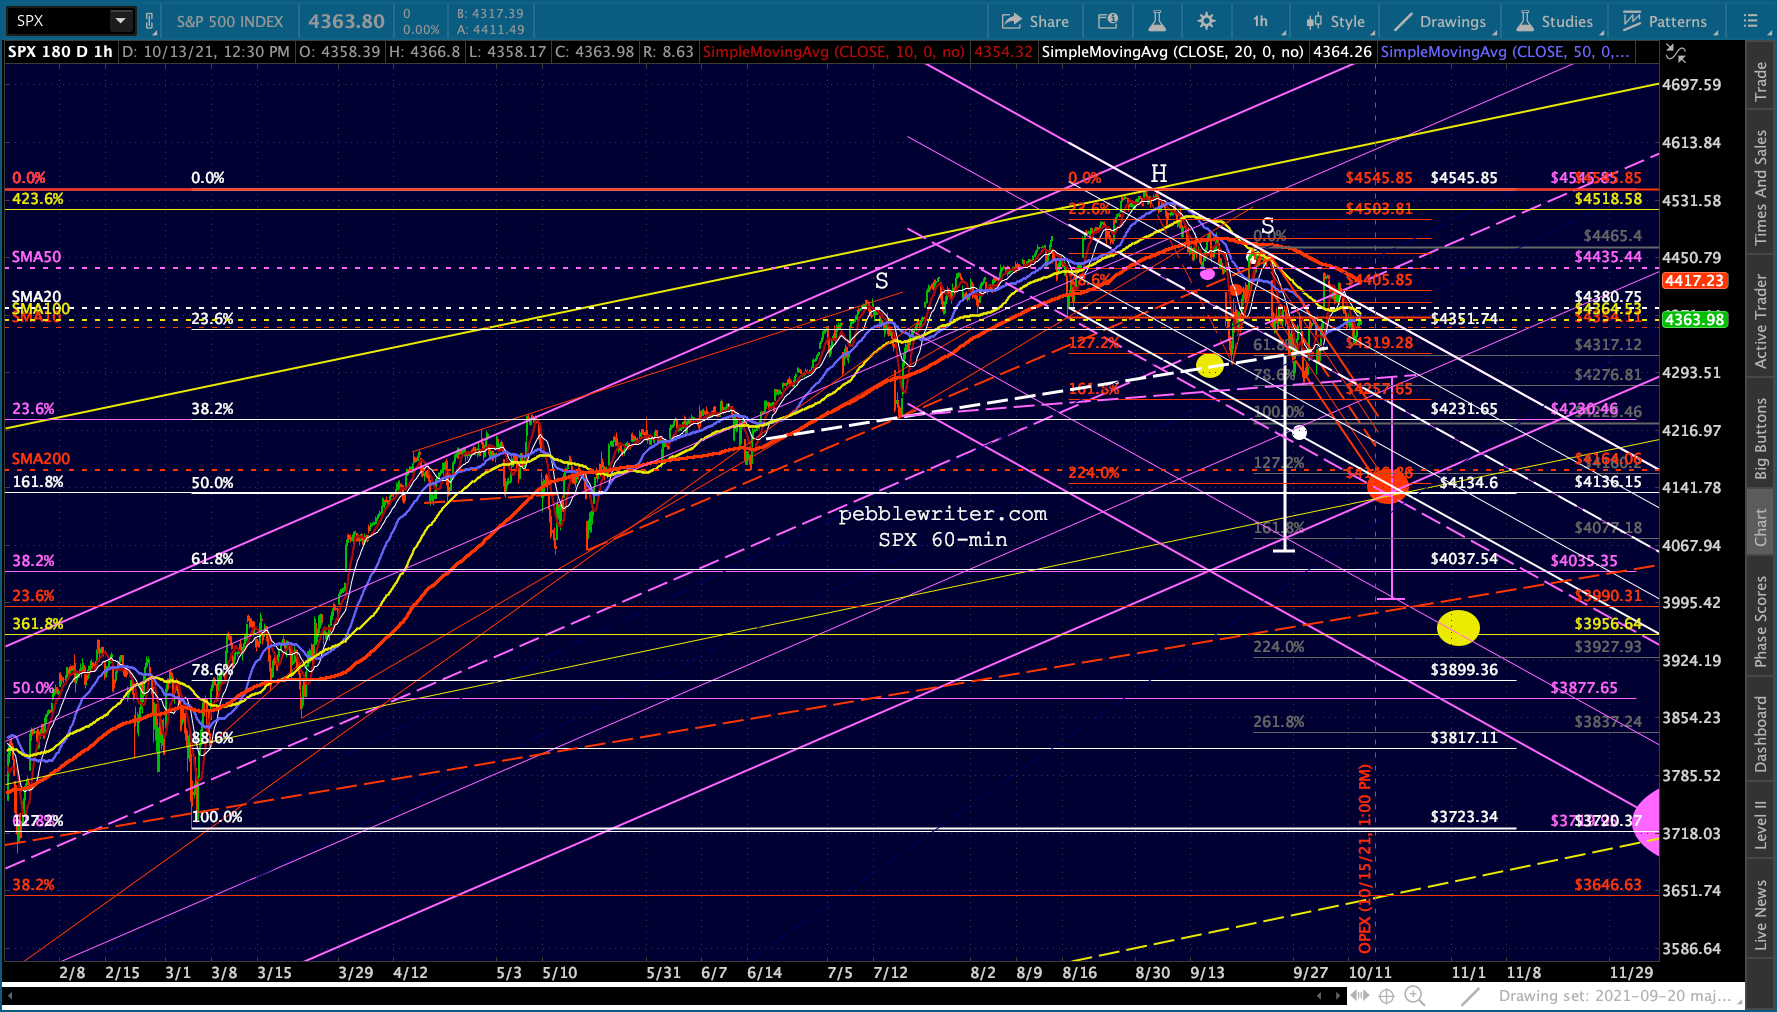
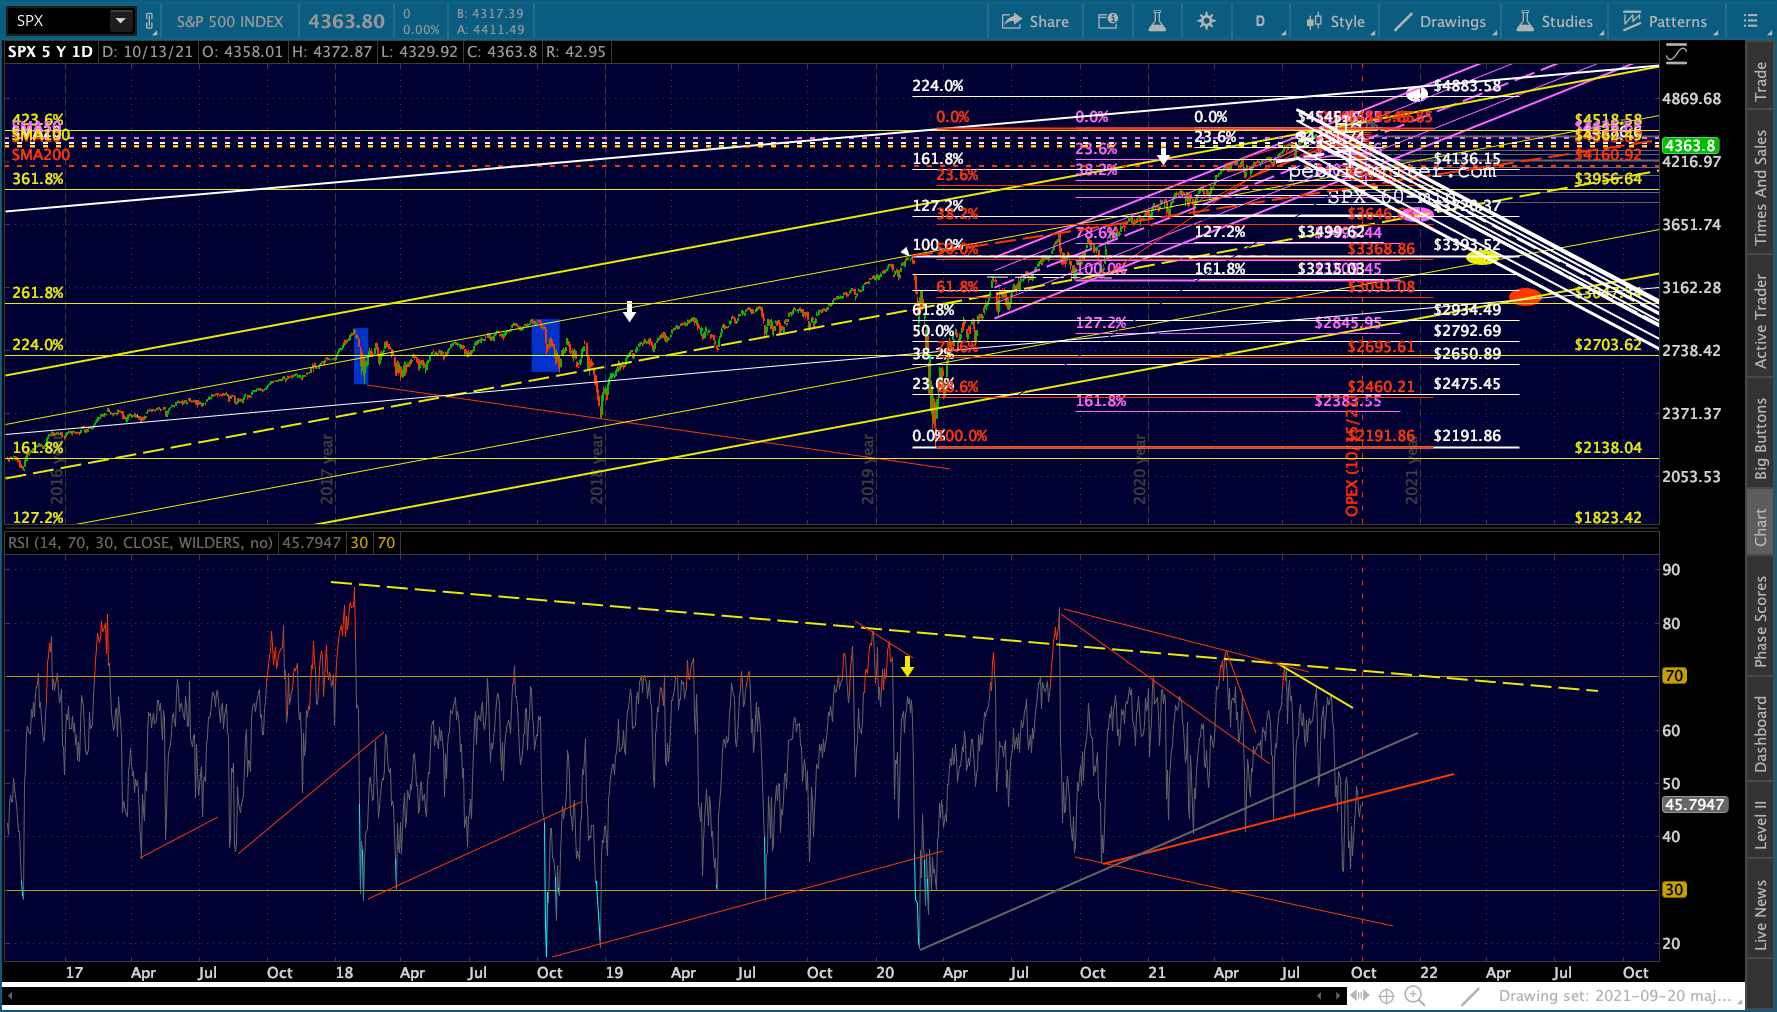
Neither jumps out at me as an appealing scenario, suggesting that we might very well get an overshoot of the SMA200 and the 1.618 Fib. It could even happen via a sharp drop on an intraday basis in order to prevent the H&S Patterns from playing out.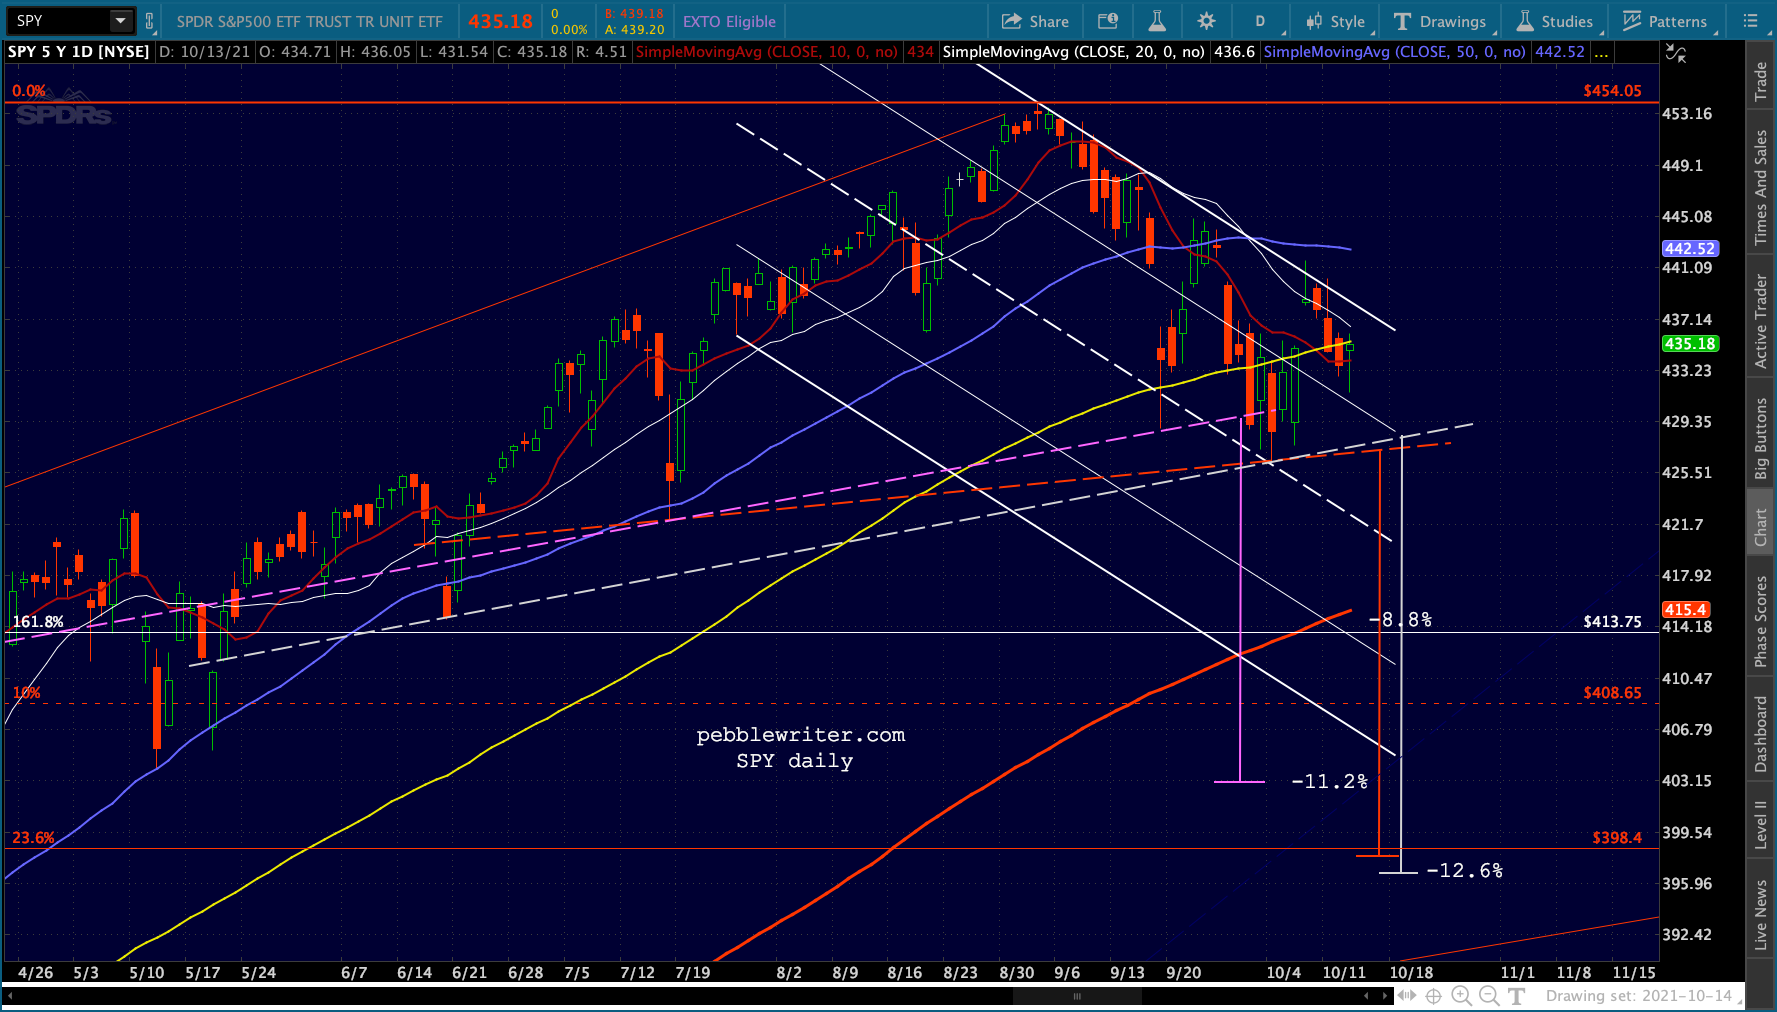 SPY’s RSI illustrates, as does SPX’s, that we’re sitting at a very important point where either a breakdown or breakout must occur.
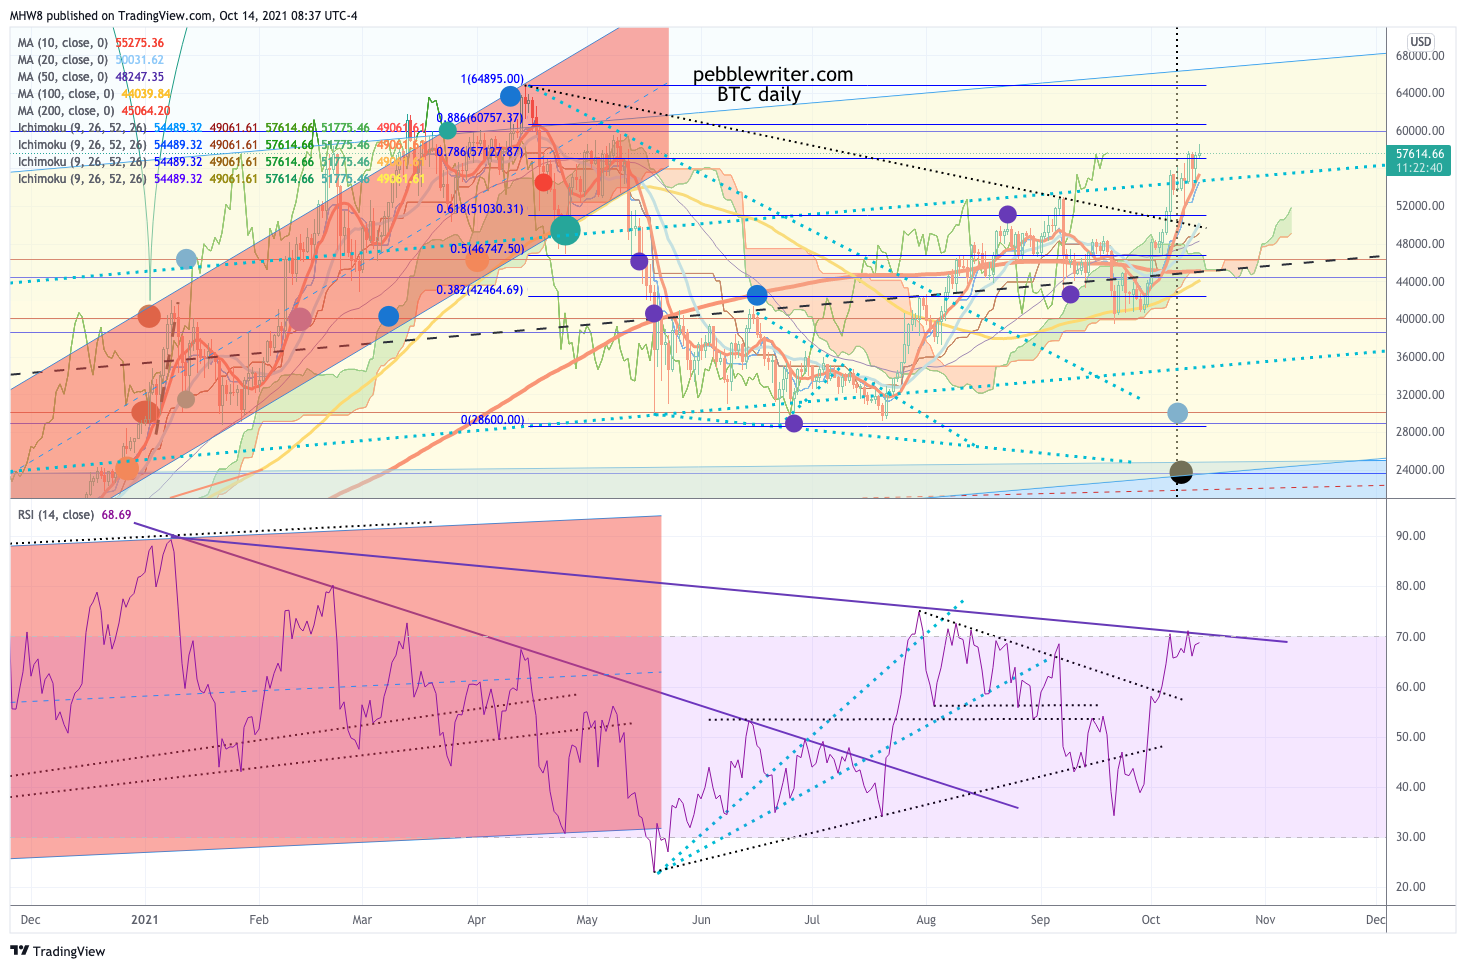
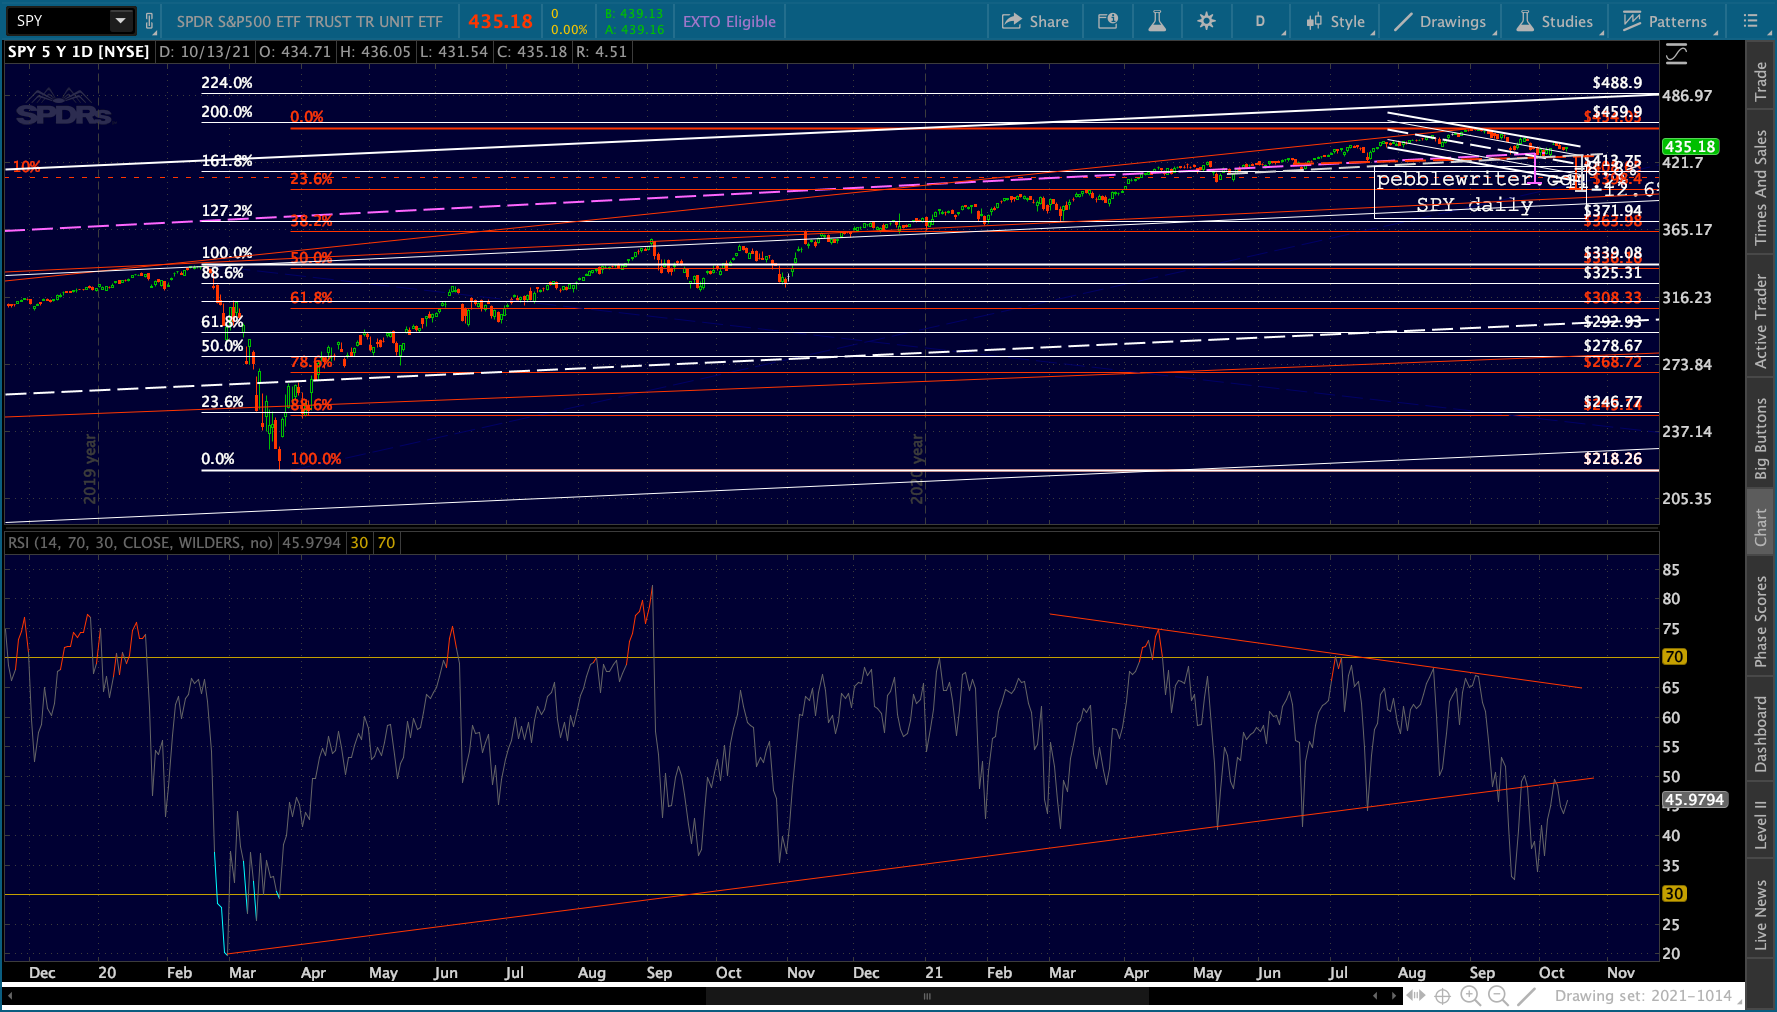 I see a similar situation with BTC, whose RSI illustrates significant negative divergence and overhead resistance. This completes the Gartley Pattern at the .786 fib and is a strong signal for a signficant reversal.
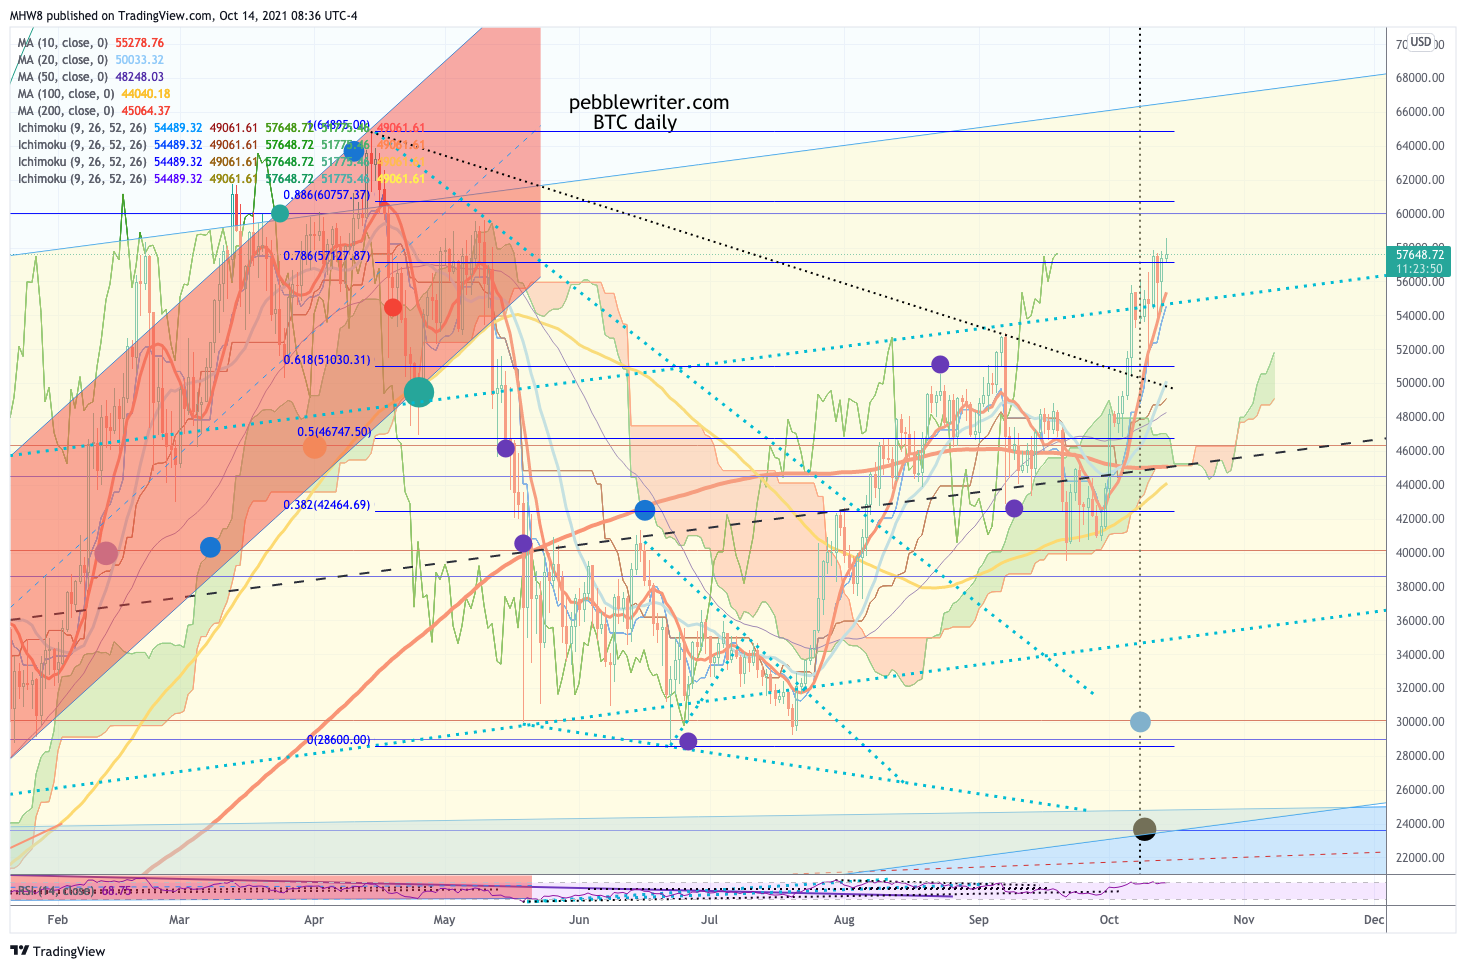
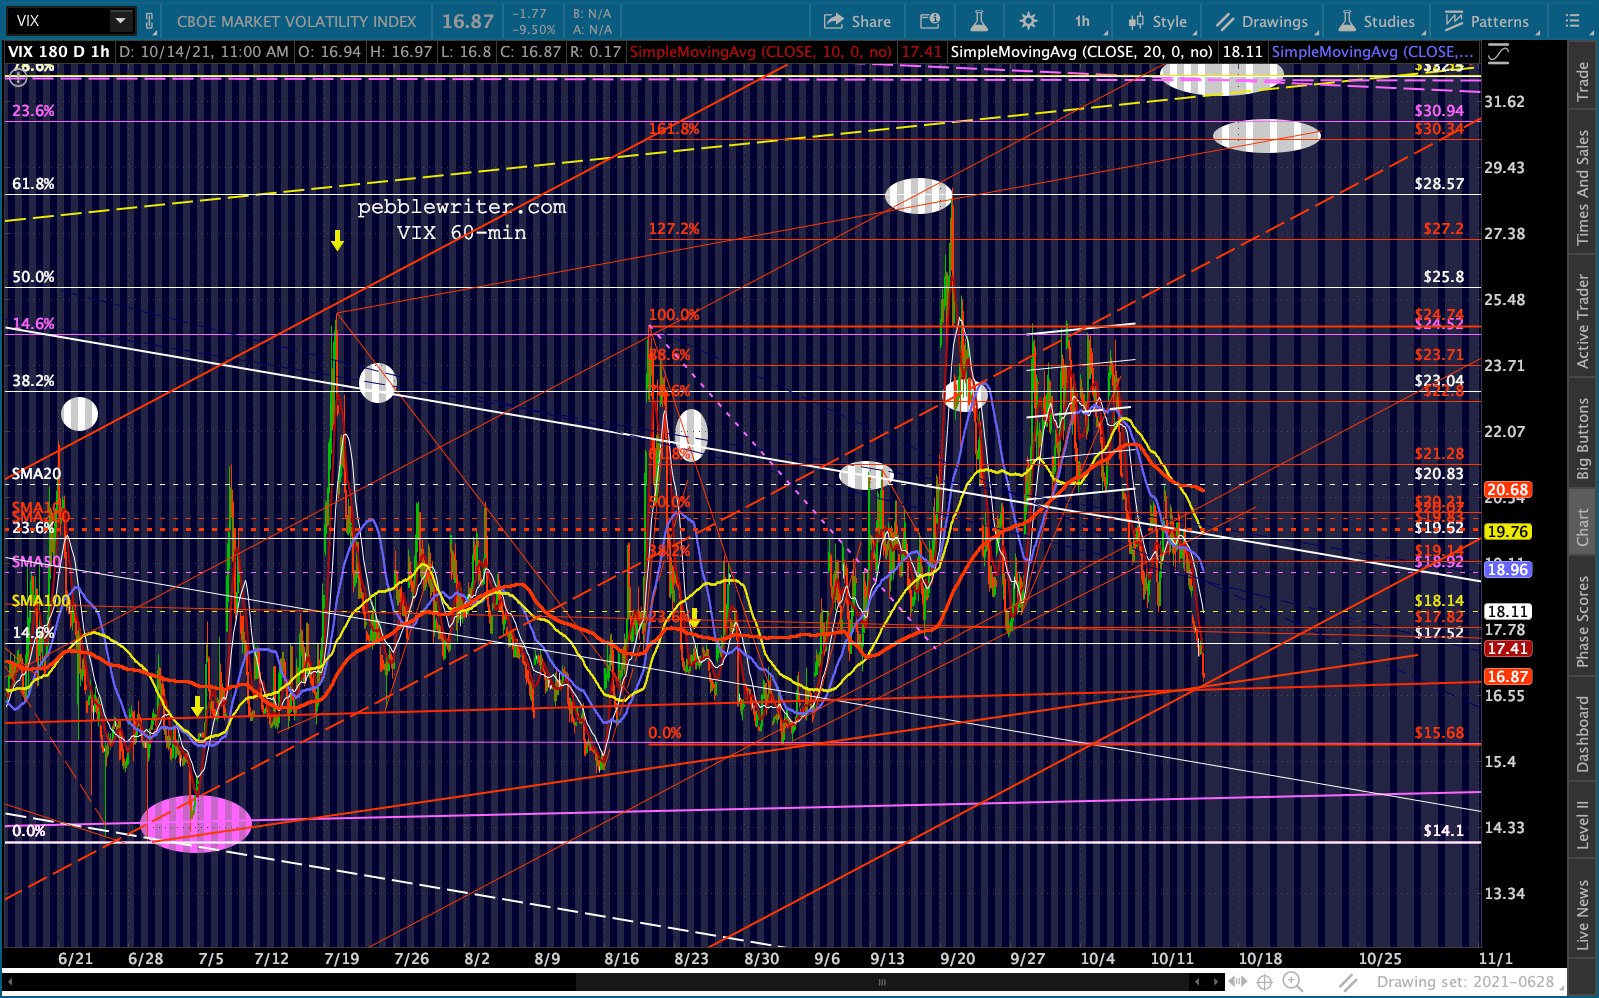
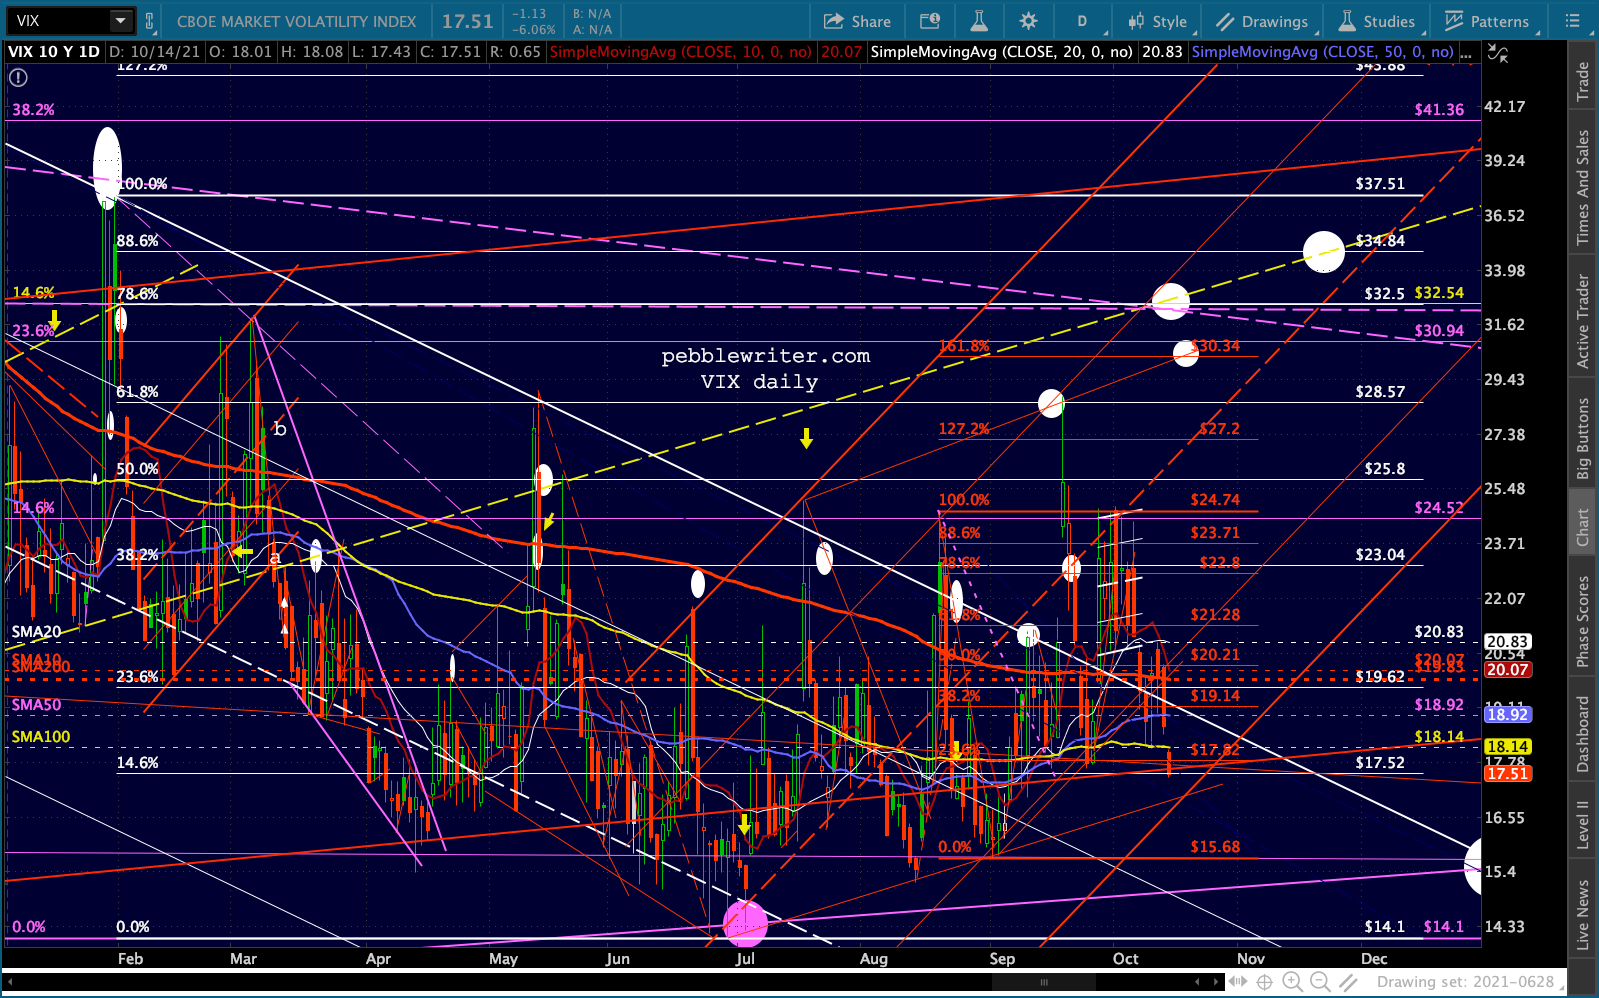
 VIX has gapped lower overnight, a short distance from another TL of support – ideally tomorrow.
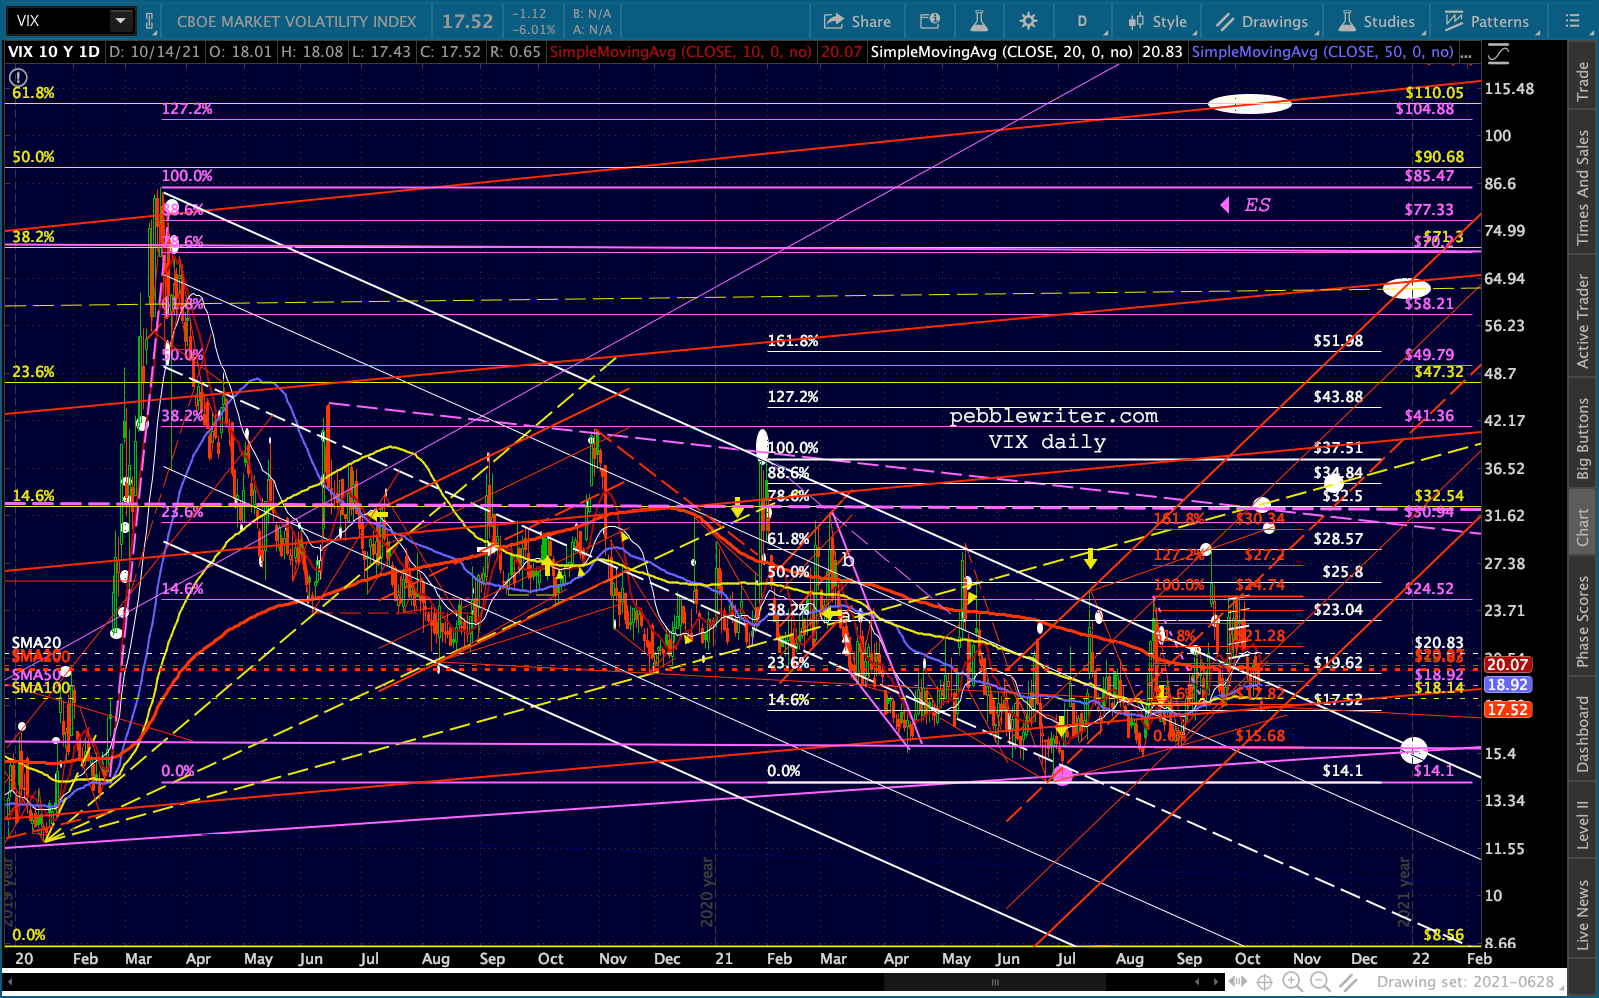
 USDJPY shows a little more upside potential before running into important resistance…
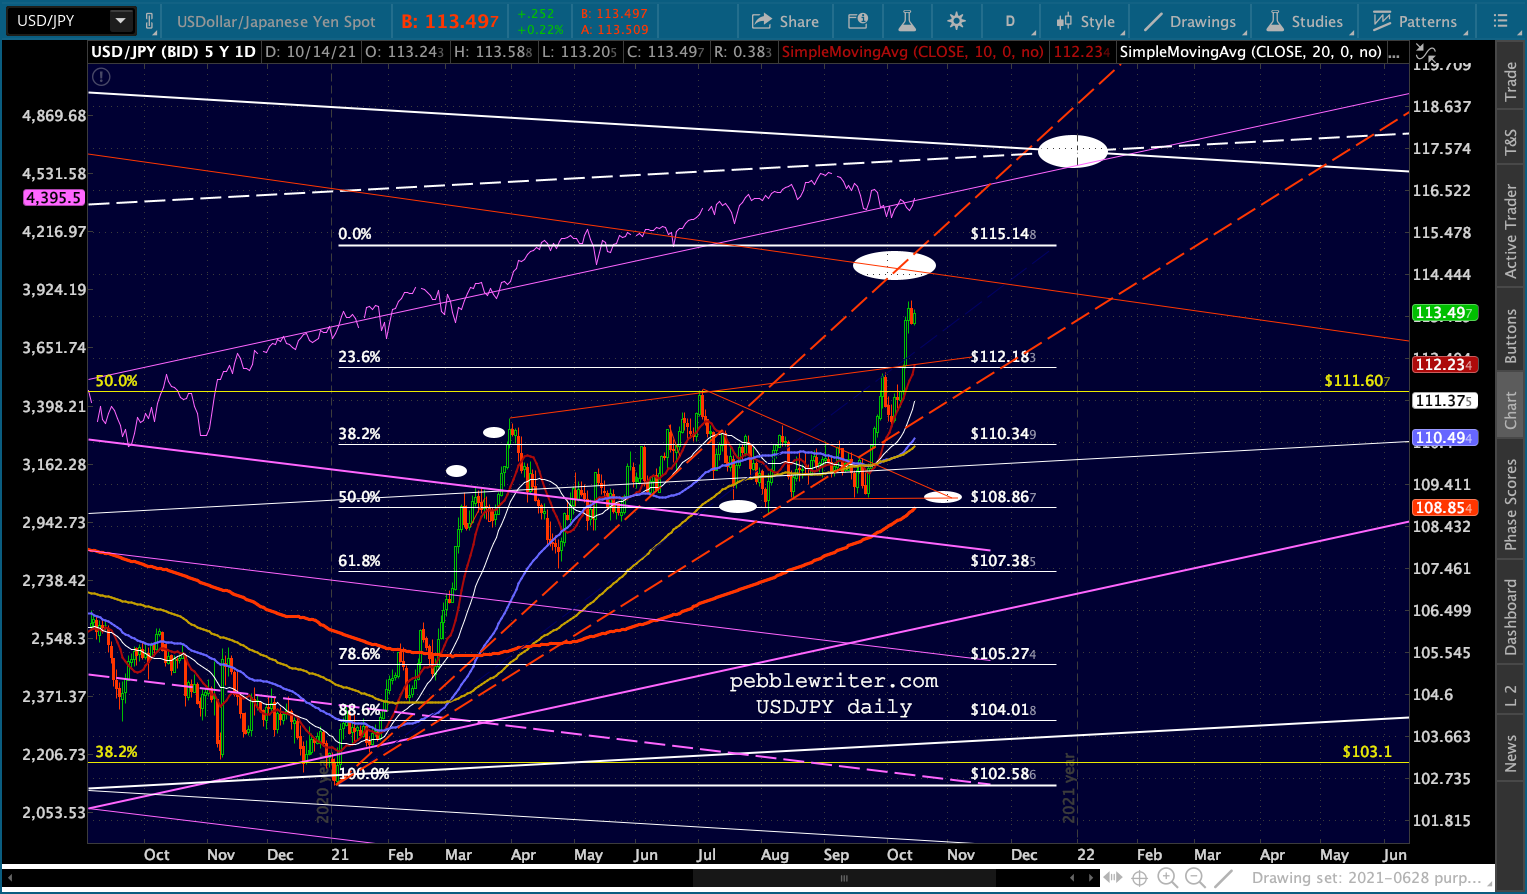 ... which, combined with EURUSD’s little bounce at our downside target…
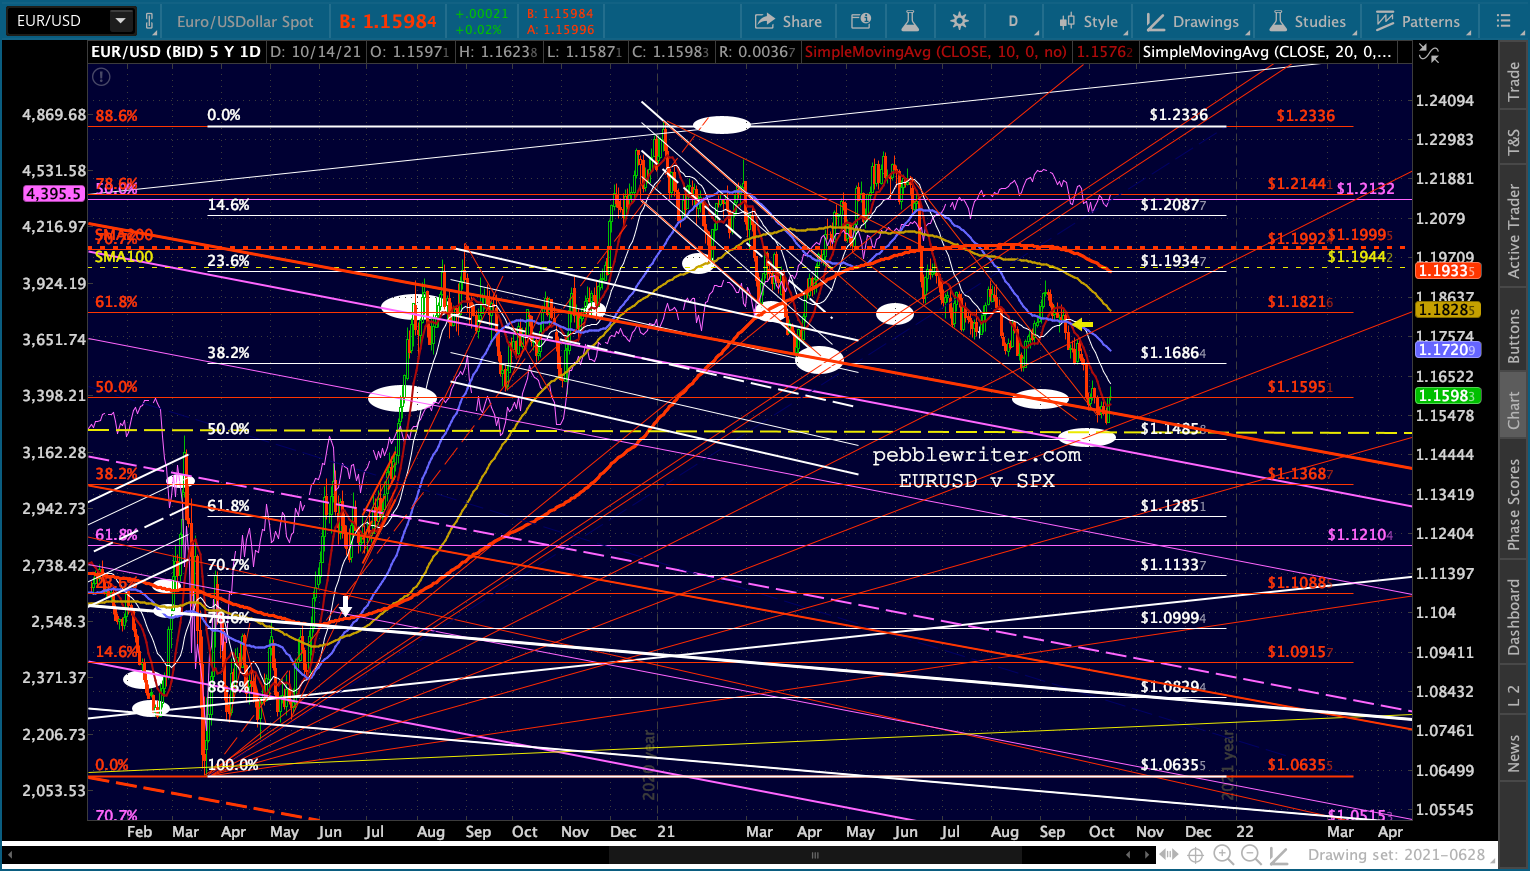 …is creating a little bounce for DXY at its flag pattern backtest.
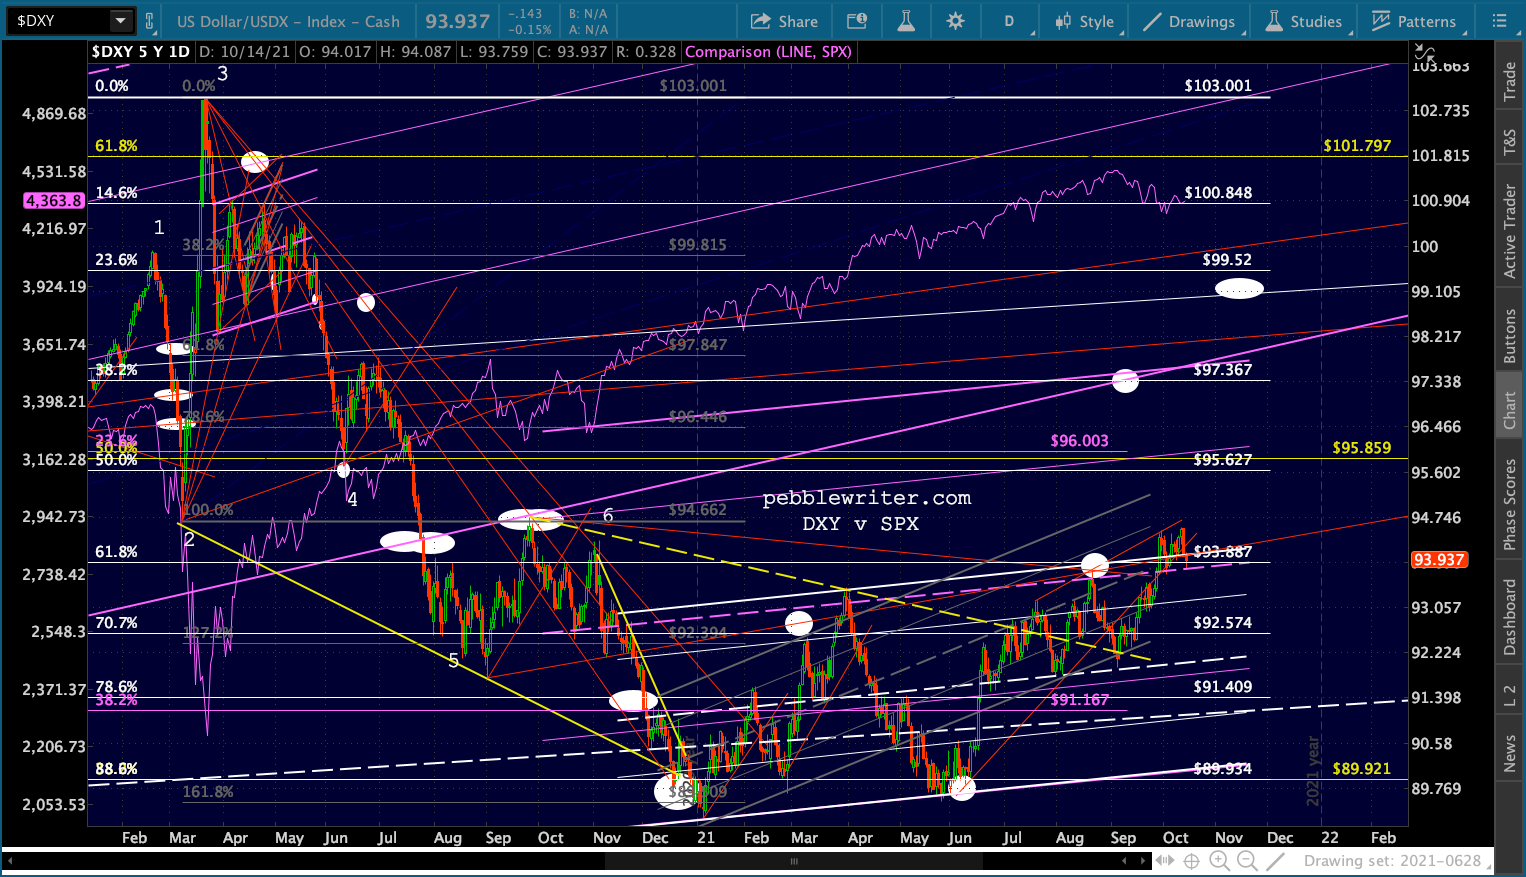 Bonds are already hinting at an equity correction, with the 10Y reversing at the top of a small rising channel after breaking out of our falling white flag.
 This means that ZN can end up holding the white midline shown below without necessarily breaking down. Perhaps a backtest of the red channel and purple channel top?
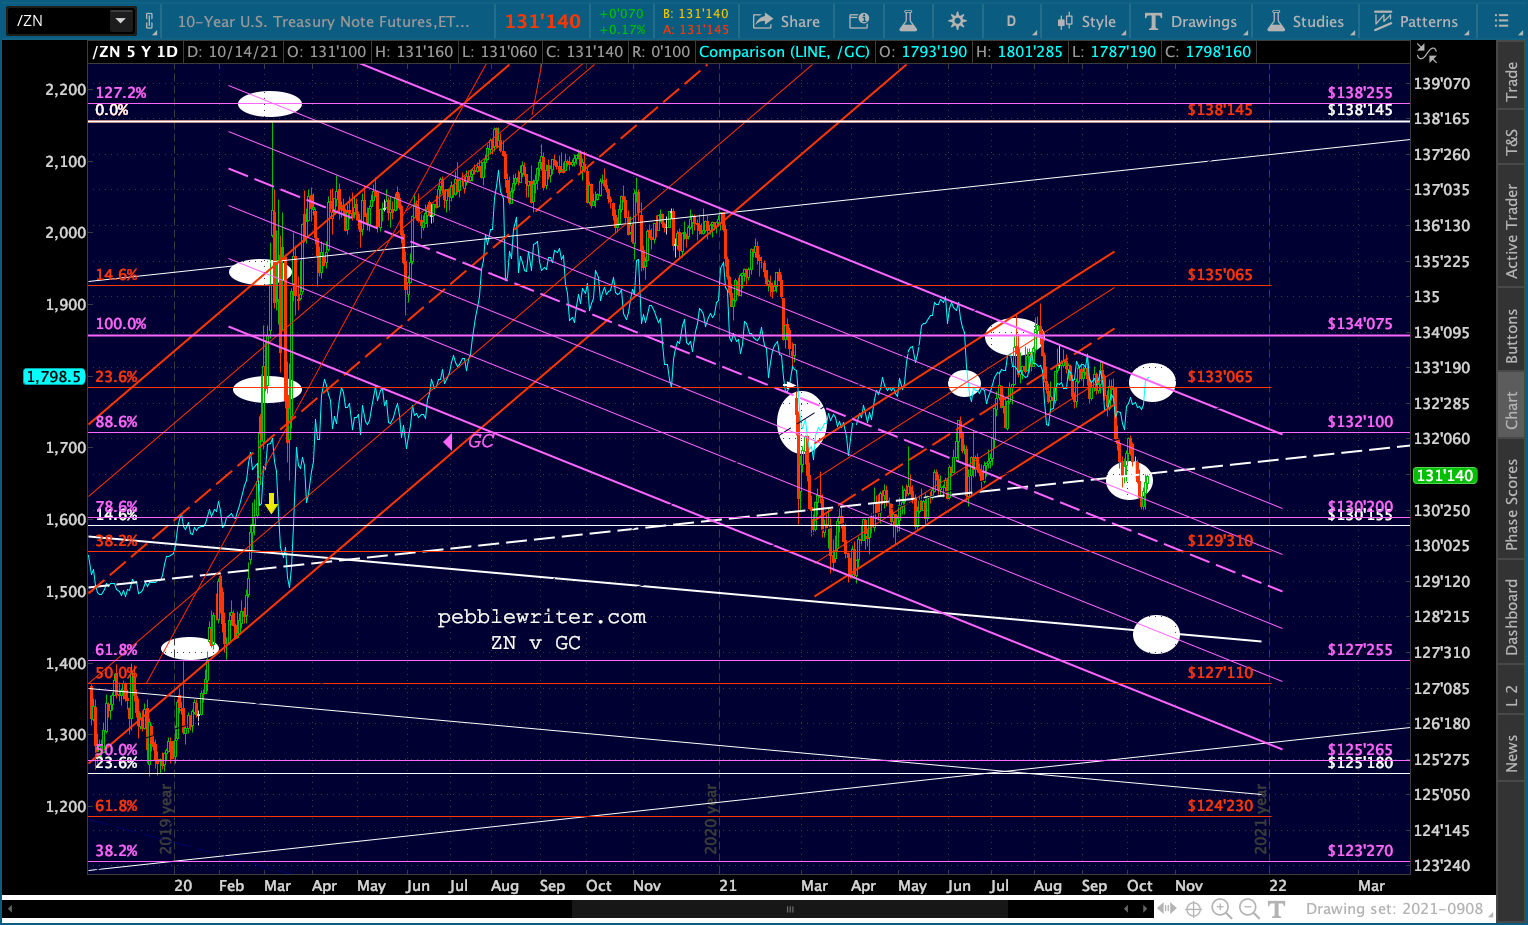 Note that GC, which is highly correlated to ZN, is backtesting its SMA200…
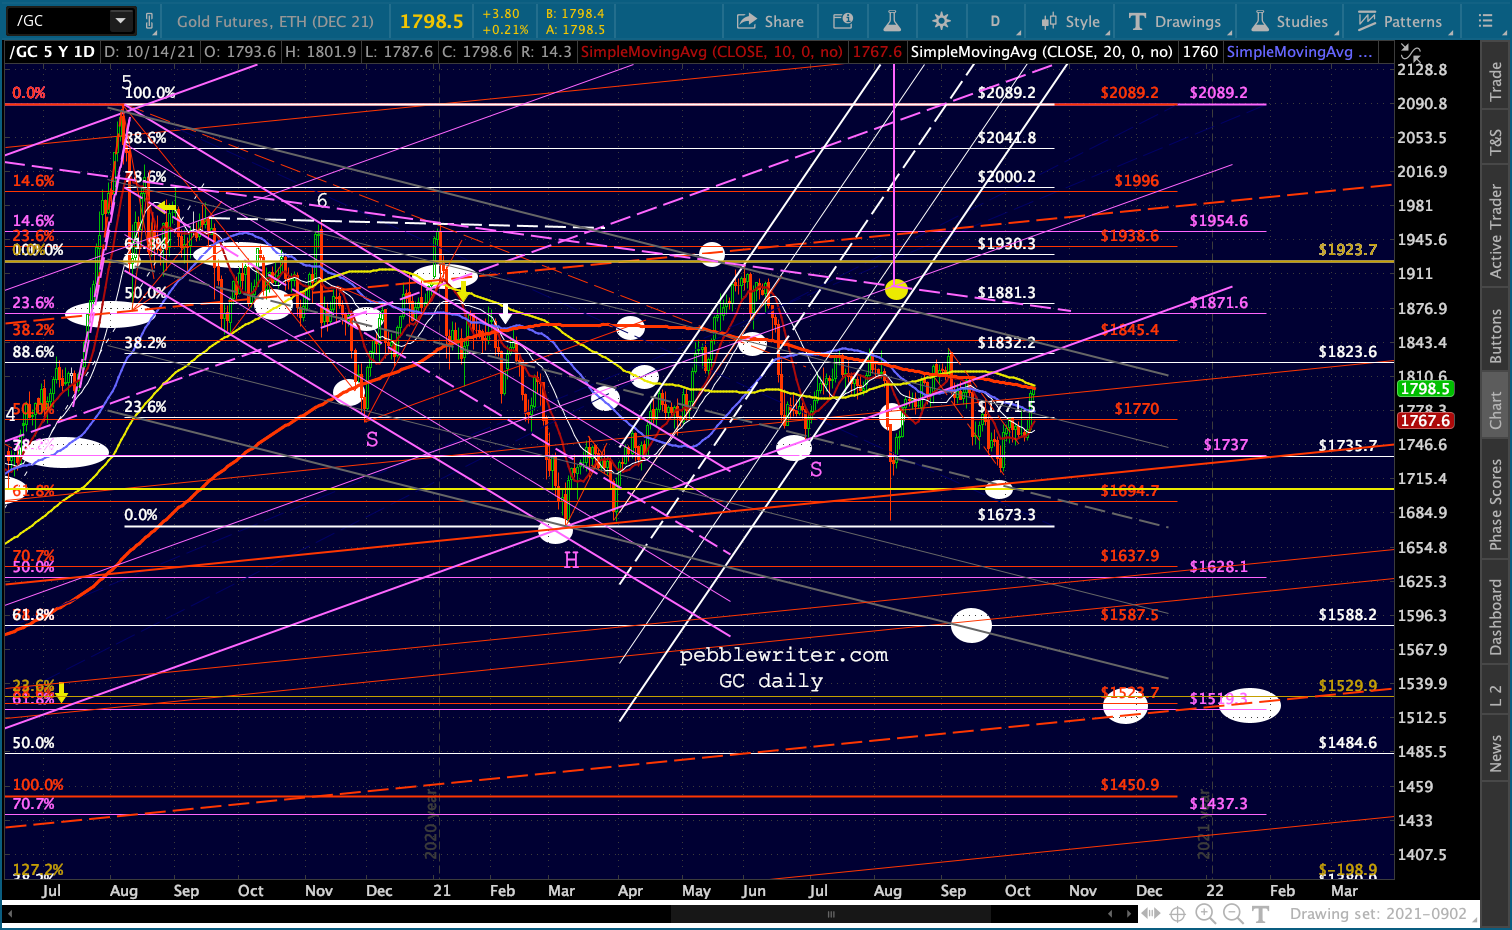 …and SI is backtesting its broken flag pattern.
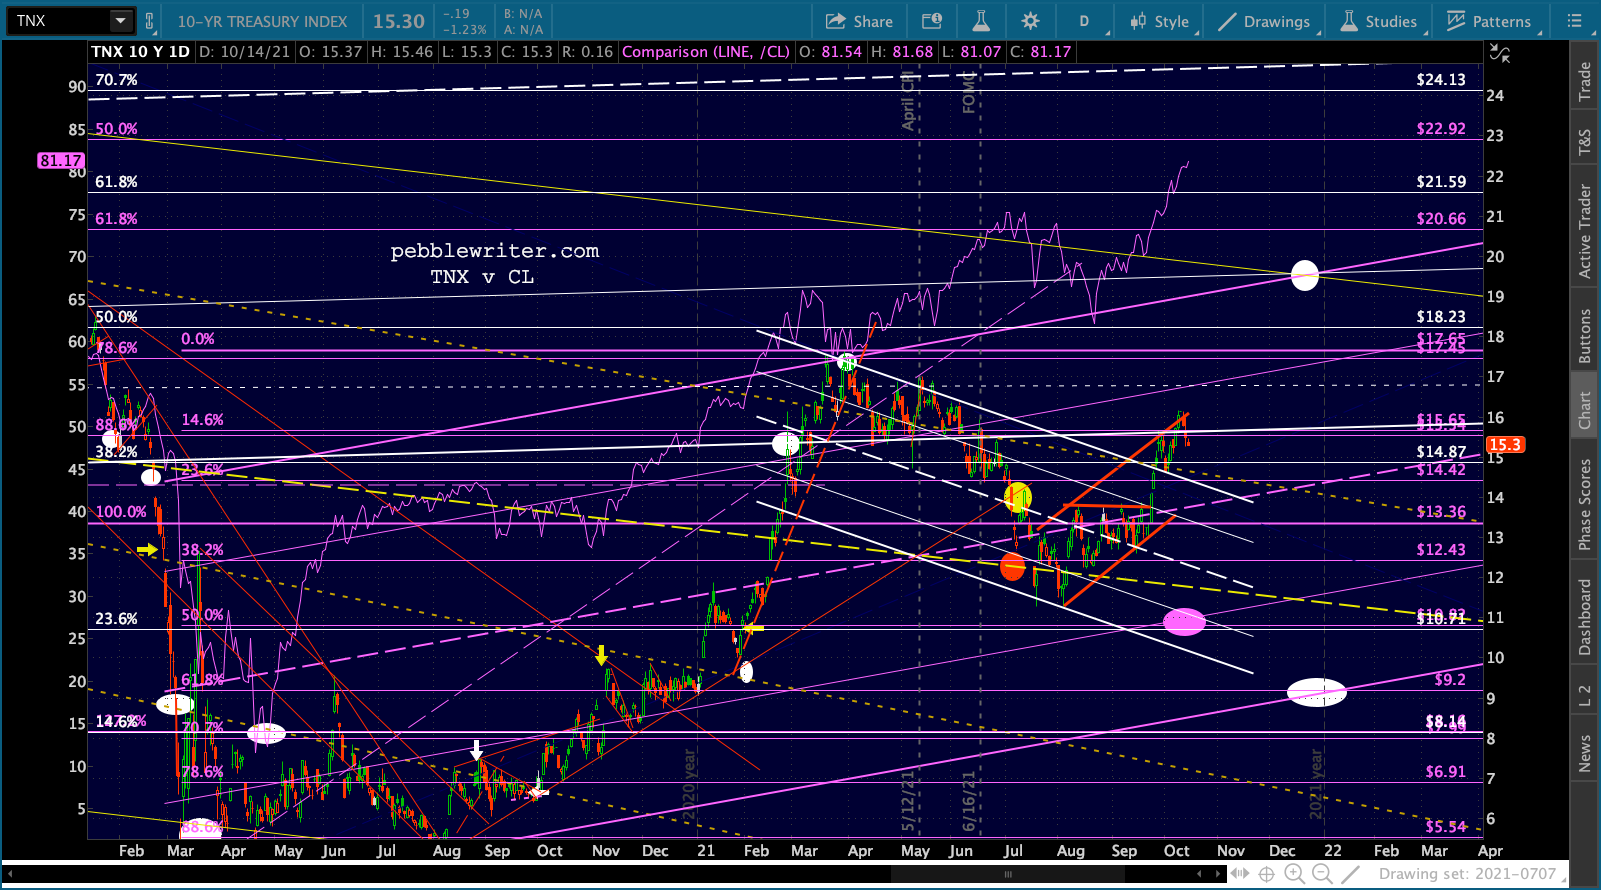
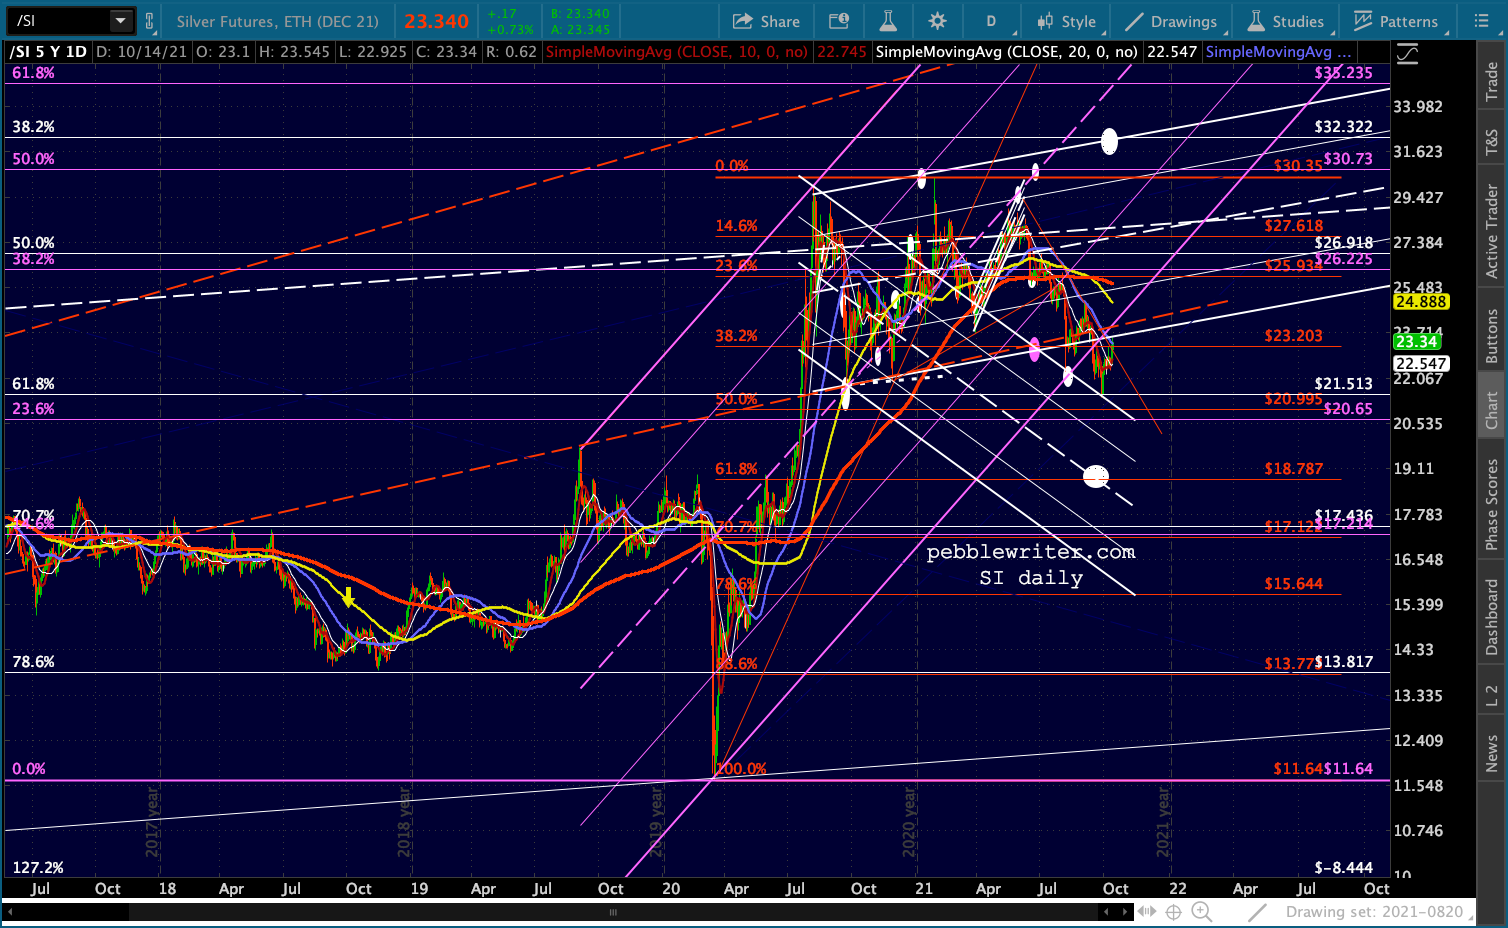 TNX action makes me want to adjust the falling white channel to one which hasn’t been broken out of.
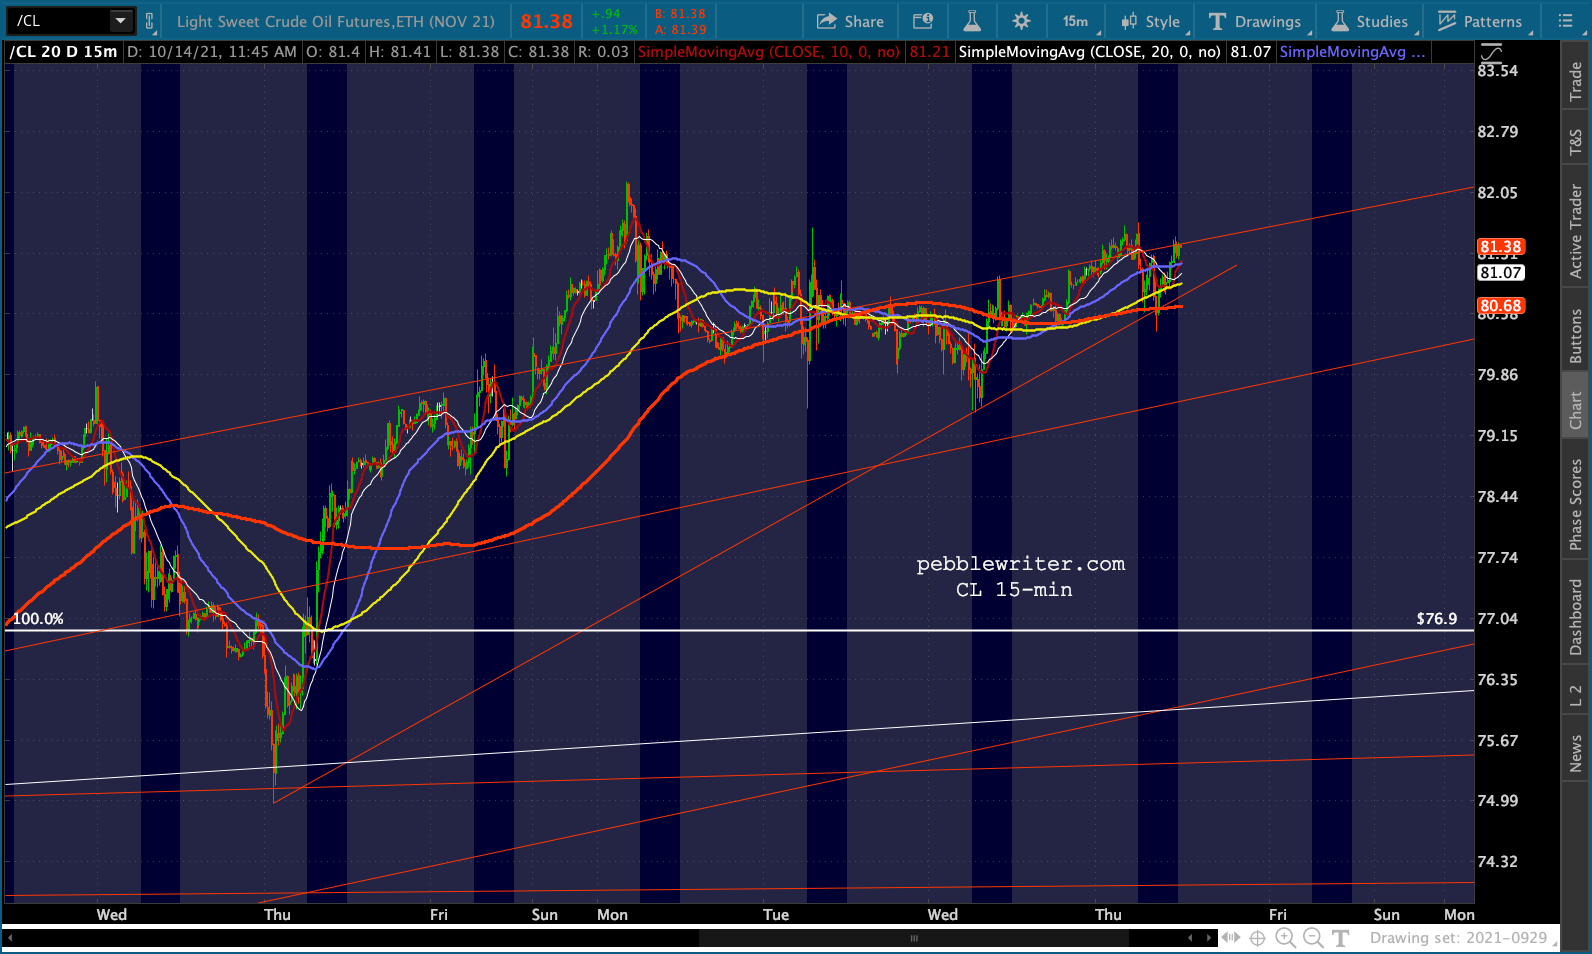
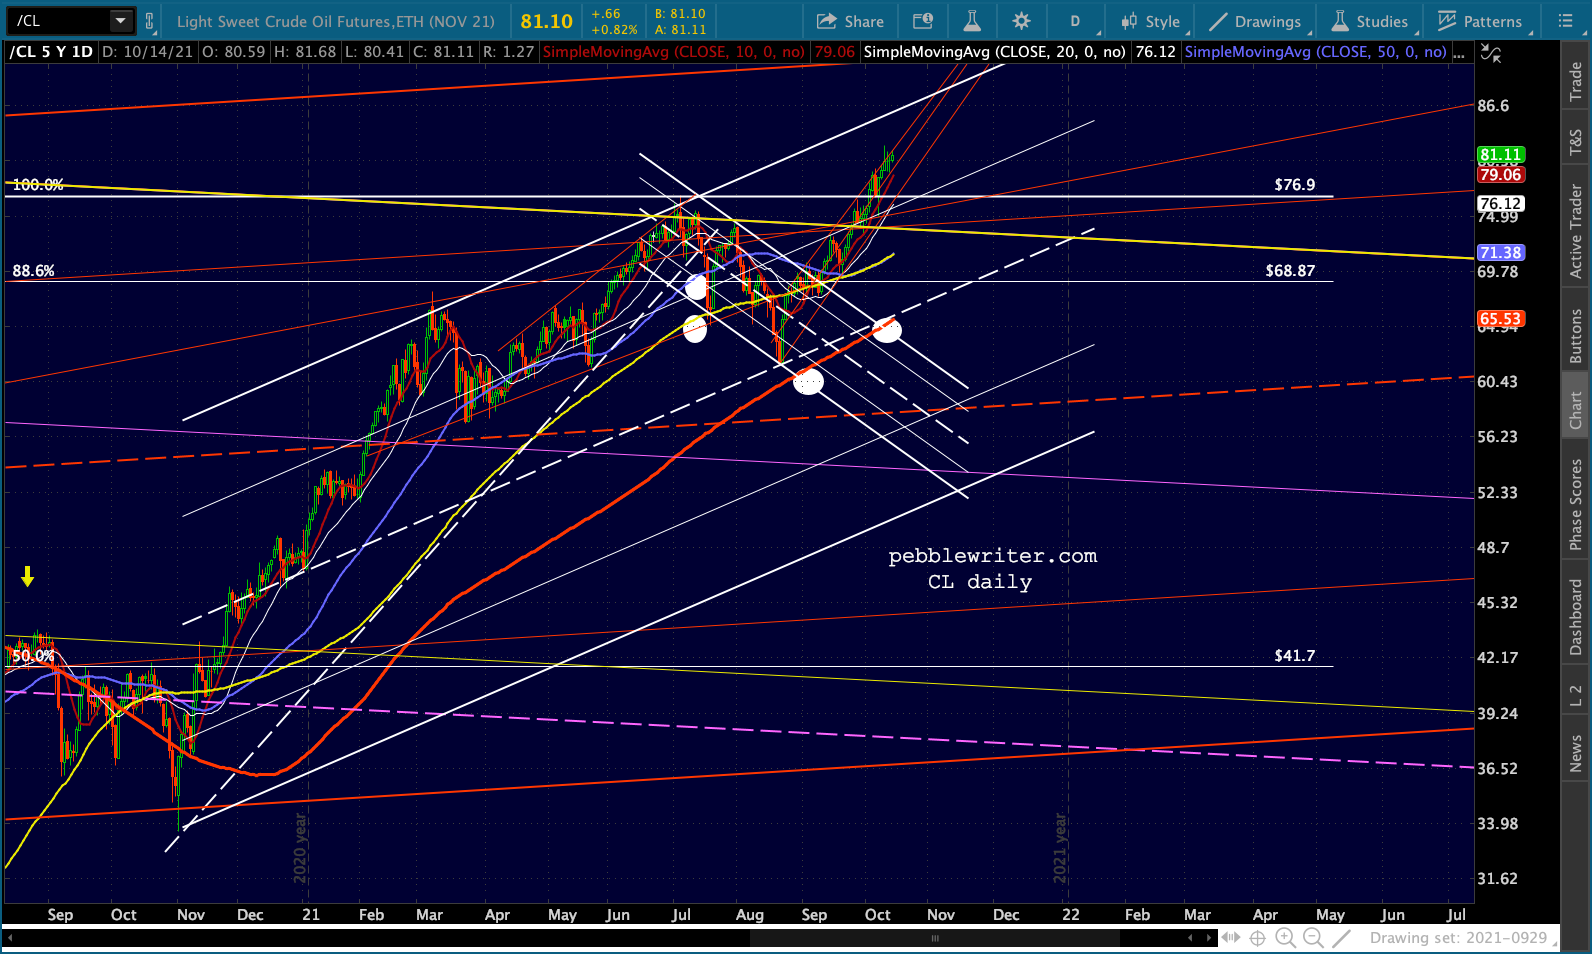
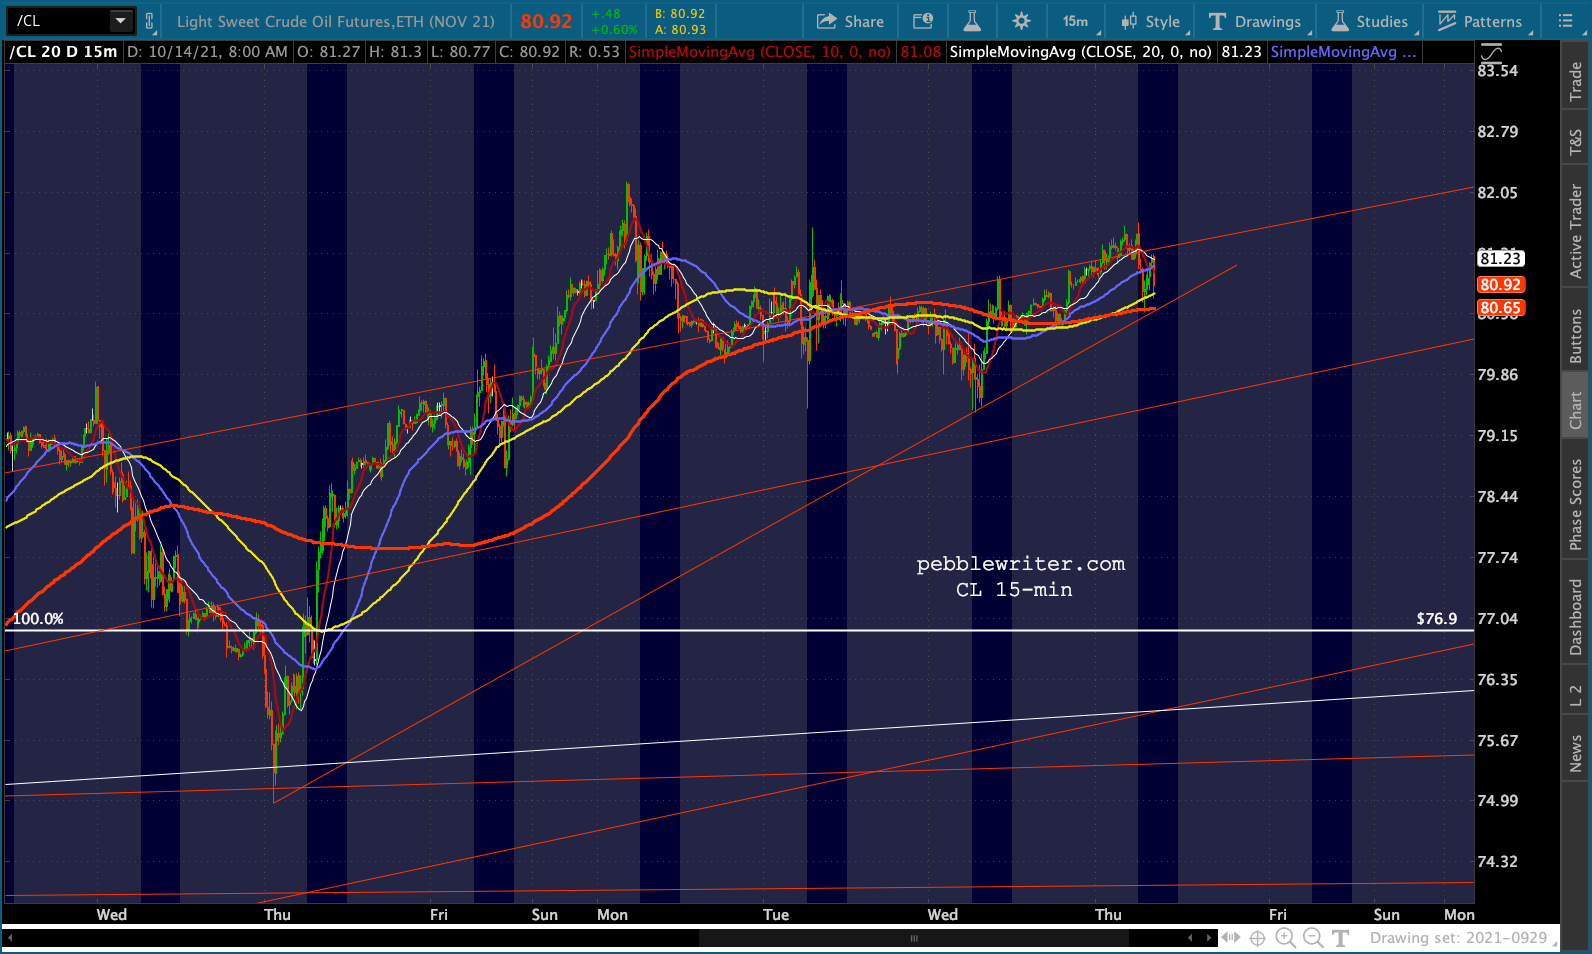
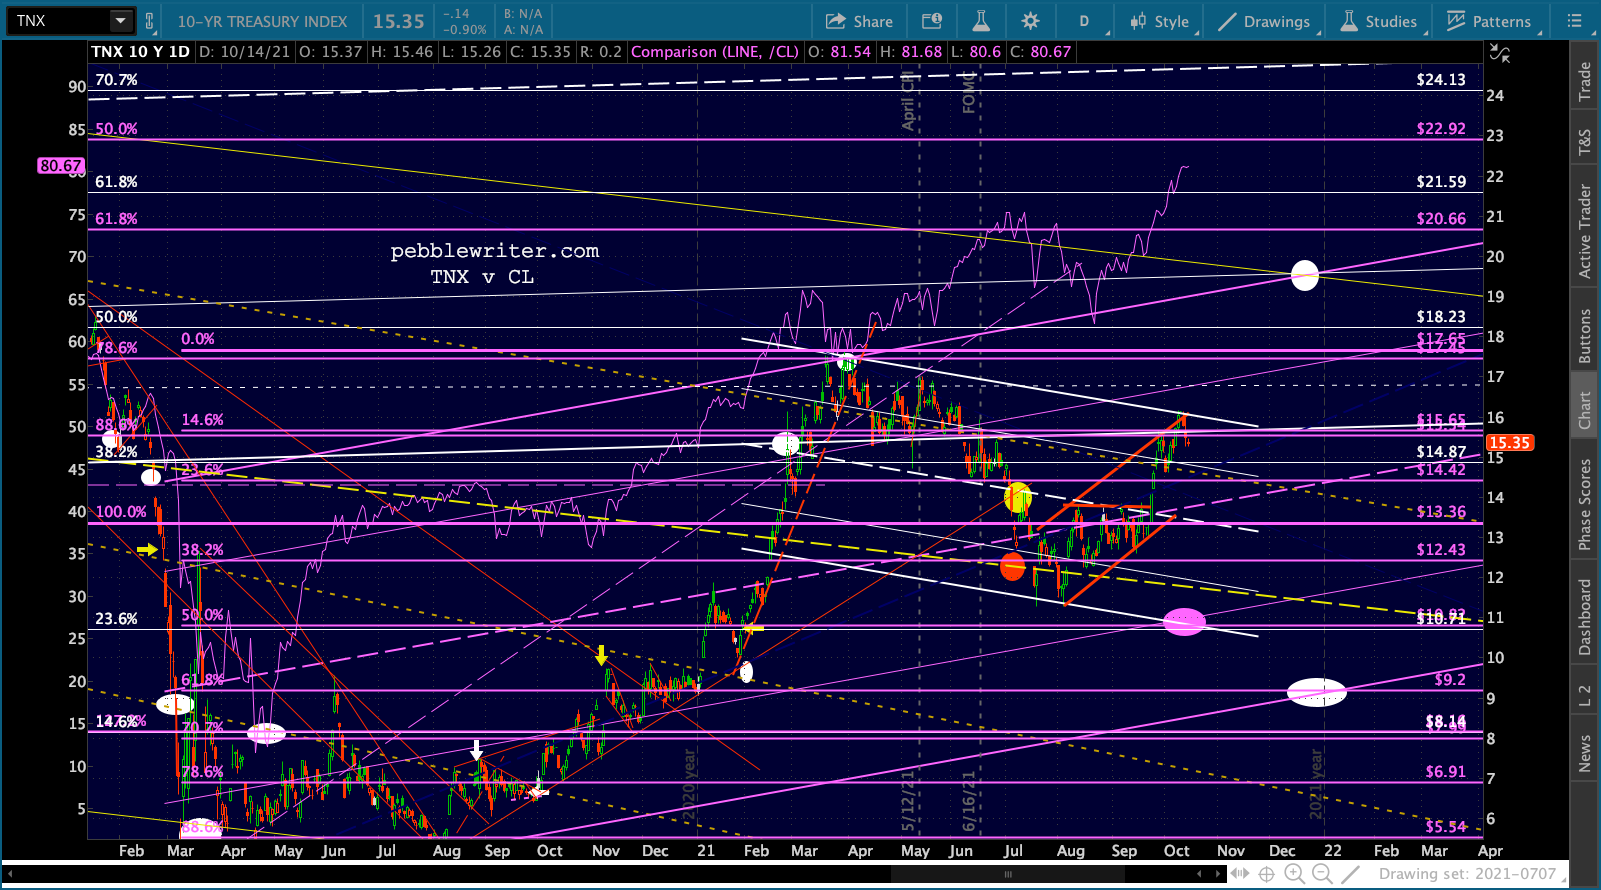 If the correlation holds, this means that CL should also be reversing. Remember, EIA inventories were delayed until 11:00 ET today due to the holiday on Monday.
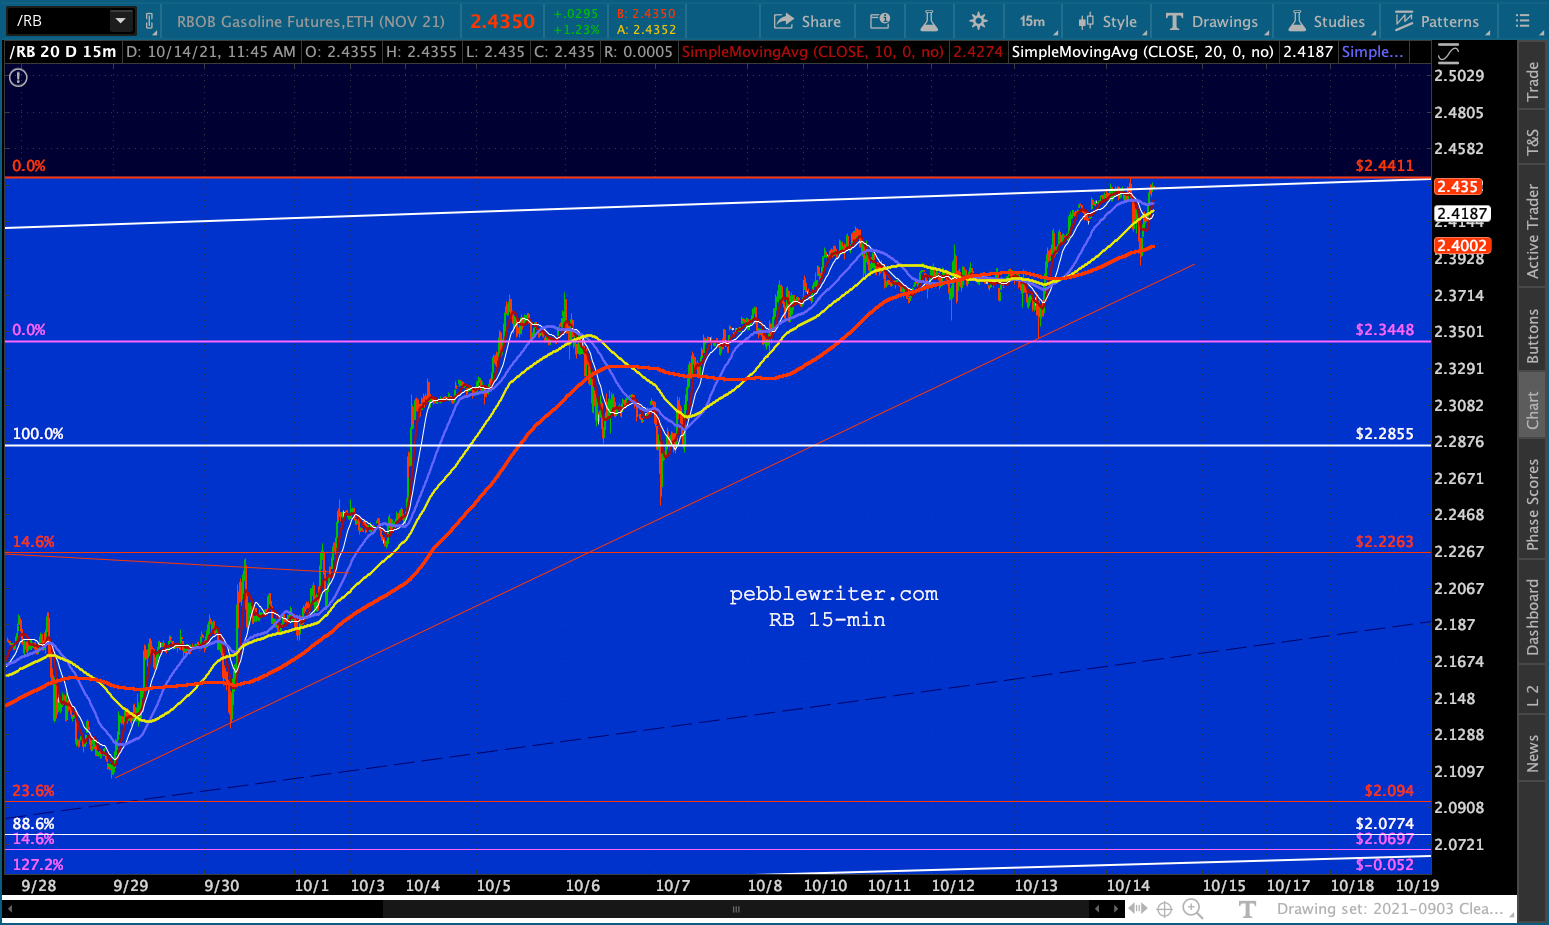
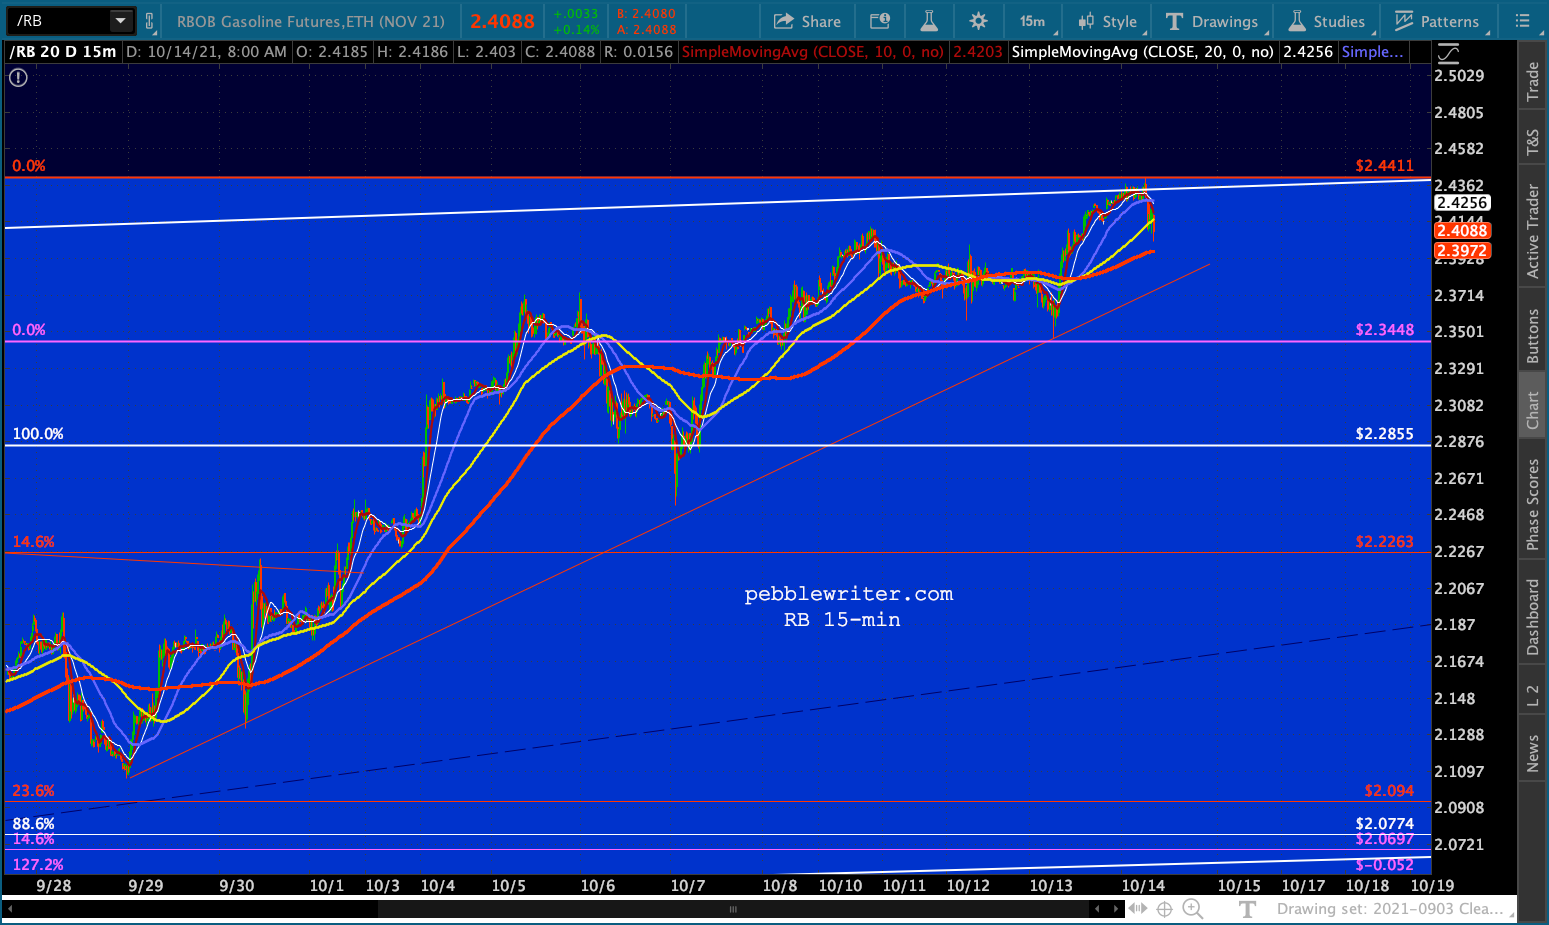
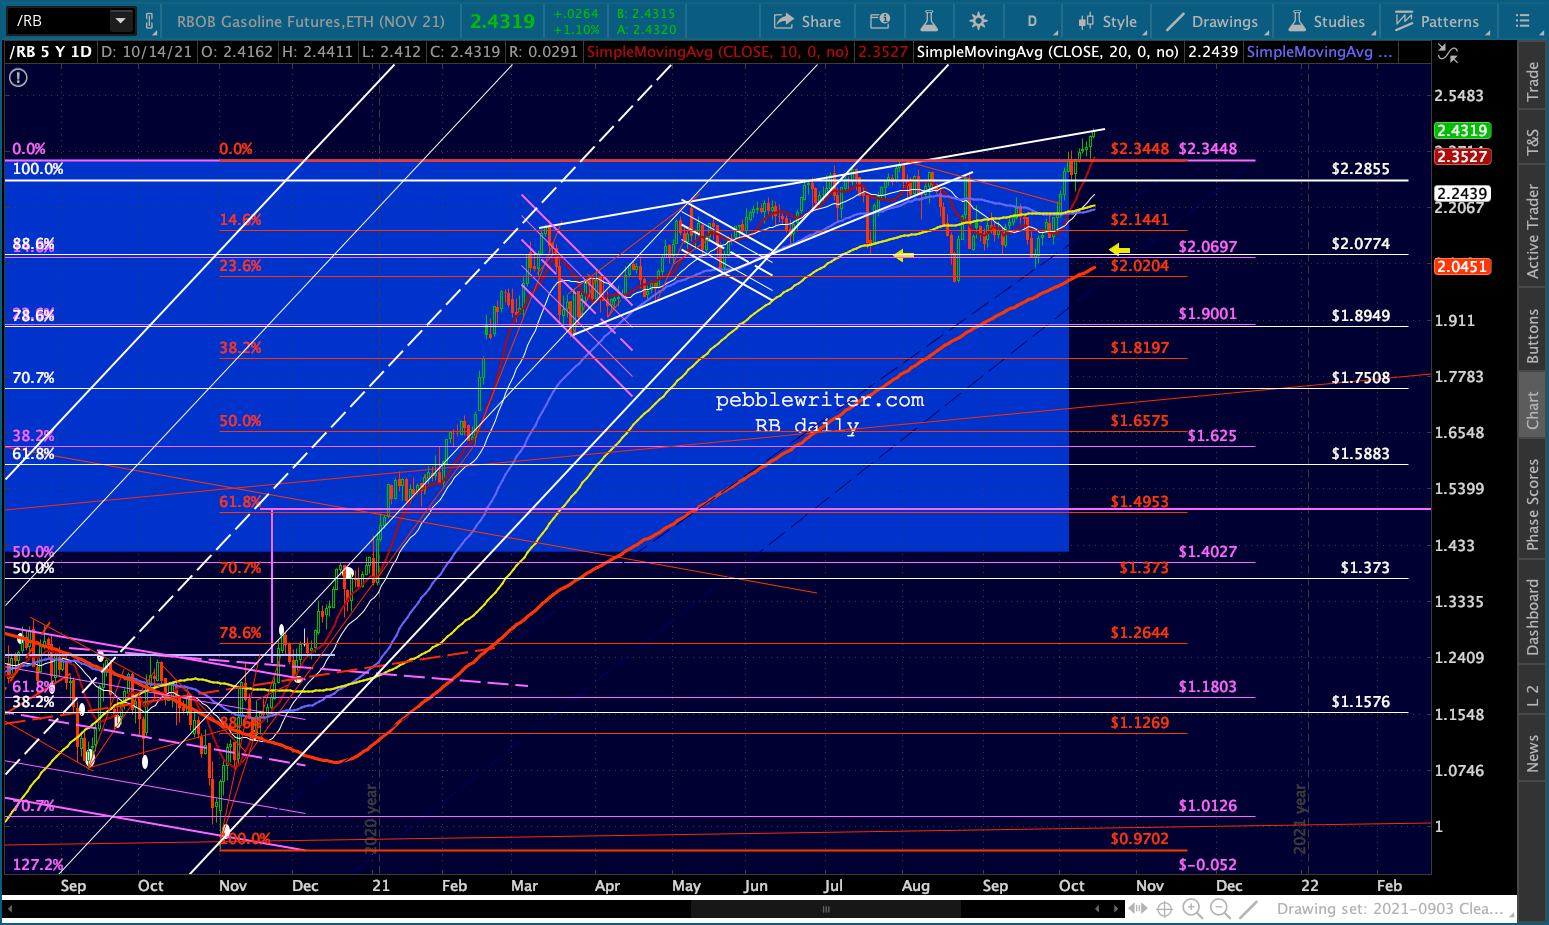 Another way of looking at RB, with its SMA200 coming up on the bottom of its rising white channel around Oct 20…
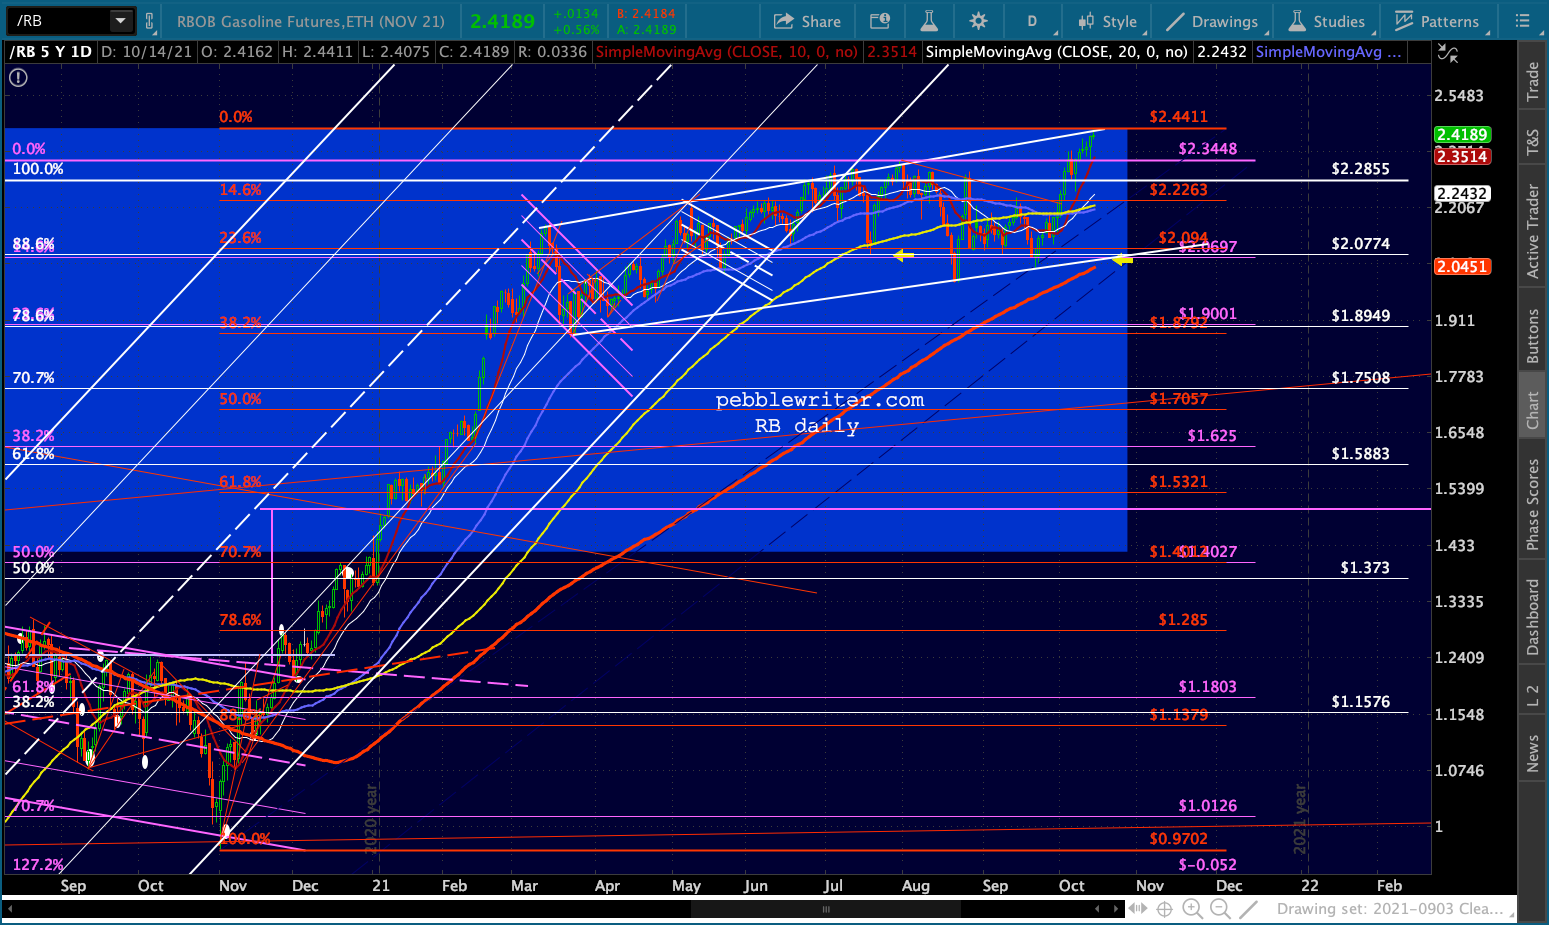
And, the administration is stepping up its efforts to bring oi/gas prices down.
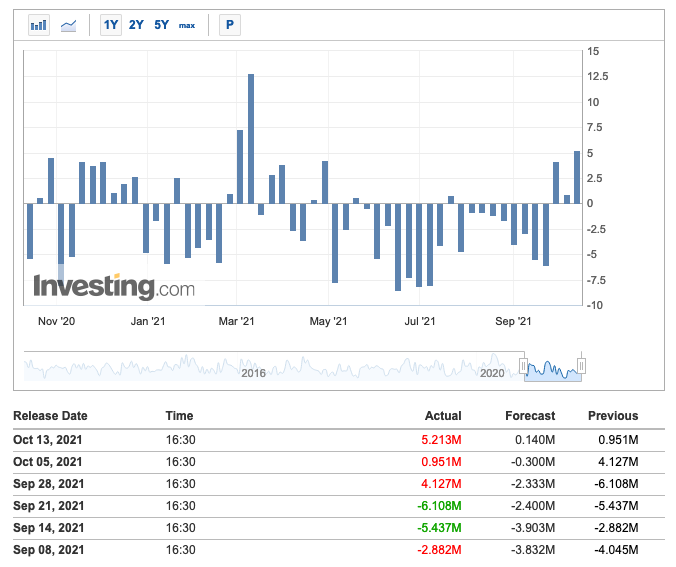
 API showed a substantial surprise build.
UPDATE: 10:12 AM
SPX has backtested the rising purple channel midline and the SMA60 200.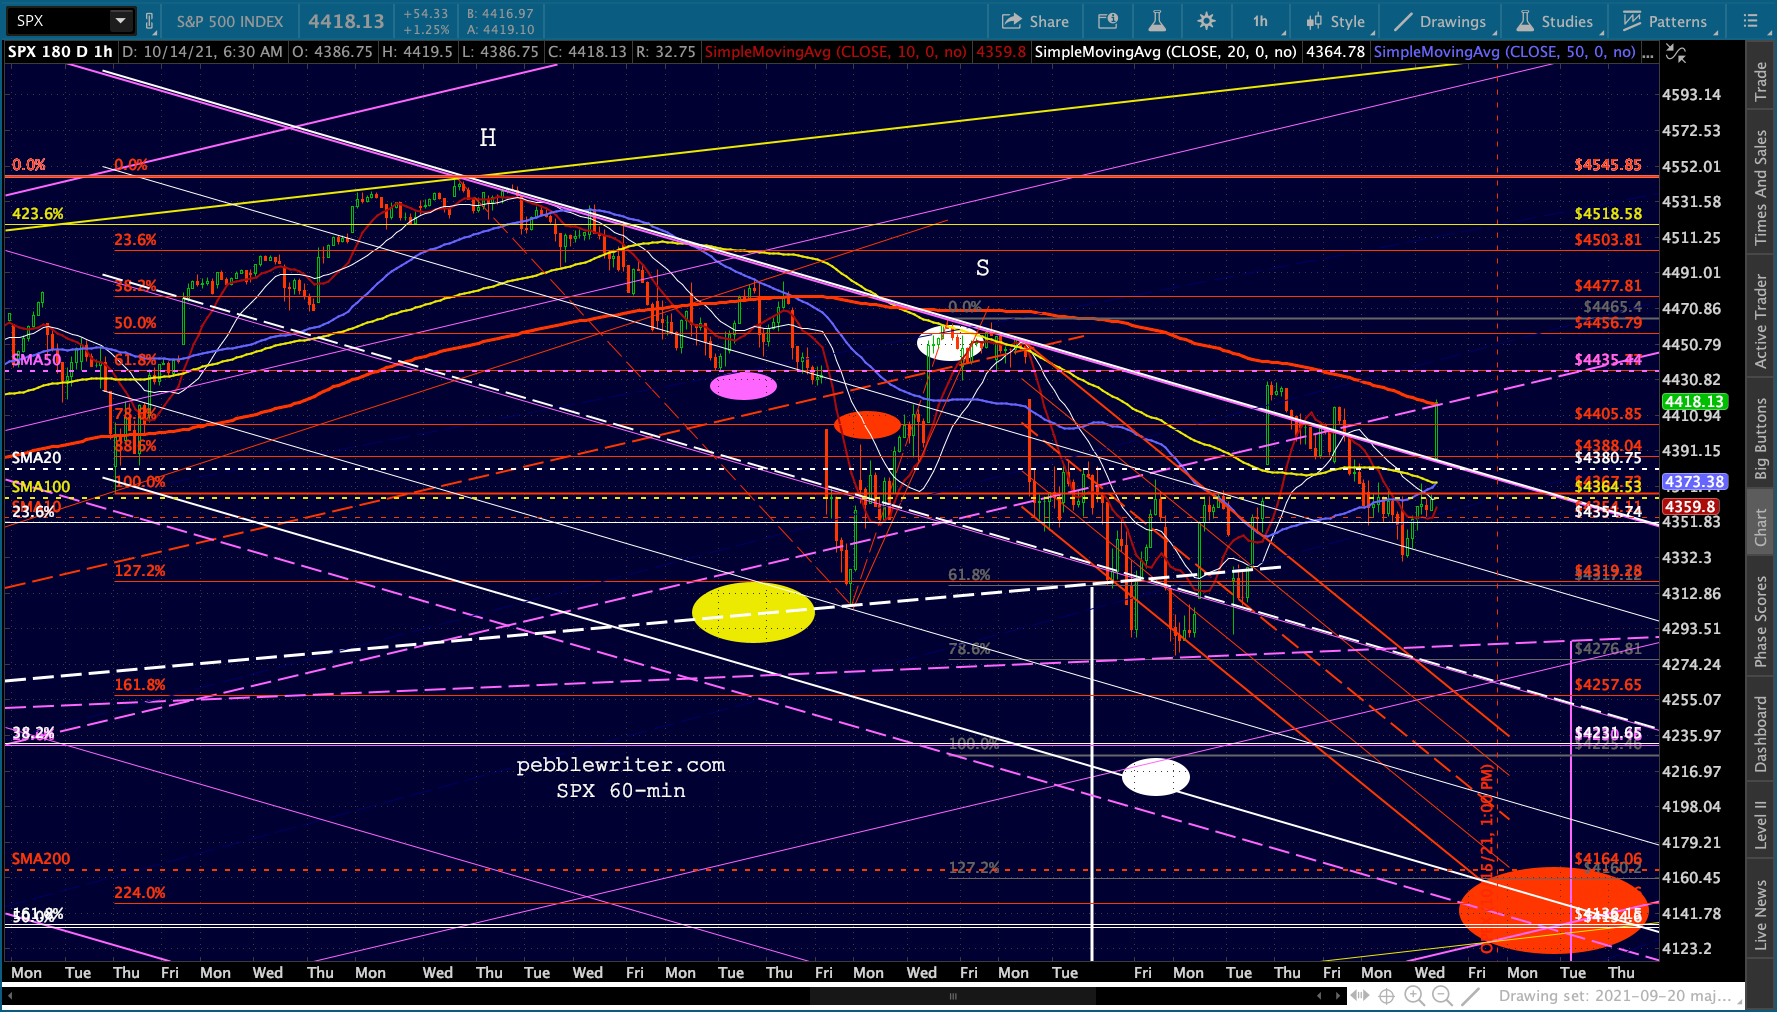 UPDATE: 11:08 AM
Crude inventories popped by 6.1MM barrels, though gas decreased by 2MM.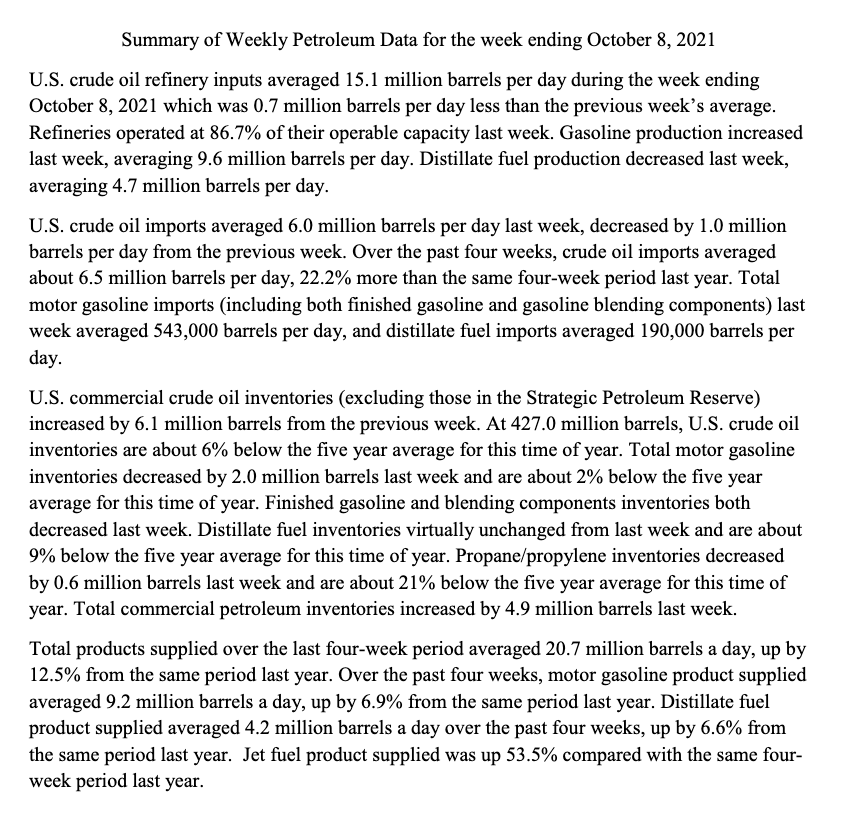 Initial reaction by both…
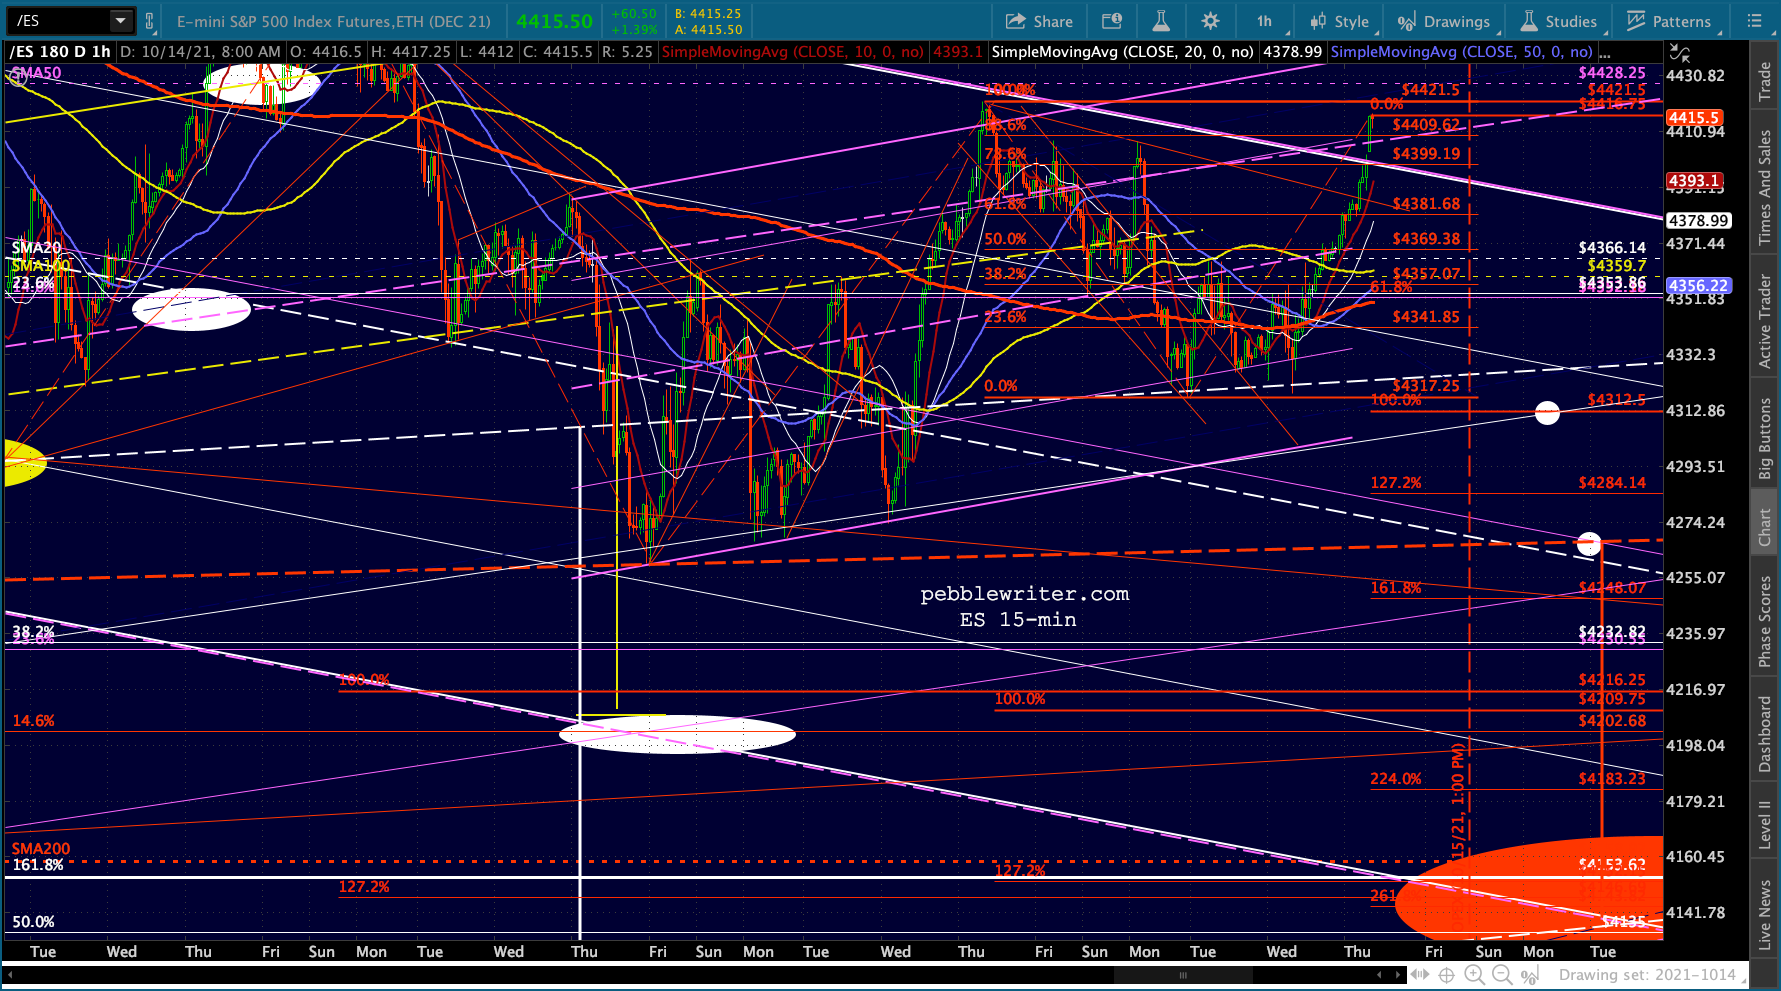
 ES seems to be backing off its threat to break out…
 …and NKD has backtested its SMA200.
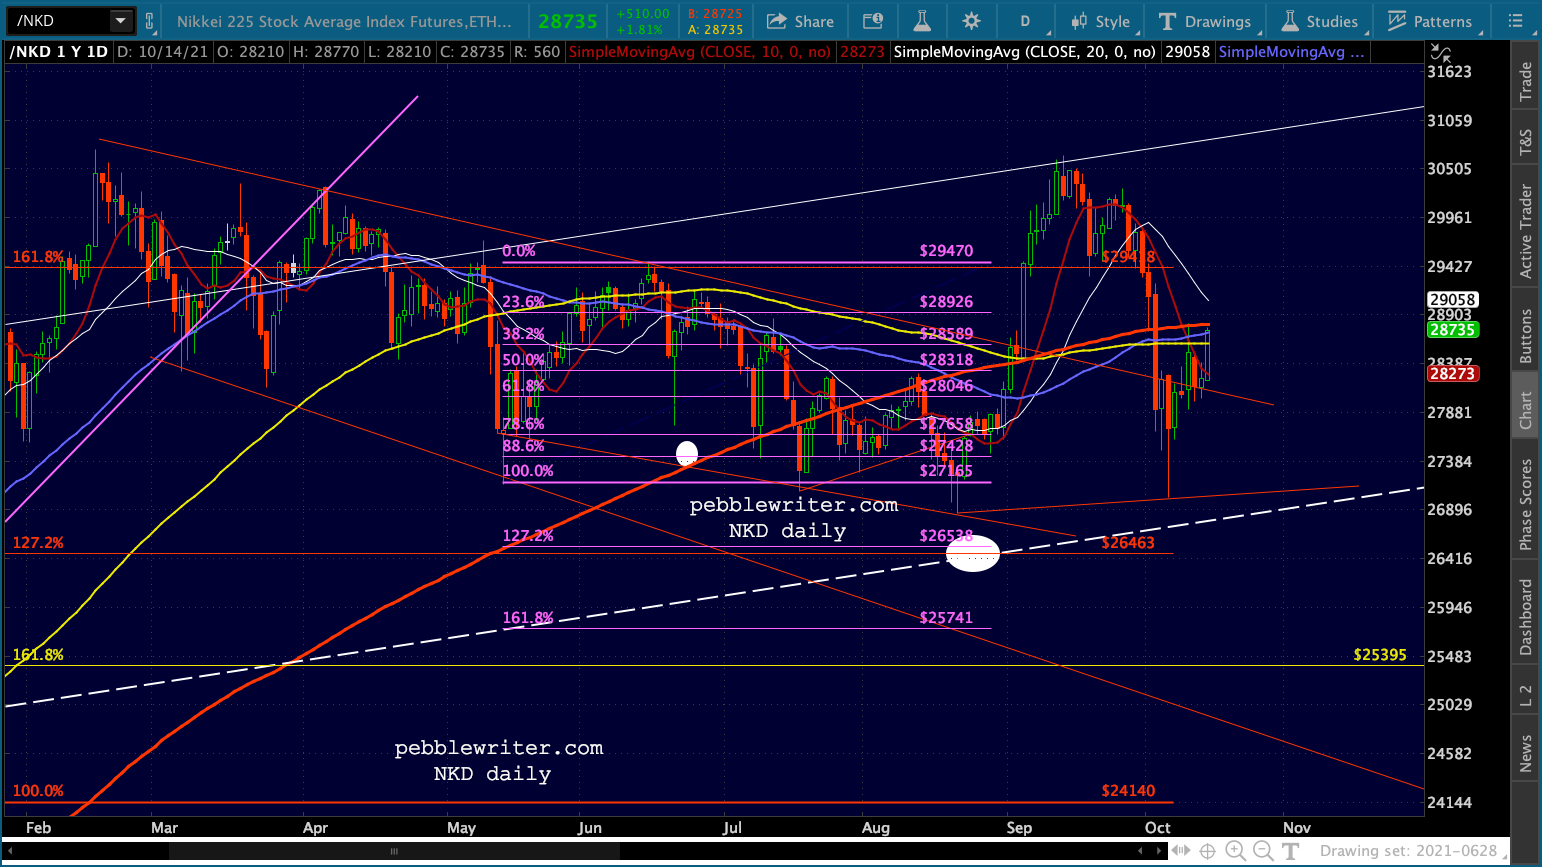 Even the DJIA is backtesting a TL and its SMA50 while its SMA200 arrives at an acceptably benign level of support.
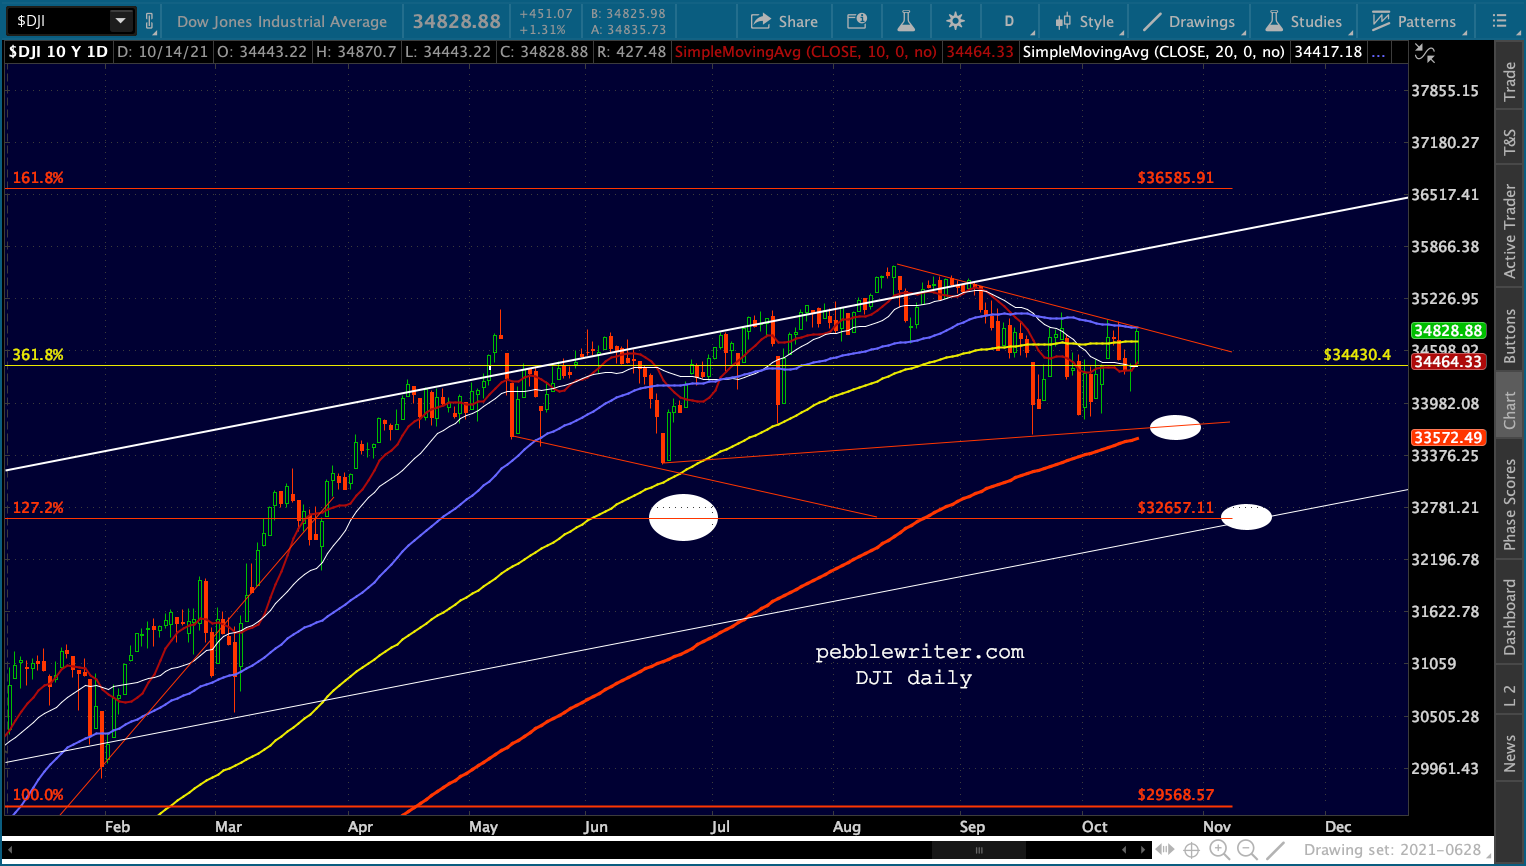 UPDATE: 11:40 AM