

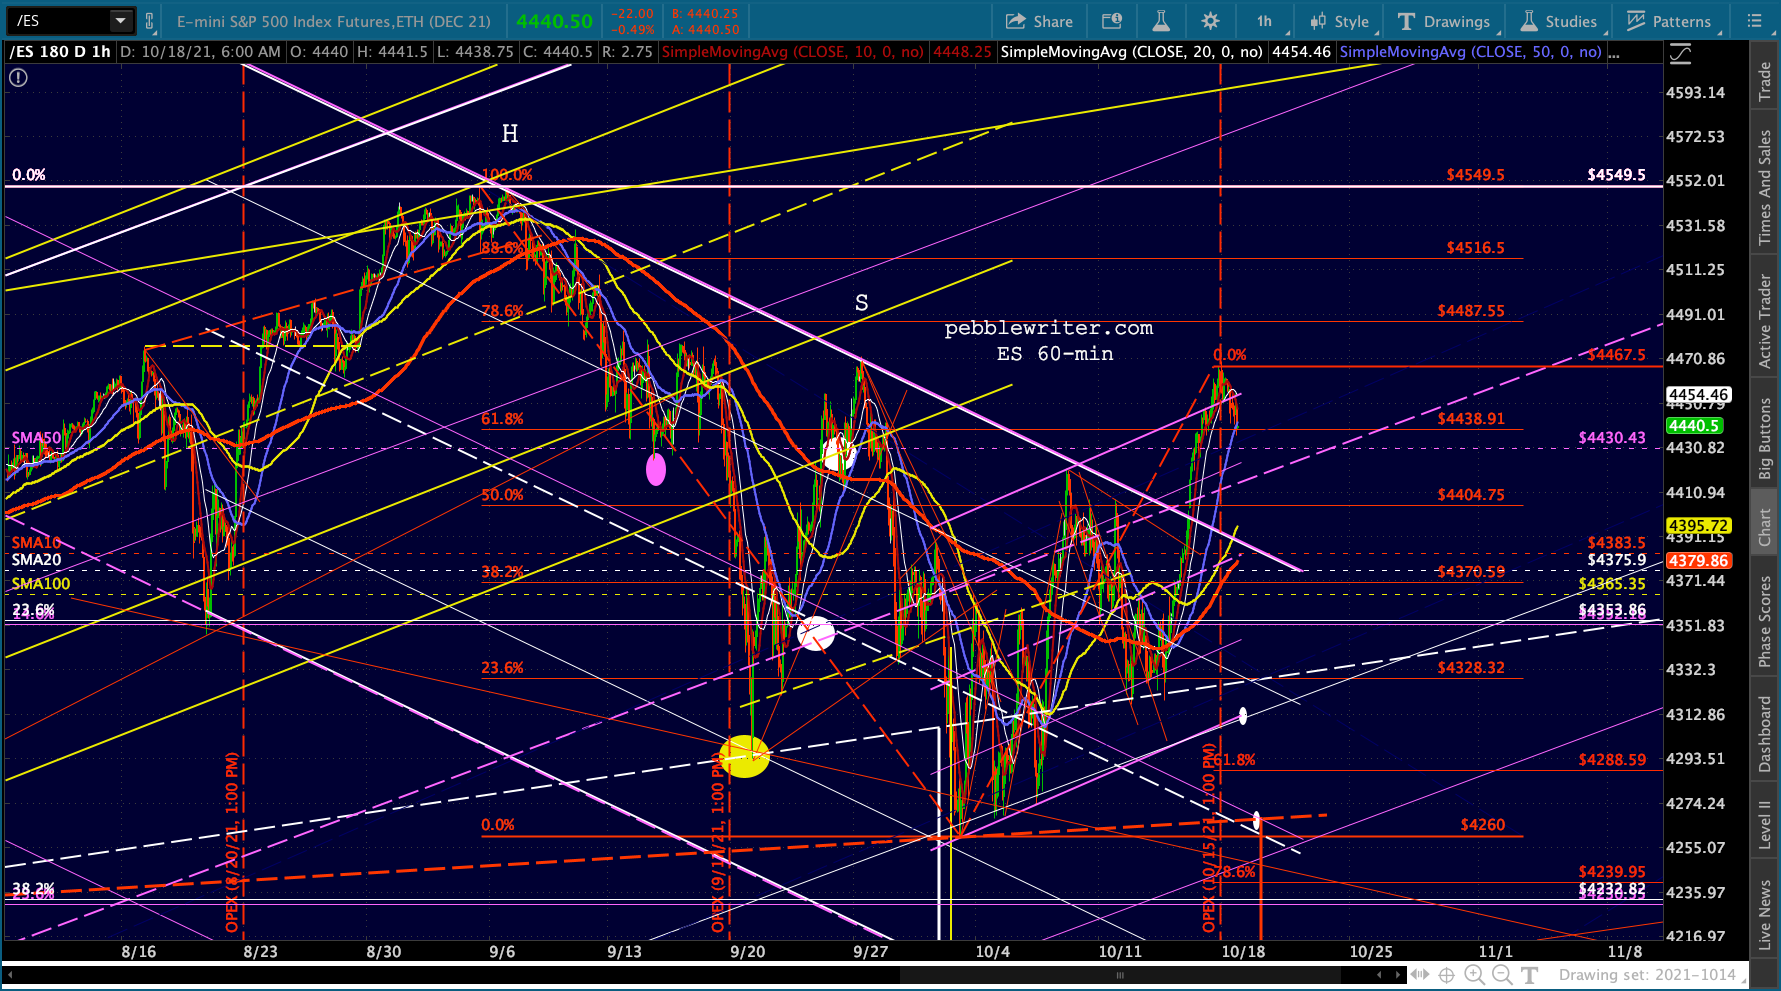
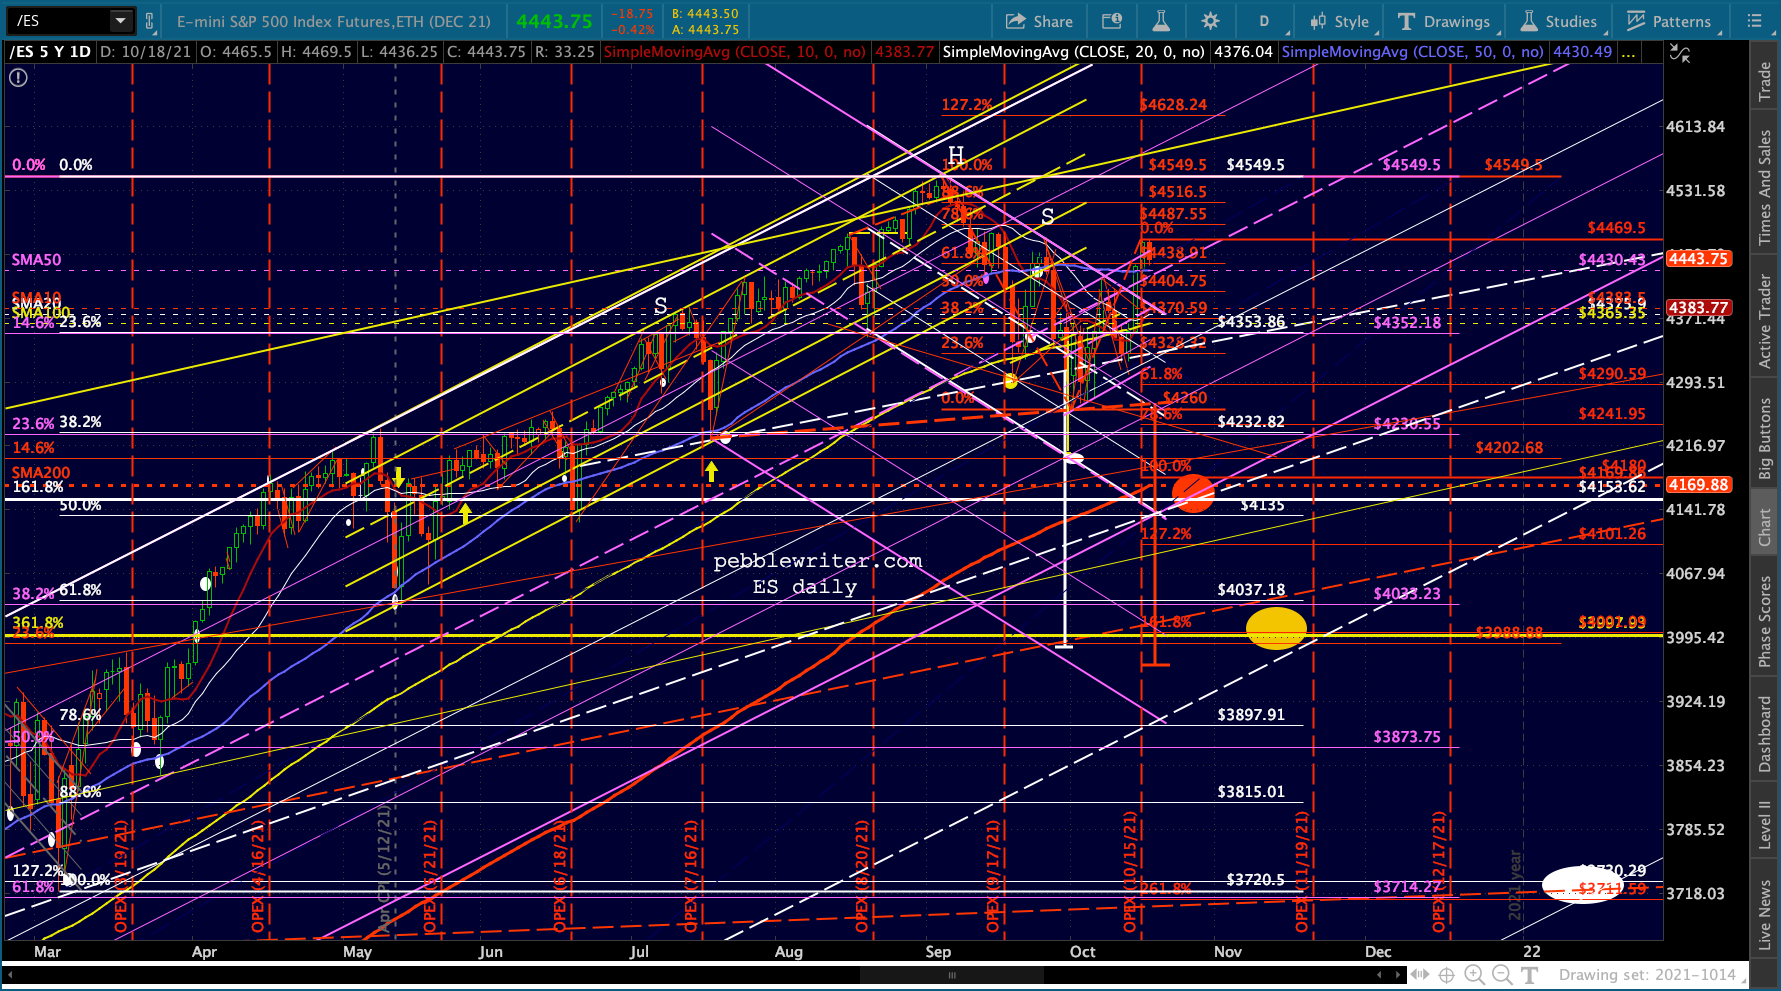
Futures are off about 20 points this morning, but it’s last week’s breakout that has us wondering whether the downside case is still intact.
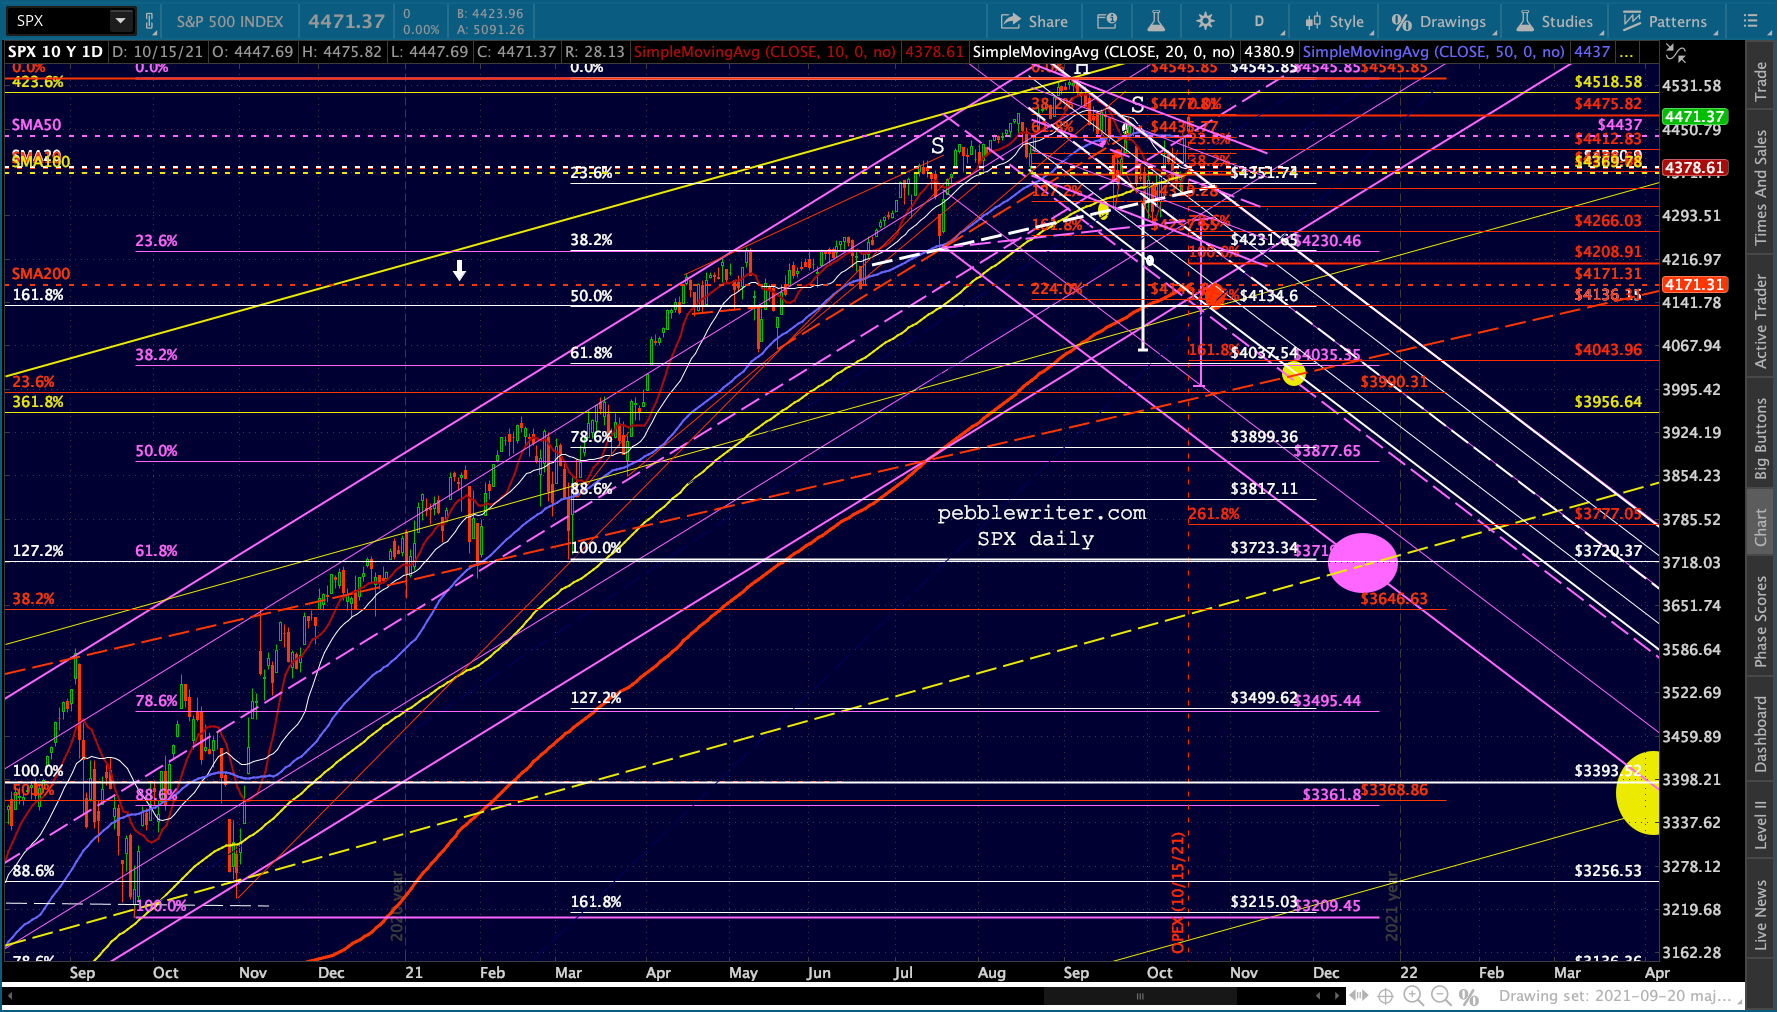
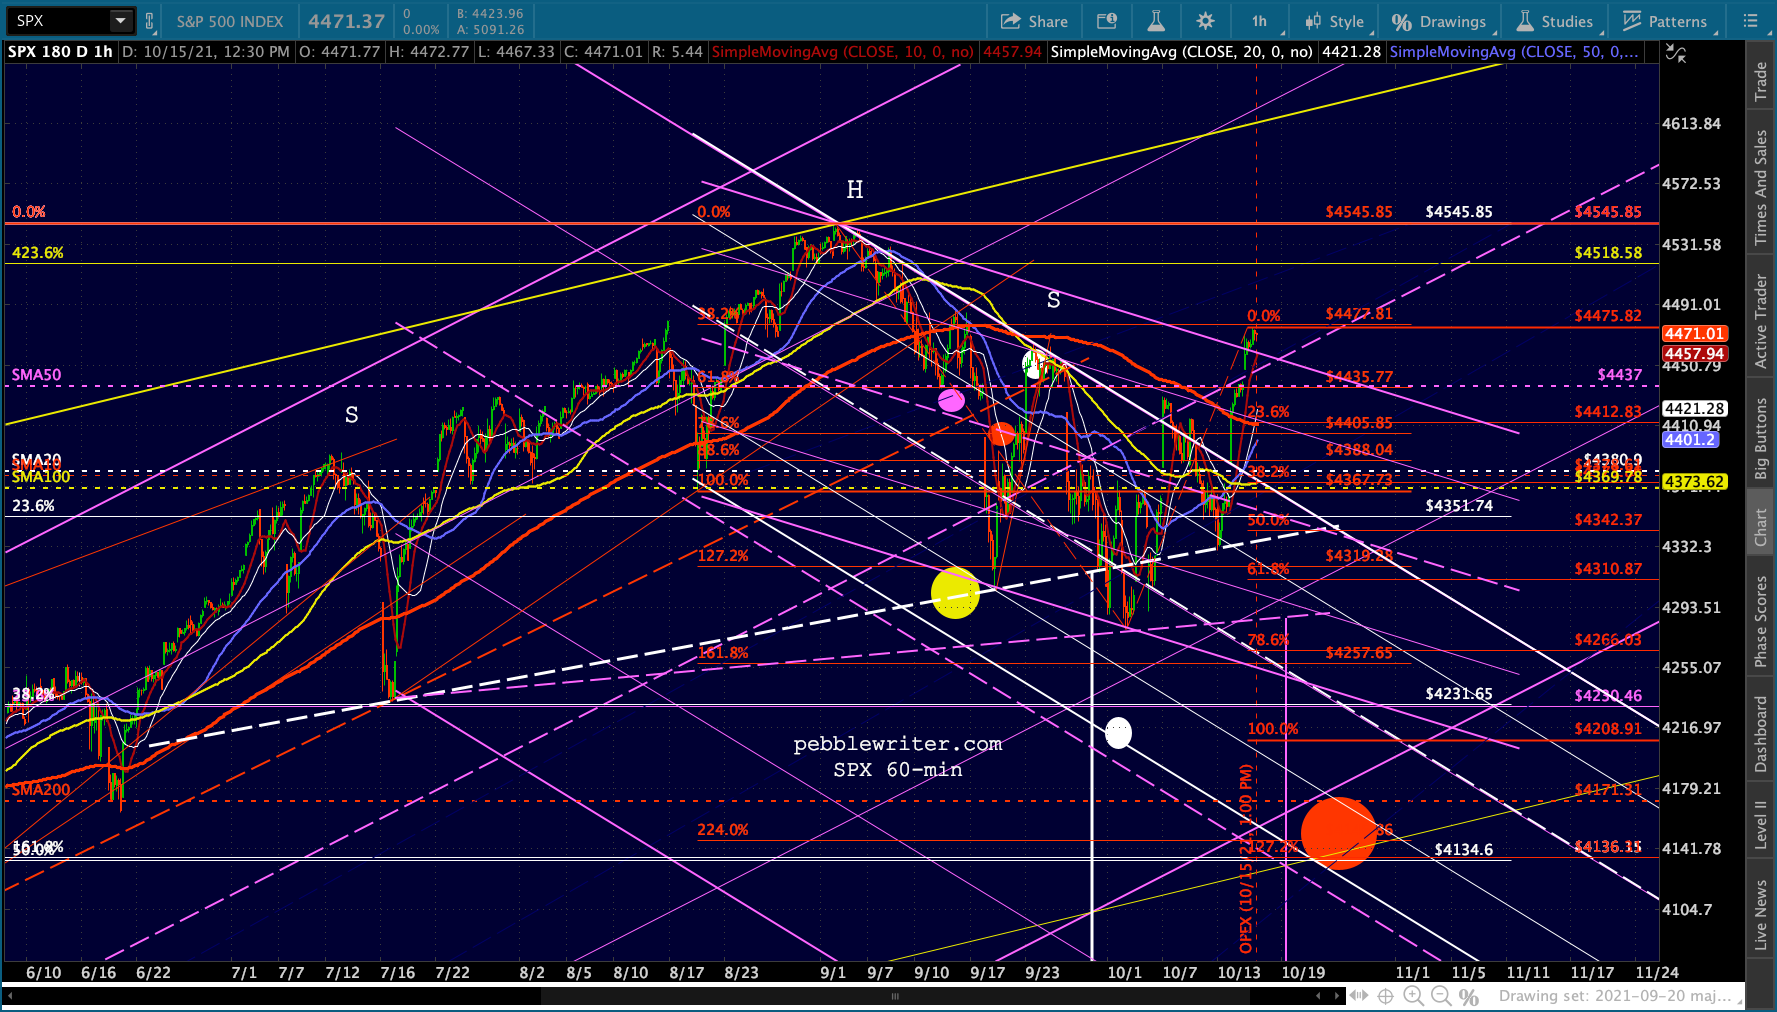
continued for members…The overall view for ES/SPX: a breakout of the falling white channel and even a less aggressive purple channel shown on SPX below.
 The OPEX surge was impressive, but was driven largely by the same old algo bait as always:
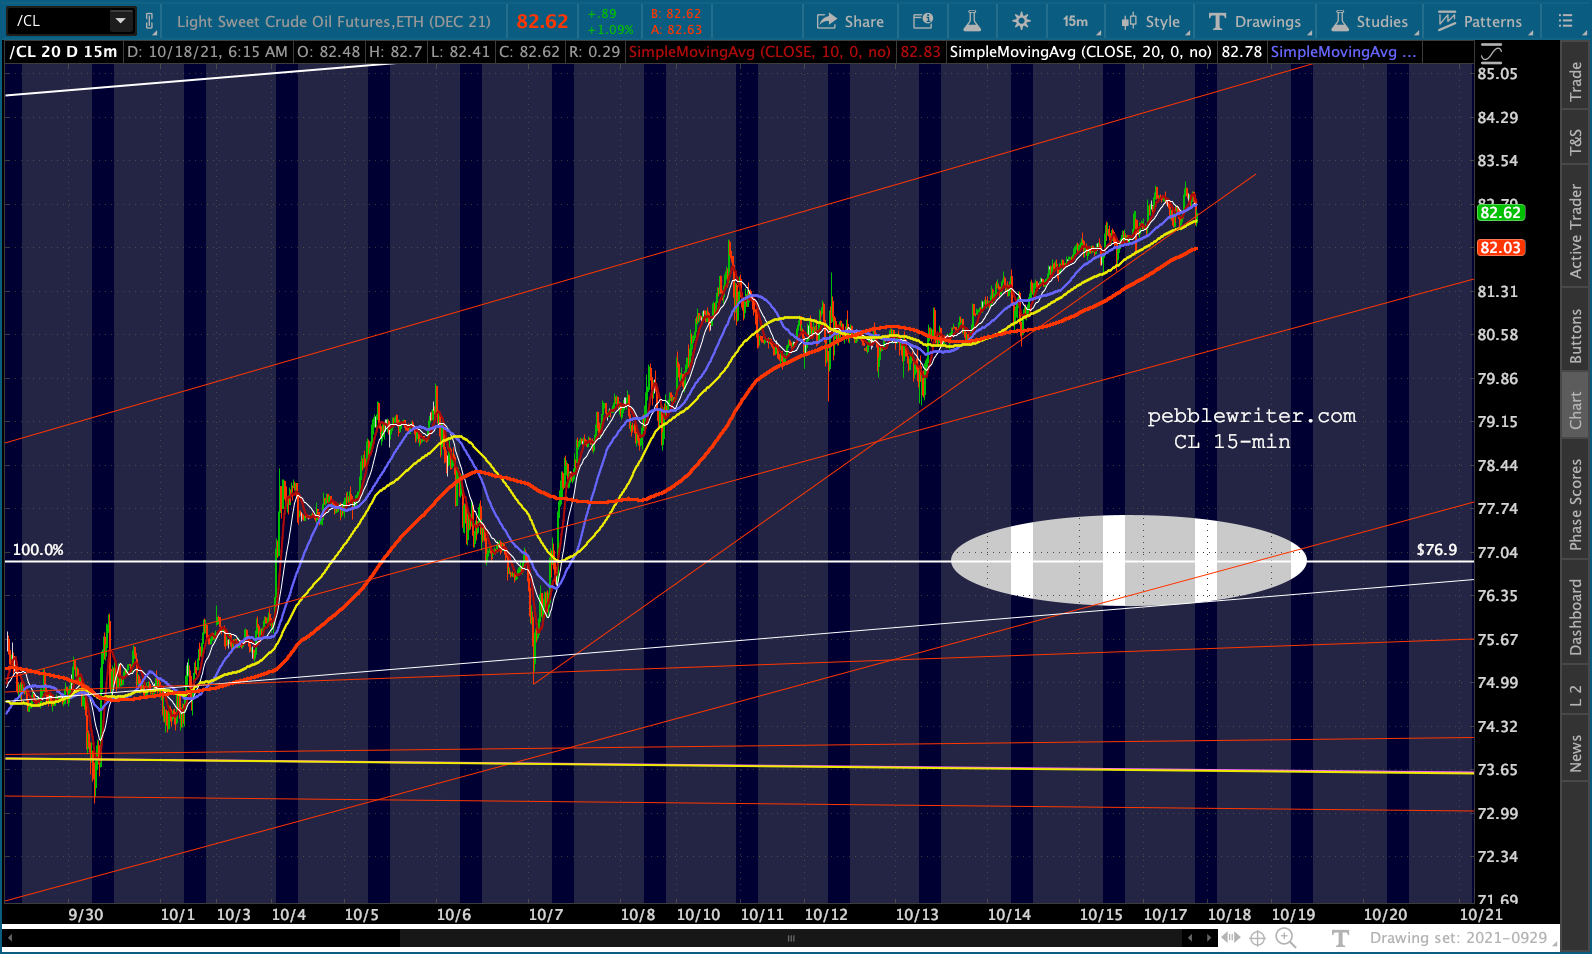
CL – which has so far been unable to string together more than two down days in a row…
 USDJPY – which has continued to ignore backtest opportunities but has run into overhead resistance…
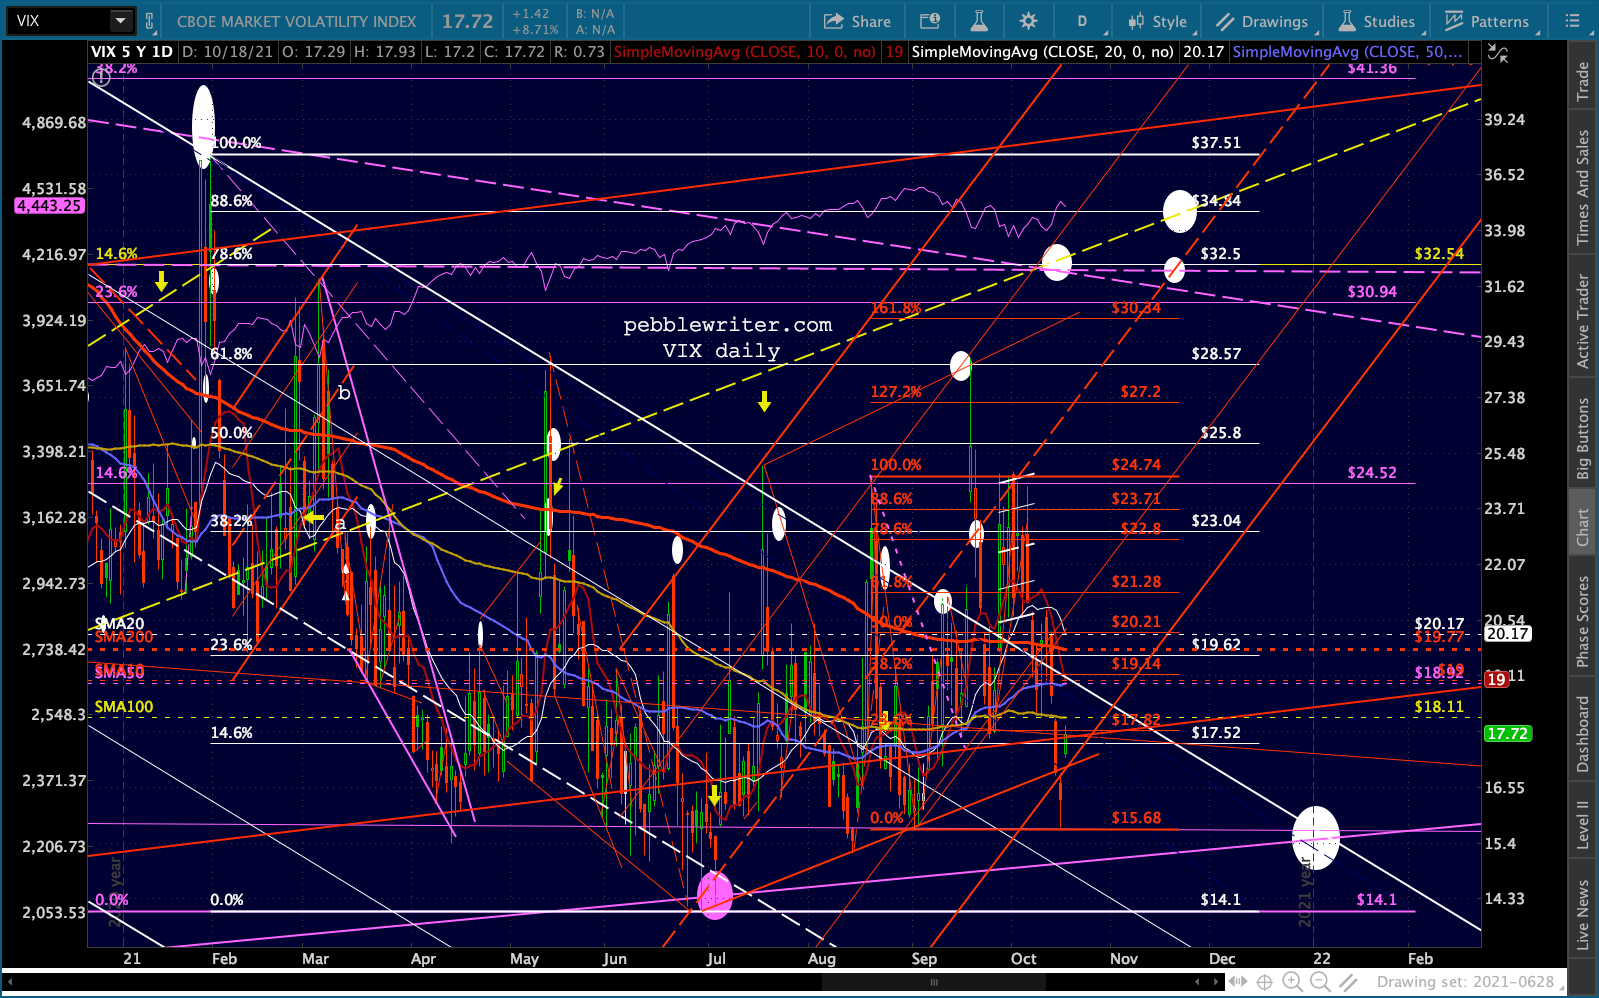
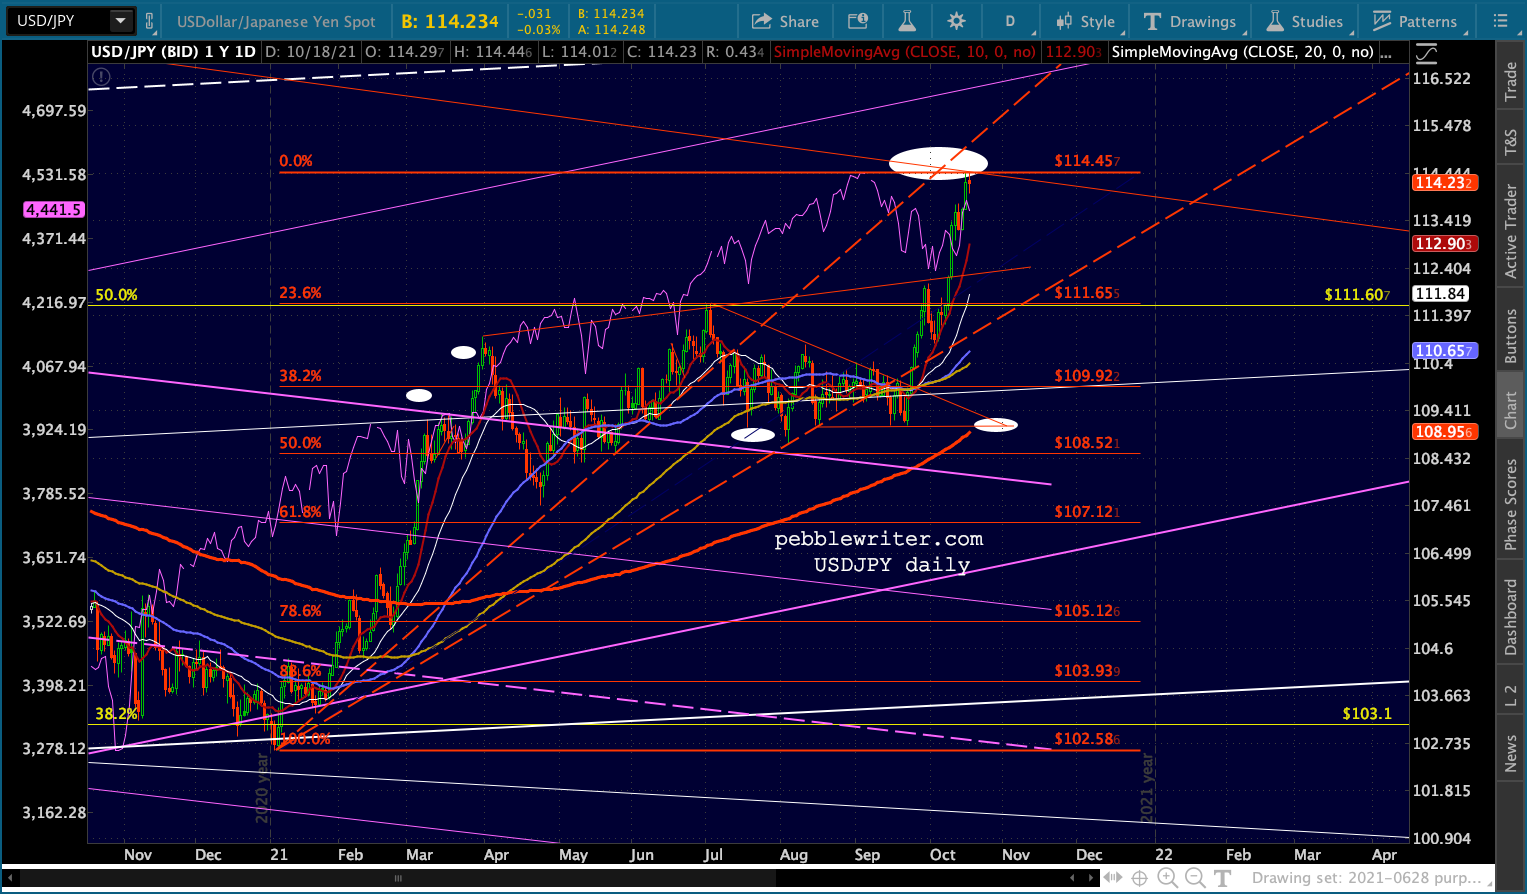 And, VIX – which broke down below the red TL on Friday (after gapping down through all the MAs and seeing a bearish 10/20 cross) but has since rebounded back above it.
 Due to the impact that higher oil prices is having on worrying inflation levels and the ability of the yen to weaken, I think it’s probably VIX that will deteremine what happens next in the equity markets.
Recall that VIX got a nice bounce off the rising purple TL below in June. At that point, it began establishing a rising trend marked by the red channel shown below. The problem is that the red channel kept breaking down – even though it resulted in higher lows and higher highs.
 While the rising red channel might continue to offer hints as to the timing of breakdowns, it has lost its predictive power in terms of upside potential. I’m going to change it to gray and insert a new rising red channel that better captures the recent price action.
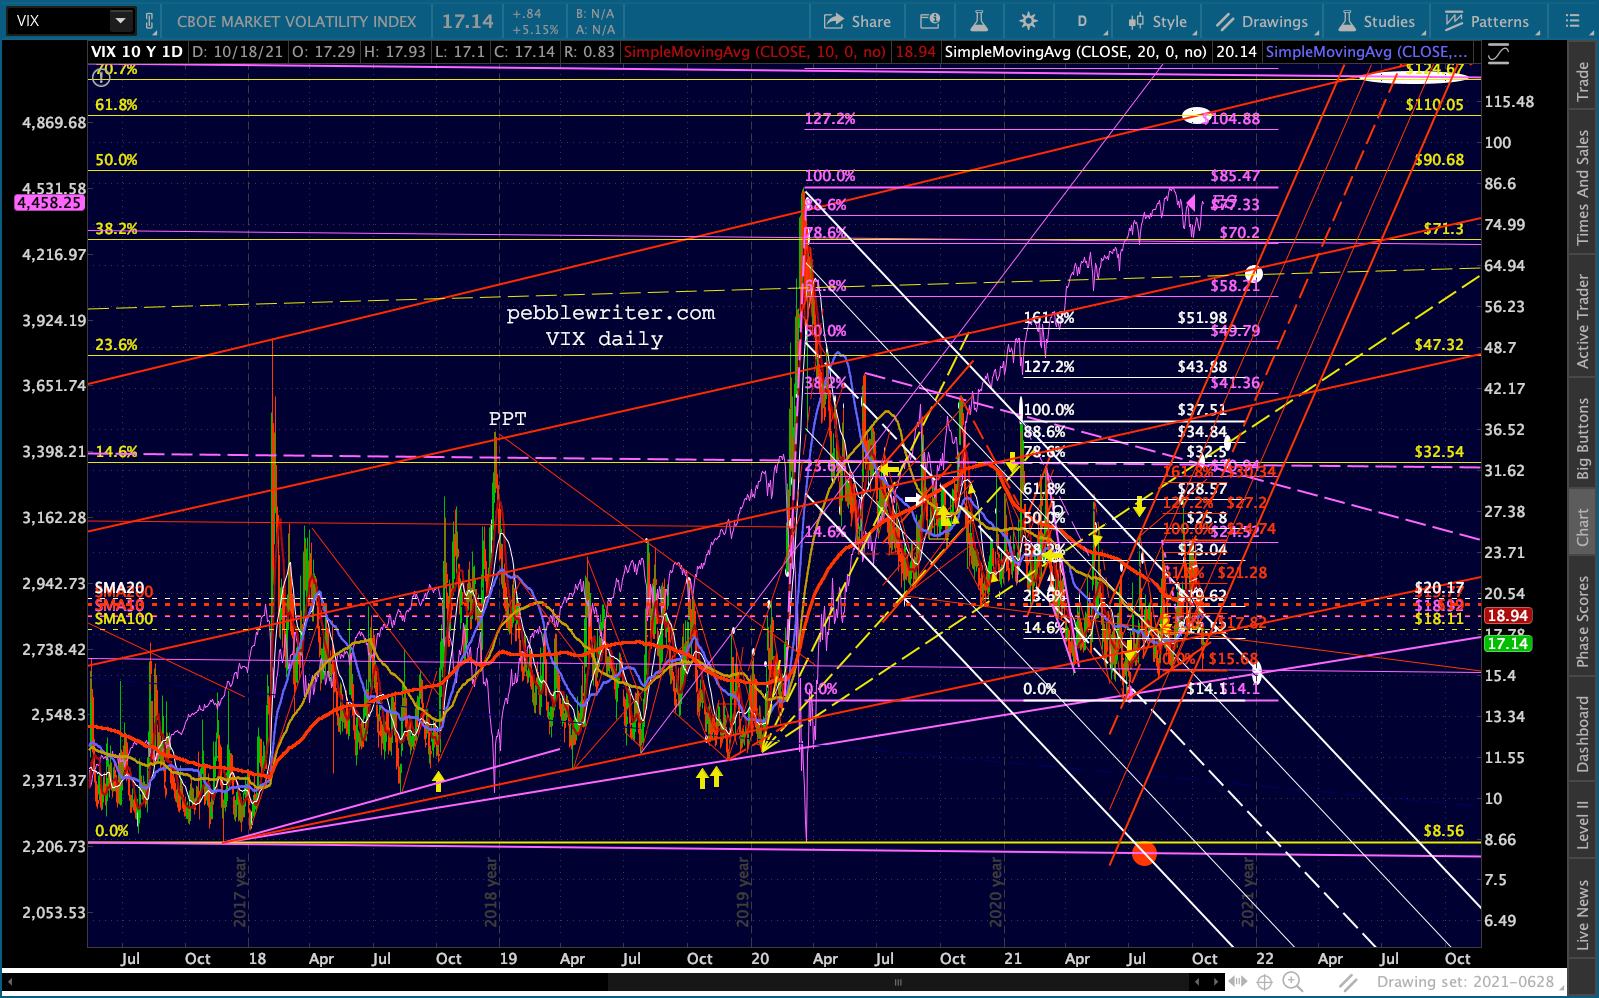
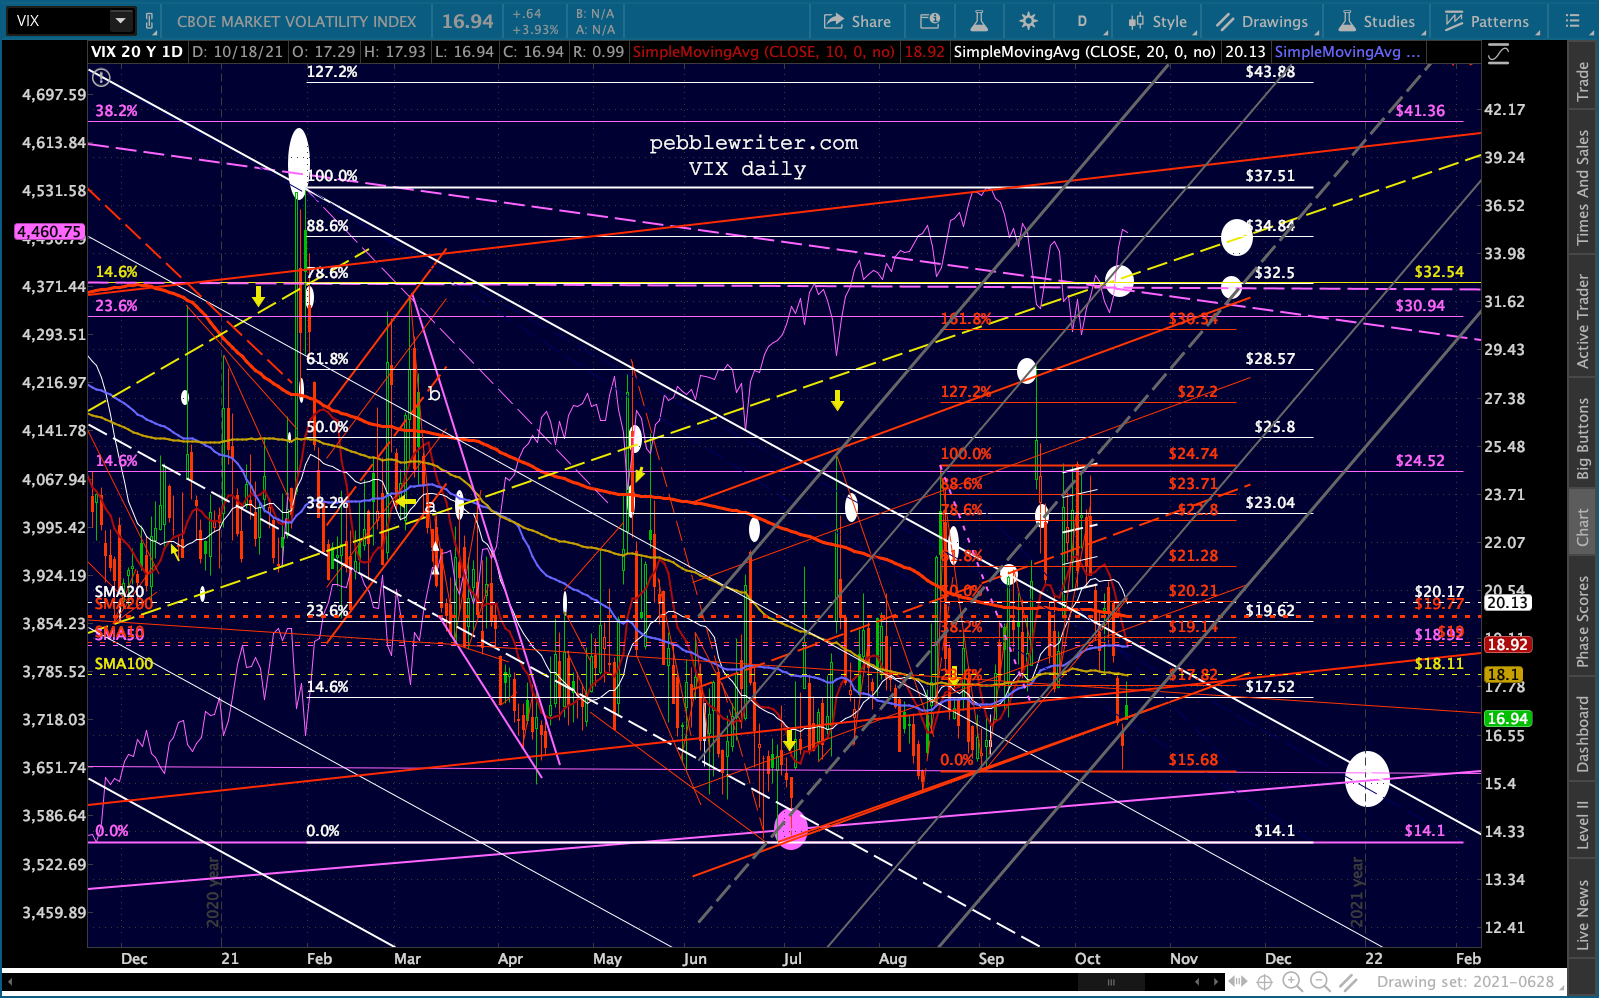 Note that the Sep 20 high at the white .618 (28.57) sets up a potential Gartley or Bat Pattern which would target 32.5 or 34.84 respectively. We have to weigh this pattern against the fact that VIX is back within the falling white channel from Mar 2020 and, of course, the bearish 10/20 cross.
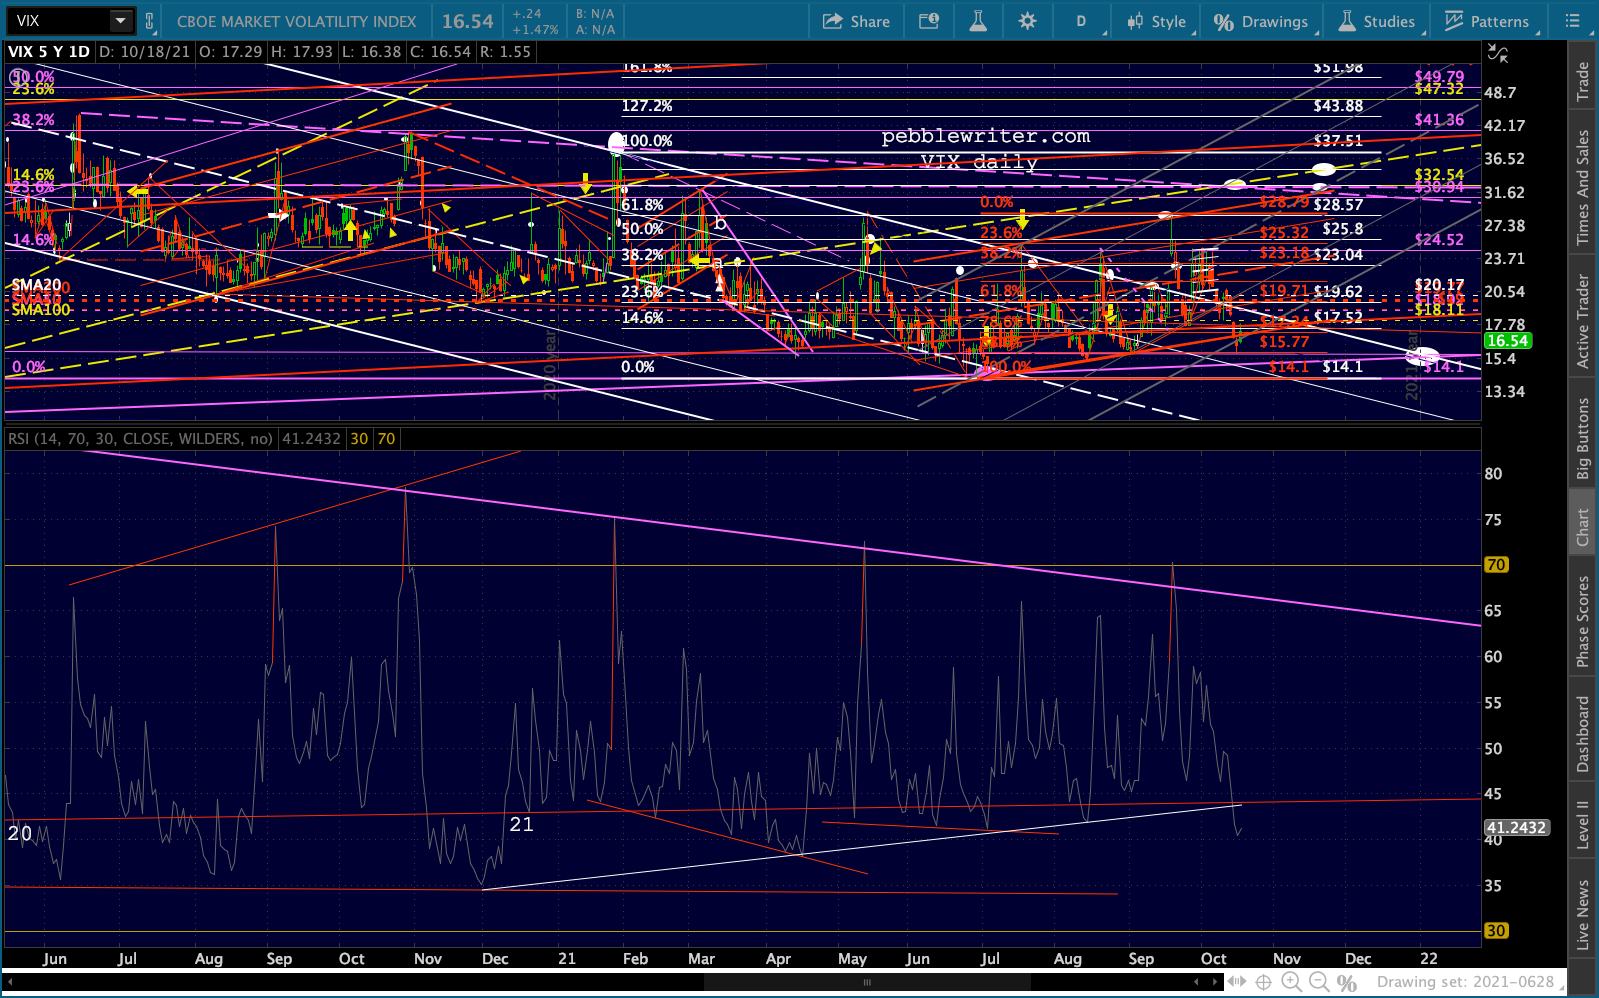
I’ll make one last adjustment by removing the red Fibonacci grid and replacing it with one which shows that Friday’s lows were right at the .886 retrace of the rise from Jun 29 to Sep 20.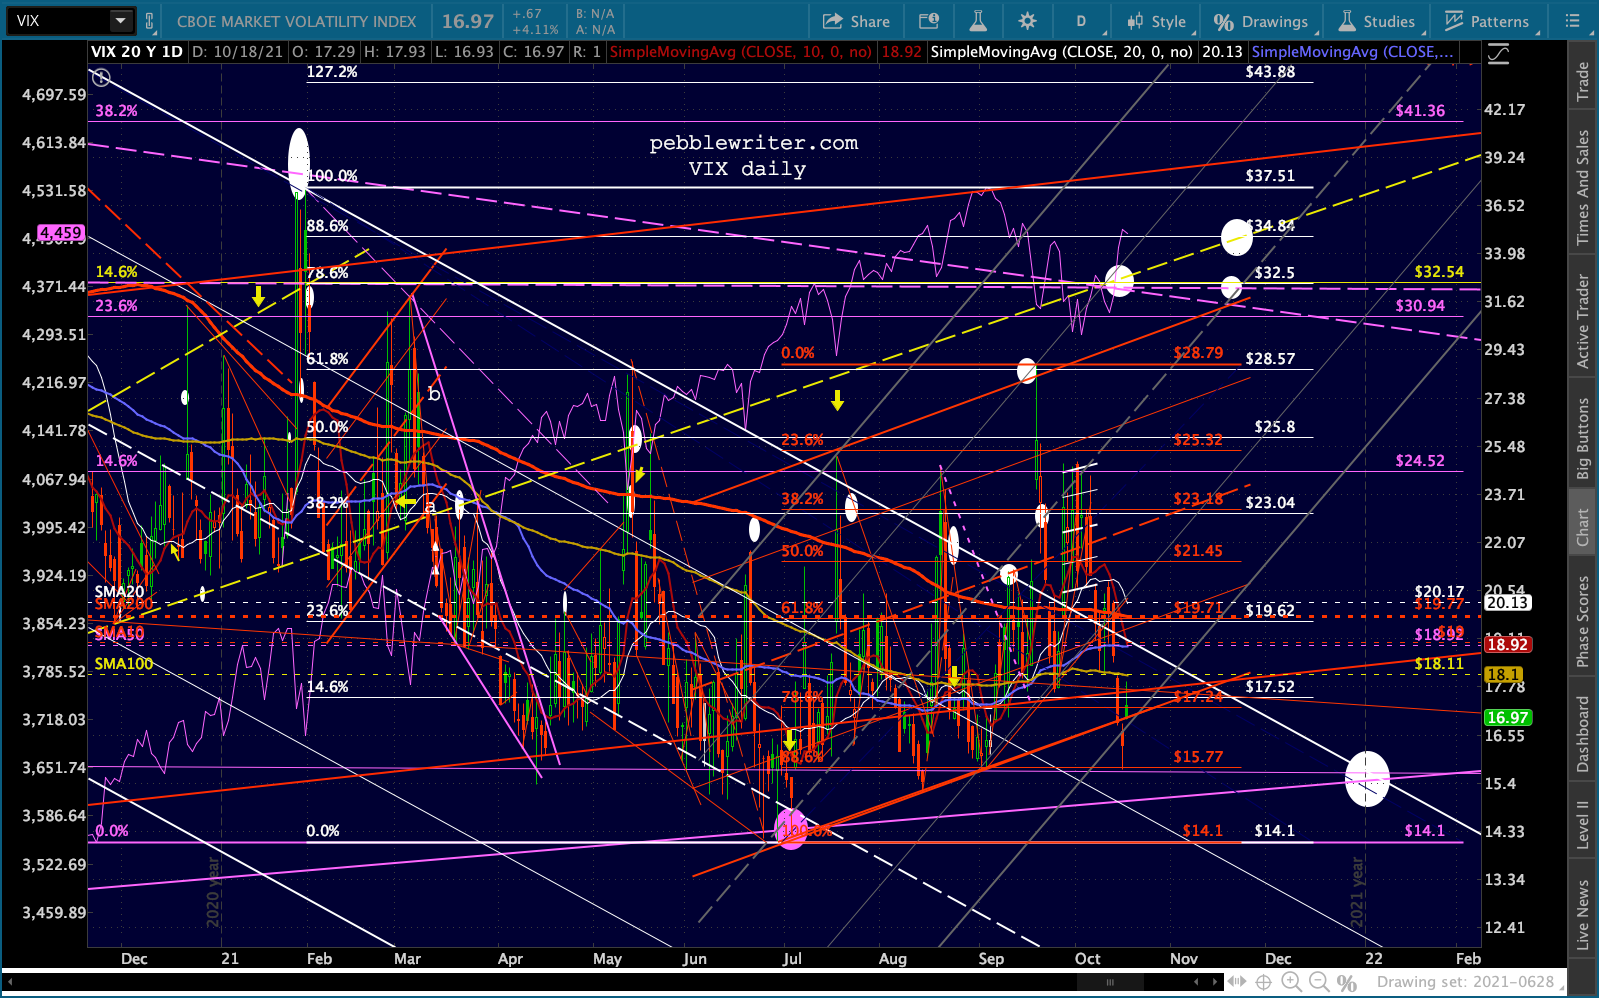 I’ll be watching very closely to see what VIX does after closing the gap from Friday at 16.42. Will its RSI breakdown hold or will it bounce back?
 I’ll also be watching moving averages. On Friday, SPX’s SMA10 closed at 4378.61, just under the SMA20 at 4380.90. Today, intraday at least, the SMA10 has crossed above the SMA20. I don’t want to pin too much on this bullish indicator, but combine it with SPX topping its SMA50 and the other factors above, and there’s a very good chance that SPX’s breakout will persist.
Now, if SPX were to dump 40 points by the end of the day and the bullish cross go away, I’d be as bearish as ever. But, for now at least, the table is tilted in favor of the bulls.
Stay tuned.